SACD SupportingStatement_B_12-19-06_final
SACD SupportingStatement_B_12-19-06_final.doc
Social and Character Development Research Program National Evaluation (KI)
OMB: 1850-0792

Social and Character Development Research Program National Evaluation
Supporting Statement for Request for OMB Approval of SACD Evaluation – Part B
Original Submission: February 20, 2004
Prepared by:
John Burghardt
Laura Kalb
Larry Snell
Peter Schochet
Susanne James-Burdumy
Revised Submission: December 15, 2006
Prepared by: Amy Silverman
Submitted to:
Teaching and Learning Division National Center for Education Research Institute of Education Sciences U.S. Department of Education 555 New Jersey Ave., NW Washington, DC 20208
Project Officer:
|
Submitted by:
Mathematica Policy Research, Inc. P.O. Box 2393 Princeton, NJ 08543-2393 Telephone: (609) 799-3535 Facsimile: (609) 799-0005
Project Director: |
|
|
CONTENTS
Page
B. COLLECTION OF INFORMATION EMPLOYING STATISTICAL
METHODS 1
1. Respondent Universe and Sampling Methods 1
2. Statistical Methods for Sample Selection and Degree of
Accuracy Needed 5
3. Methods to Maximize Response Rates and to Deal with
Nonresponse 12
4. Tests of Procedures and Methods to Be Undertaken 20
5. Individuals Consulted on Statistical Aspects of the Design 25
B. COLLECTION OF INFORMATION EMPLOYING STATISTICAL METHODS
1. Respondent Universe and Sampling Methods
The SACD evaluation includes seven grantees who have already been funded by the Institute of Education Sciences through a competitive grant process.1 Original OMB clearance was obtained for each of the seven grantees to select between ten schools and fourteen schools for the multisite study, for a total of 72 schools (OMB No.: 1850-0792). To increase statistical power to detect meaningful program impacts, SACD Research Program grantees recruited additional schools during the 2005-2006 and 2006-2007 school years. OMB approval to extend data collection activities into a total of 100 schools was obtained on 8/19/2005 (Appendix A2). Thus, two cohorts of students in 100 schools are now being assessed during the final two years of the program. Cohort 1 includes students in 88 schools across seven different grant sites (each site randomized between 10 and 18 schools), and cohort 2 includes students in 12 schools across 4 different sites. Current OMB clearance expires on 5/31/2007. We anticipate that data collection will continue into June and July 2007. Current OMB clearance is sought to extend the currently approved collection through September 2007 since data collection extends into the summer months in many sites.
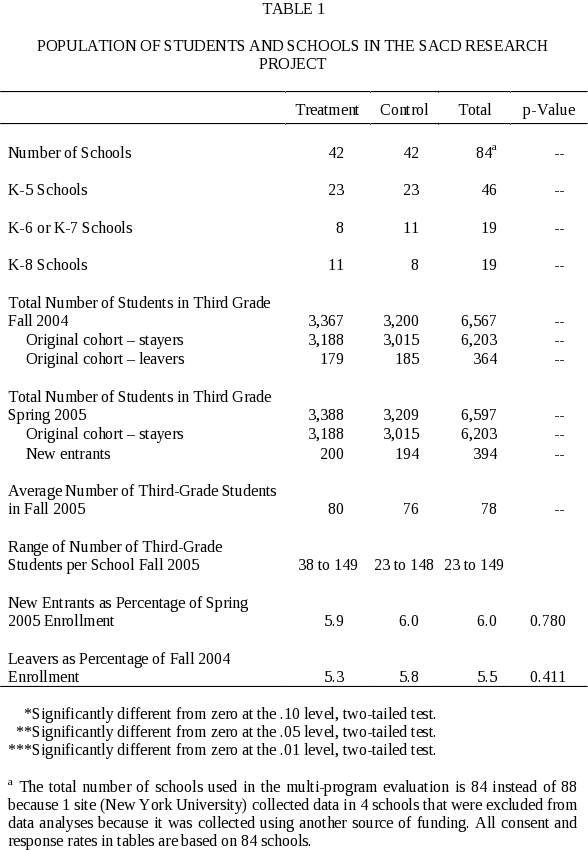
Individual grantees were responsible for recruiting schools to participate in the study. Schools involved in the study serve elementary school children in kindergarten through fifth grade and agreed to participate in random assignment of schools to treatment and control conditions. Thus, the respondent universe for the study included only respondents who were third graders in the 88 study schools at the time of baseline data collection (fall 2004). This included a total of 6,567 third grade students. Sites ranged from an average of 58 third grade students per school to 96 third grade students per school. In addition, the target population included new students who entered the study schools over the course of the study (i.e. students who entered study schools as 3rd graders in Spring 2005, or as 4th graders in Fall 2005 or Spring 2006, or as 5th graders in spring 2007). In spring 2005, there were a total of 6,597 3rd grade students enrolled in study schools, which included 394 new enterers (see Table 1).
Random assignment was conducted at the school level. At each research grant site, half the research schools were assigned to the treatment group (which offered the SACD intervention proposed by the investigator), and half were assigned to the control group (which offered the status quo curriculum and activities). Random assignment at the school level is necessary, because the SACD initiatives aim to change the climate of the entire school. Thus, a design where classrooms within a school were randomly assigned to a treatment or control group would generate impact estimates that are more precise, but would suffer from severe contamination bias, because many students in the control group classrooms would be exposed to the intervention.
Cohort 1 of the multisite study follows a cohort of third grade students as they progress through fifth grade. All third graders enrolled in treatment and control schools during fall 2004 were included in the study. Cohort 2 of the multisite-study follows a second cohort of third grade students in 12 schools, beginning in fall 2005, with follow-up data collection occurring in spring 2006 (3rd grade) and spring 2007 (4th grade). Table 2 displays the child and parent/caregiver consent rates for baseline (fall 2004) and spring 2005 data collection. In fall 2004, parent/caregiver consent for student participation in the study was 65%, and was 67% for the original sample in spring 2005 (Table 2). These numbers represent the
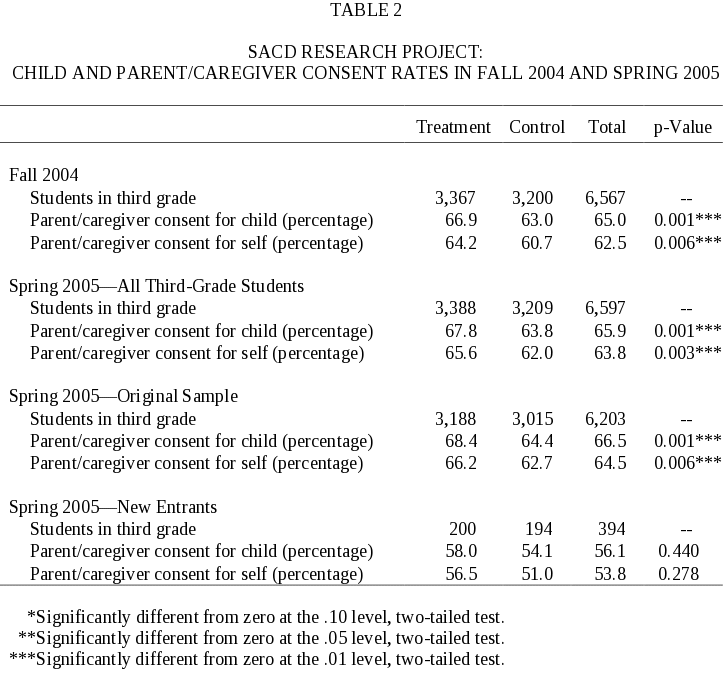
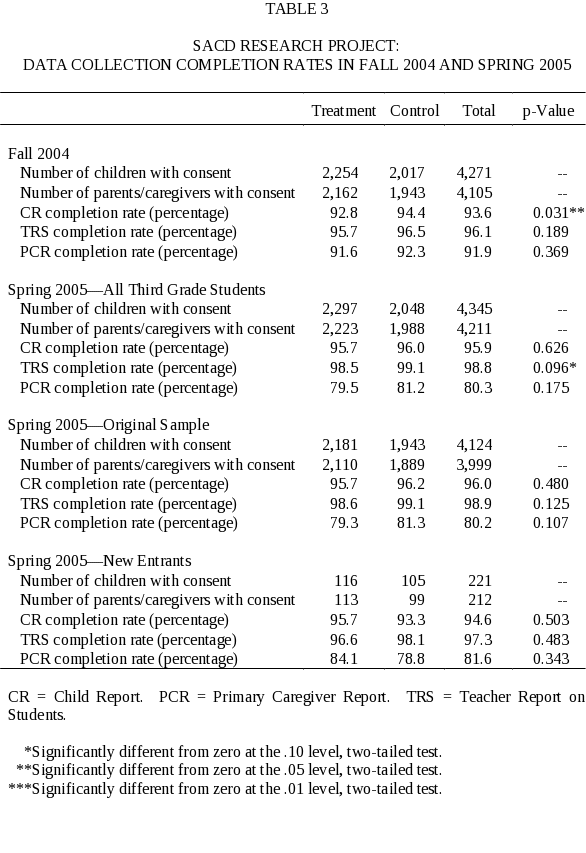
overall parent/caregiver consent rate for the multisite study, although consent rates in individual sites varied from 53% to 77%. A combined sample size across the seven grantees of 4,271 students was obtained at baseline (number of children with parental consent) and a sample size of 4,345 students (number of children with parental consent) was obtained in spring 2005 (Table 3).
2. Statistical Methods for Sample Selection and Degree of Accuracy Needed
In this section, we discuss sampling methods for the SACD study in more detail, and present power calculations for the impact estimates under the SACD study design.
a. Statistical Methodology for Stratification and Sample Selection
The sample of students for the study was selected in three stages. The first stage, which occurred through an IES and CDC grant competition, was to identify the programs that would be evaluated and the investigators who would be implementing the program and evaluation in each site. Seven grantees were selected through this grant process and began implementing seven distinct social and character development programs in the fall of 2004. The next two stages involved selecting schools and then selecting students within schools.
Selecting Schools. Grantees identified the schools for participation in the study. At each site, investigators randomly assigned between 10 and 18 schools to treatment and control groups. The schools in the research sample were selected in spring 2004 so that the treatment schools had sufficient time to implement the interventions (for example, conduct teacher training) before the start of school in fall 2004.2
Grantees used a pairwise-matching process to select the treatment and control group schools. Specifically, the sample of schools was selected by (1) pairing similar schools using data on school and community characteristics; (2) randomly selecting five to seven pairs (depending on the number of schools that were initially recruited) using stratified sampling techniques to ensure that the selected pairs are diverse in terms of their geography, community characteristics, and student populations; and (3) randomly selecting one of each pair to the treatment group and one of each pair to the control group. This matching process maximized the comparability of the treatment and control group schools on the basis of their observable characteristics. This design is preferable to a simple random sample design where the treatment and control schools would be randomly selected without pairwise stratification, because with only a small number of schools in the sample, the simple random sample design could produce a “bad draw” that yields treatment and control groups with different characteristics.
IES/CDC, MPR, and the grantees developed procedures to obtain consistent school-specific data across the sites that were used in the matching process. The team identified data items that were readily available in most school districts, that were likely to be correlated with the outcome measures, and that had face validity. Table 4 summarizes the variables used in the pairwise matching for each program site.
The grantees used a consistent matching algorithm developed by MPR for pairing the schools. In this algorithm, schools within a district were compared to the school with the most advantaged (or most disadvantaged) student body—labeled hereafter as the reference school—using observable aggregate school characteristics. A “distance” measure was then constructed between each school and the reference school. The distance measure was defined in various ways, including: (1) the sum

of squared differences between the (normalized) school characteristics of each school and the reference school; (2) the sum of absolute differences between the school characteristics of each school and the reference school (which lessens the effects of outliers); or (3) the predicted probability (propensity score) from a logit model where the binary dependent variable, set to 1 for the reference school and to 0 for the other schools, is regressed on the school measures. The distance measures were then ordered from smallest to largest, and schools were then sequentially paired. Because the choice of distance measures is somewhat arbitrary, we constructed pairs using different distance metrics to check the robustness of the matches, and consulted with program staff to select the matches that made the most sense from a face validity standpoint.
Finally, where possible grantees will replace a pair of schools if one school in a pair drops out of the study. For example, if a treatment school drops out, both the treatment school and the control school that is matched to that treatment school will be dropped from the study, and replaced by another matched pair of schools. This procedure will maintain the integrity of the random assignment design.
Selecting Students. The sample of children for the multisite evaluation consists of all third-grade students in the treatment and control schools. We anticipate that the student sample at each site will contain about 350 third-grade children in each of the five to seven treatment schools (the number of schools per site depends upon the number of schools that was initially randomized) and approximately 350 third-grade children in each of the five to seven control schools. Thus, the student sample for the multisite analysis is estimated to include 4,900 children split evenly between the treatment and control groups.
b. Estimation Procedures
The plans for the statistical analyses of the data, including descriptive statistics and multivariate models, are presented in A16.
c. Degree of Accuracy Needed
In order to assess appropriate sample sizes for the evaluation, we adopt a precision standard using impact results found in other evaluations. Several authors (for example, Cohen 1988 and Lipsey and Wilson 1993) have conducted meta-analyses across a range of fields to examine the extent to which impacts, measured in effect size units, are considered to be “meaningful.” The consensus is that effect sizes of .20 are considered to be moderate in size. Furthermore, previous evaluations of interventions targeted at improving children’s social and character development have found impacts in this range (for example, Flay et al. 2001 and Aber et al. 2003). Thus, we adopted this .20 effect size value as the standard for the SACD evaluation.3 This effect size will be calculated as a fraction of the standard deviation of the outcome measures being examined.
Table 5 displays minimum detectable impacts on a child outcome measured in effect size units (that is, as a percentage of the standard deviation of the outcome) at 80 percent power for a 95 percent one-tailed confidence interval. These calculations incorporate design effects due to clustering at the school and classroom level. On the basis of findings from previous education-related evaluations, we assume an intraclass school level of .07, and an intraclass classroom effect of .16. Other assumptions are displayed at the bottom of Table 5.
TABLE 5
MINIMUM Detectable Effect Sizes
|
Total Samplea |
Minimum Detectable Effect Size with School- and Classroom- Level Clustering |
Overall Sample |
3,780 |
.16 |
Student Subgroups |
|
|
20 percent subgroup |
840 |
.18 |
50 percent subgroup |
1,890 |
.16 |
Site (Grantee) Subgroups |
|
|
2 sites |
1,080 |
.29 |
4 sites |
2,160 |
.21 |
aThese estimates are for the basic impact analyses without including new entrants to the sample. Thus, the estimates are conservative; power will be greater if the refresher sample is included.
Note: We assumed the following for the power calculations: a one-tailed test at 80 percent power and a 5 percent significance level, an R2 value of .5, the proportion of the total variance that is between-classroom is.16, the proportion of total variance that is between-school is .07, 3 classrooms per school, 23 students per classroom in the original sample, 10 schools per grantee (5 treatment, 5 control), equal numbers of treatment and control students, and 7 grantees. Power calculations are based on an 80 percent response rate (or 18 students per classroom).
The expected follow-up interview sample sizes provide sufficient statistical power to provide a definitive assessment of the overall (global) impacts of the SACD interventions, as well as for subgroups of programs and children. For the overall design including all 7 grantees, the minimum detectable effect size (MDE) is .16 of a standard deviation, which is below our .20 precision standard.4 The MDE is about .18 of a standard deviation for a 20-percent subgroup of students (across all sites) and .16 of a standard deviation for a 50-percent student subgroup. The MDE is .21 of a standard deviation for examining impacts across a subgroup of four programs, which is near our benchmark value. However, the design is less effective for examining impacts across smaller subgroups of programs. For instance, the MDE is .29 of a standard deviation for examining subgroup effects using data from only two sites.
d. Unusual Problems Requiring Specialized Sampling Procedures
We do not anticipate any unusual problems which require specialized sampling procedures.
e. Use of Periodic Data Collection Cycles to Reduce Burden
The data collection for the study included one round of baseline interviews and assessments in fall 2004, and four rounds of follow-up interviews and assessments in spring 2005, fall 2005, spring 2006, and spring 2007. To date, three of the four follow-up rounds of data collection have been completed. Each round of data collection occurred or will occur 6 to 12 months apart. The longitudinal data will be critical for understanding the pattern of program impacts and the mechanisms through which they occur.
3. Methods to Maximize Response Rates and to Deal with Nonresponse
Attrition is an issue that must be addressed in virtually every longitudinal study whose findings are to be generalized to a larger population. Family mobility and changes in circumstances can contribute to attrition and may be expected to occur in this study as well. Initially, the SACD research program planned for local grantees to work with the national evaluation contractor to track sample children who moved away from the school but who stayed with the same school district. However, the original plan was modified. Instead, “leavers” were not tracked once they left the study schools. That is, if a third grade student was enrolled in a study school during fall 2004 but then left before spring 2005, that student was not tracked into the new school and new data from that student was not collected in spring 2005. Turnover of students from fall 2004 to spring 2005 was modest. Six percent of third graders at study schools in spring 2005 had entered those schools after fall 2004 data collection, and about 5% o those enrolled in fall 2004 had left that school by spring 2005 data collection (see Table 1 above). At the site level, overall turnover ranged from just under 4 percent to 9 percent.
High response rates will hinge, initially, on high rates of caregiver consent for each child’s participation in the study. The grantees are responsible for gaining informed consent from a primary caregiver for each sampled child. The national evaluator will consult with the grantees on specific strategies that have proven effective in boosting consent rates on similar projects. For example, invitations to participate in the research will be printed on colored paper and sent home by the schools or mailed in colored envelopes so they do not get lost in backpacks or in stacks of mail. School and grantee staff will be given primary responsibility for collecting the consent forms, and will be asked to keep track of the forms as they are returned and to send out reminder slips provided by the grantees. Finally, each grantee will provide caregivers with a local telephone number to call if they have any questions about the study.
In terms of the self-administered surveys to be completed by the primary caregivers, experience from similar projects, as well as the experience of the grantees, indicates that response is highest when teachers are involved in the process. The grantees will be responsible for distributing the caregiver reports to teachers, who will then distribute them to the children in their classrooms to take them home to their parents or guardians. The national evaluator will conduct follow-up CATI interviews using its phone staff to reach nonrespondents. Interviewers will be trained to establish rapport with these respondents and remind them of the confidentiality of their responses.
The analysis plan will address nonresponse through supplemental tabulations and regression analyses that examine nonresponse patterns for each instrument to assess bias. The availability of multiple instruments and multiple waves of data make it highly likely that we will have some descriptive information to use for comparing nonrespondents with respondents. All such analyses will be carried out separately for treatment and control group members. In particular, the national evaluator will report sample attrition rates by treatment status for each site and use this information to diagnose and fix any deviations likely to affect the impact estimates.
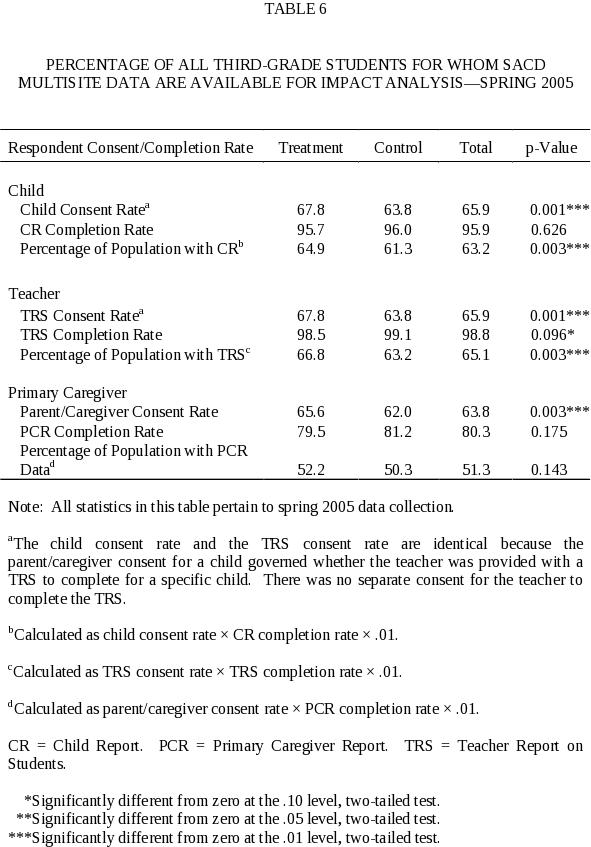
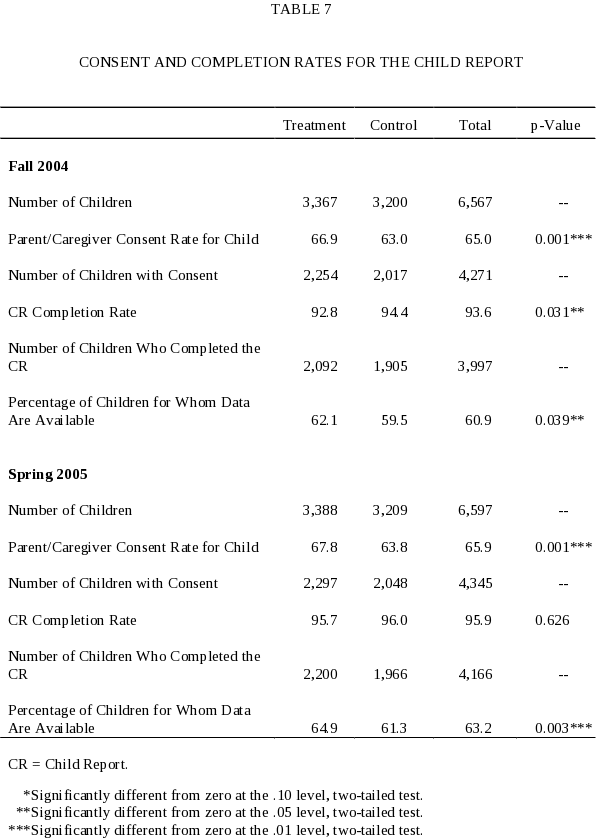
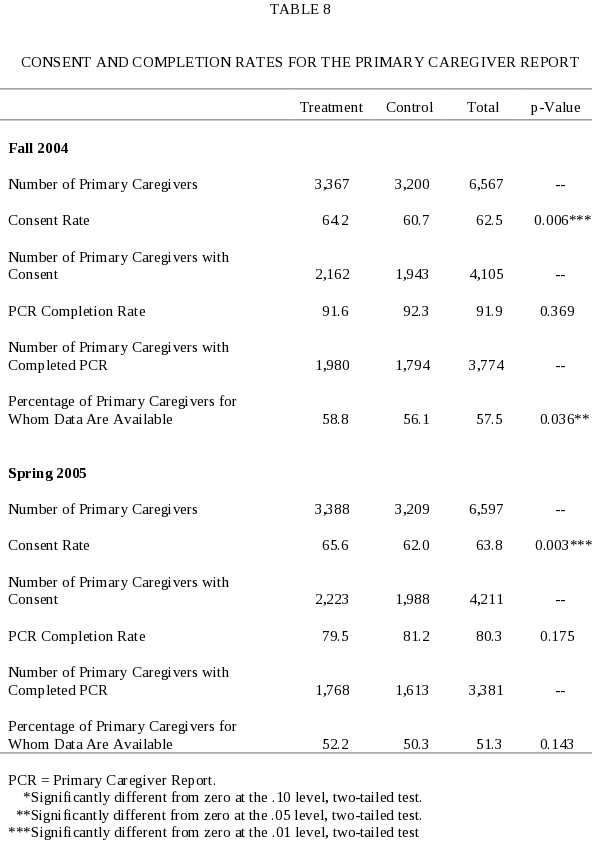
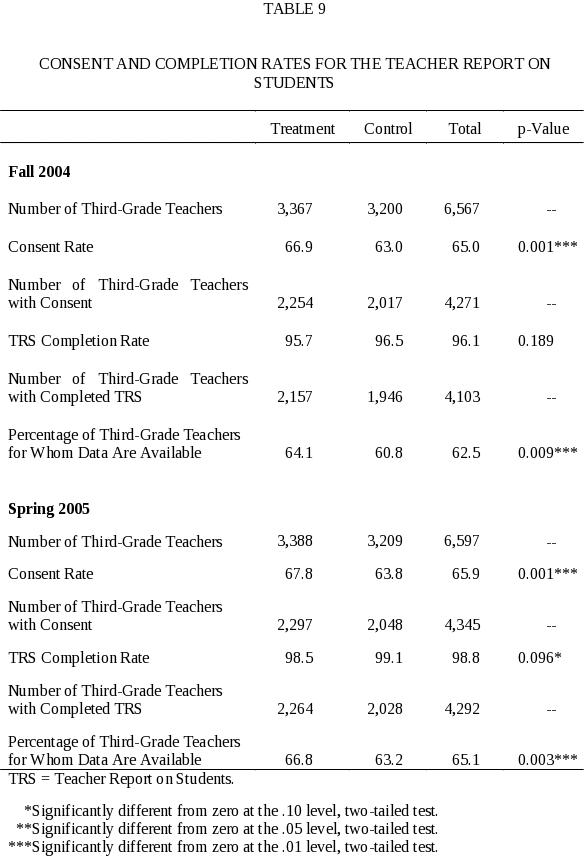
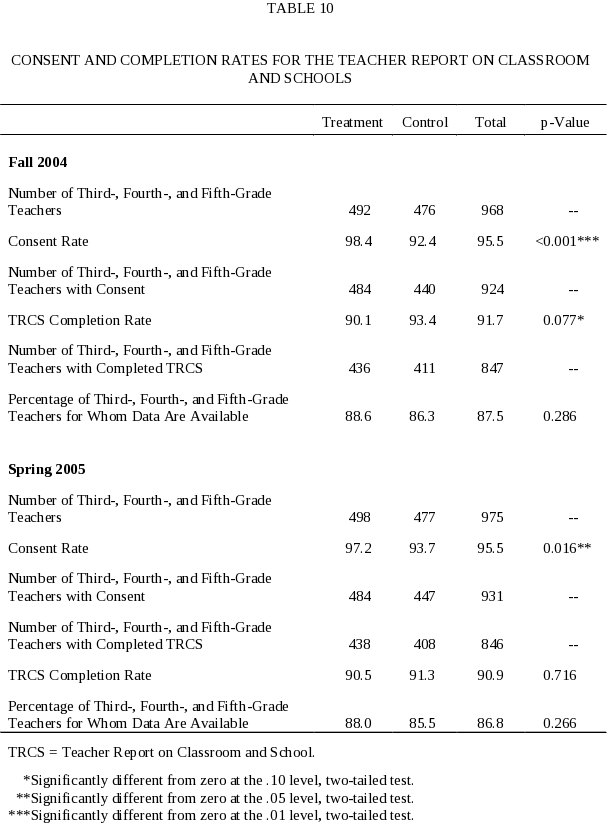
Tables 6 through 10 show consent and completion rates among consenters for each instrument (Child Report, Primary Caregiver Report, Teacher Report on Students, and Teacher Report on Classroom and School) used during fall 2004 and spring 2005 data collection. Consent and completion rates ranged across sites and by respondents. For example, the CR and TRS were completed for large percentages of children whose caregivers had given consent, about 96 to 99 percent, respectively. Site-level completion rates varied somewhat for the CR, but the lowest site-level completion rates was 92 percent. For the TRS, the lowest was 97 percent. Across all programs, a PCR was completed in spring 2005 for 80 percent of the children whose parents/caregivers consented to participate in the study; Spring 2005 PCR completion rates varied from 75 percent to 84 percent across programs.
If unit nonresponse appears to be a problem, the national evaluator can construct post-stratification weights using propensity score matching. This procedure estimates the likelihood of each sample member being a nonrespondent based on readily available information (for example, baseline characteristics) and divides the sample according to the predicted response probabilities (propensity scores). Weights for each actual respondent will then be computed based on the number of nonrespondents with similar propensity scores. In this way, the small number of respondents who are similar to nonrespondents will be standing in for their absent counterparts.
If nonresponse for any item is over 10 percent, multiple imputation procedures will be employed. Otherwise the value of that item will be set to a special missing value code. Analysis of nonresponse will also feed back into the data collection operations by identifying critical areas and
suggesting solutions, such as aggressively pursuing a subsample of students who have moved out of the area.
4. Tests of Procedures and Methods to Be Undertaken
During December 2003, MPR staff conducted pretests of the Child Report, Primary Caregiver Reports, and Teacher Report Part I – Child Assessments. The pretests were used to test the sequence and flow of the questionnaires, identify problems with wording, and estimate the time required to complete the questionnaires for purposes of estimating respondent burden. Participants in the child and caregiver pretests were selected in a manner that would reflect the socioeconomic diversity of individuals we anticipated would be responding to the questionnaires in the full study. Teachers who participated in the pretest of the Teacher Report Part I during December 2003 were asked to fill out one report for a “compliant” child and one for a “difficult” child. MPR produced a revised draft instrument incorporating lessons from the pretest and submitted a revised draft of the OMB supporting statement and instruments in mid-December 2003.
IES published a 60-day notice in the Federal Register on December 23, 2003 to solicit public comment on the SACD study. The Primary Caregiver Report was revised to incorporate suggestions offered by one commenter, who suggested that the primary caregiver questionnaire should solicit information about community resources. In addition, IES/CDC specified the content of the SACD-Activities Observation Form, the SACD-Activities Teacher Report, and the SACD-Activities Principal Interview, from which MPR developed the instruments that were submitted to OMB for approval of the data collection with the supporting statement dated February 20, 2004.
After OMB submission and before the pilot test, a decision was made to combine the School Staff report and SACD-Activities Teacher Survey into a single questionnaire and to administer this revised questionnaire to all third-, fourth-, and fifth-grade teachers at each data collection point. Although this change increased the burden on teachers of the sample class, the revised design provides a cross-sectional measure of school climate and use of SACD activities in the classroom at each measurement point. By administering the questionnaire to all third-, fourth-, and fifth‑grade teachers at each observation point, it is possible to examine the trajectory of the school climate and SACD activity measures over time (as reflected in the attitudes and activities of the third- through fifth-grade teachers), and if treatment-control differences are observed, to attribute these differences to the effects of the interventions. This analytic gain was deemed sufficiently important to warrant the modest increase in burden for teachers of sample children created by asking these teachers to complete both the Teacher Report on Classroom and School and the Teacher Report on Students.
After OMB approval of data collection at the end of April 2004, all questionnaires and data collection procedures were pilot tested in a second phase of instrument development. Six schools participated in the pilot test: three located in or near Trenton, New Jersey and three located in or near Houston, Texas. In the first part of the section, we describe the pilot test of the instruments designed to collect data about individual children: the Child Report, the Primary Caregiver Report, and the Teacher Report on students. In the second part, we describe the pilot test of the instruments designed to collect data about schools and teachers or class groups within schools.
Pilot Test of Child Level Instrument
All second- and third-grade students at two schools in the Trenton, New Jersey area and their teachers and parents were asked to participate in the pilot-test of child instruments. We selected second-grade students because we thought they would be most similar developmentally to the third graders who would be completing the instrument in fall 2004. We selected third graders because we thought they would be developmentally similar to the third graders who would be completing the instrument in spring 2005. A total of 307 students were enrolled in 18 second- and third-grade classes at the two schools. A total of 211 parents gave consent for their child to participate in the study. A total of 201 students were present on the day of data collection and gave their assent to participate. We received a Primary Caregiver Report for 170 of the children for whom consent was granted—118 self-administered and 52 conducted by telephone. We received 186 completed Teacher Reports on Students completed by 18 different teachers in the two schools. Senior data collection staff conducted debriefing with most students who completed the Child Report, with 13 second- and third-grade teachers who completed at least one Teacher Report on Students, and with 20 primary caregivers (11 of whom completed the self-administered form and 9 of who completed the interview by telephone).
The pilot test field experience and analysis of the pilot test data confirmed that the basic structure of the data collection was sound, and also showed that most measures exhibited reliability comparable to that reported in other studies. However, the pilot test led to some refinements of the child-level data collection instruments that were implemented for the baseline data collection for the full study in fall 2004.
Pilot Test of School and Classroom Level Instruments
The SACD Multisite Evaluation collects data about schools participating in the SACD research project and classrooms within those schools from three sources:
The Principal Interview is conducted in-person with the principal and other key staff responsible for social and character development activities within the school. It gathers data on all programs and activities in the school related to social and character development and to behavior management, on school decision-making related to social and character development, and on the principal’s perceptions about faculty support for social and character development related programs in the school.
The Teacher Report on Classroom and School is a self-administered questionnaire completed by all third-, fourth-, and fifth-grade teachers at each data collection point. It gathers data on the background and experience of each teacher, on activities or programs the teacher has used with his or her class that address specific SACD related goals and behavior management, on school climate, and on professional development related to SACD.
The SACD Observation Form is completed by a member of the data collection team at the time of the school visit to administer the child report. It is used to record all objects that reveal attention to social and character development. All classrooms attended by the students in the study sample and one classroom in each grade not attended by the study sample, plus all common spaces within the school, are observed, and objects are recorded.
These instruments designed to collect classroom- and school-level data were pilot tested in three schools in the Trenton, New Jersey area and three schools in the Houston, Texas area.
Revisions to the components of SACD Multisite Data Collection that were focused specifically on SACD Activities were more extensive than the revisions to the child level instruments described in the previous section. The pilot test revealed several problems with the SACD Activities Observation Form and the Principal Interview.
The SACD Activities Observation Form proved difficult to use for the following reasons:
Formats of the forms for different types of space within the school were slightly different.
Row headings on which descriptions were to be recorded mixed type of object (bulletin board, poster) and content of the object, and some row head categories were similar to each other.
Many row categories were seldom if ever used; others occurred more frequently, and space was inadequate to describe the more frequently observed types of items.
Problems with the Principal Interview included:
Introduction was long and difficult for respondents to follow.
Respondents had difficulty distinguishing between formal programs (covered in Section B) and informal programs (covered in Section C).
The list of specific types of programs/activities asked about was long and sometimes repetitious.
In light of these problems encountered in the pilot test, MPR staff modified both forms during the pilot test, and tested modified versions of each form in later pilot test schools.5
Based on the pilot test experience, MPR made recommendations for changes in structure and content of these instruments to the SACD-Activities workgroup that was responsible for developing the instruments to measure SACD activities. The SACD-Activities Workgroup members and MPR staff held five conference calls during June and early July 2004 in which decisions were reached on the structure and content of the SACD Activities instruments. Below, we briefly describe the key features of the revised instruments produced in this process.
Other Changes to the Teacher Report on Classroom and School.
In addition to the changes outlined above pertaining to the SACD Activities components of the three teacher- and school-level instruments, the pilot test lead to some change in the Feelings of Safety Scale which is included in Section C of the Teacher Report on Classroom and School. In particular, changes were made to this scale to conform it to the scale in the Teacher Report on Classroom and School to the similar scale in the Child Report and the Teacher Report on Students.
5. Individuals Consulted on Statistical Aspects of the Design
All instruments and procedures were reviewed extensively by the Institute of Education Sciences, the National Center for Injury Prevention and Control, and the members of the Social and Character Development research program consortium. The following individuals have worked closely in developing the instruments, data collection procedures that will be used, and will be responsible for data analysis.
Name, Degree |
Title |
Telephone |
Elizabeth Albro, Ph.D. |
IES Research Associate |
202-219-2148 |
John Burghardt, Ph.D. |
MPR Senior Fellow |
609-275-2395 |
Susanne James-Burdumy, Ph.D. |
MPR Senior Economist |
609-275-2248 |
Laura Kalb, B.A. |
MPR Senior Survey Researcher |
609-936-2774 |
Joanne Klevens, M.D., Ph.D. |
NCIPC Medical Epidemiologist |
770-488-1386 |
Lynn Okagaki, Ph.D. |
Commissioner National Center for Education Research |
202-219-2006 |
Le’Roy Reese, Ph.D. |
NCIPC Team Lead, Evaluation and Effectiveness Research Team |
770-488-4334 |
Peter Schochet, Ph.D. |
MPR Senior Fellow |
609-936-2783 |
Amy Silverman, Ph.D. |
IES Research Associate |
202-219-1201 |
Ed Metz, Ph.D. Larry Snell, B.S. |
IES Research Associate MPR Senior Survey Researcher |
202-208-1983 609-750-3195 |
Jennifer Wyatt, Ph.D. |
NCIPC Associate Service Fellow |
770-488-4058 |
1Each of the grantees is conducting analysis of their own data collected from their individual sites; the multisite study will be conducting pooled analyses of core evaluation data collected from all seven grantees detailed in this collection.
2To the extent practical, the random assignment of schools occurred as late as possible to minimize the number of families who, in response to knowing which schools are in the treatment group, relocated so that their children could attend the treatment (or control) schools. If relocation rates into or out of the areas covered by treatment schools are high during the summer of 2004, then the comparability of the students in the treatment and control group schools could be jeopardized. We do not anticipate that this will be a serious problem, but we will track student mobility within the school districts included in the study.
3Another approach is to adopt a precision standard to detect impacts such that program benefits would offset program costs. However, this is not possible for the SACD study, because it will be very difficult to assign a dollar value to some benefits of the program (for example, gains in children’s positive behavior).
4In the absence of clustering at the classroom effect, the minimum detectable effect size falls to .12 of a standard deviation.
5 A discussion of the pilot test experience and the modifications made during the pretest is presented in Kalb et al. (2005), Chapter III.
| File Type | application/msword |
| File Title | Contract No |
| Author | Gloria Gustus |
| Last Modified By | DoED |
| File Modified | 2006-12-20 |
| File Created | 2006-12-20 |
© 2026 OMB.report | Privacy Policy