SBIC Management Assessment Questionnaire & License Application; Exhibits to SBIC License App./Mgmt. Assessement Questionnaire
SBIC Management Assessment Questionnaire & License Application; Exhibits to SBIC License App./Mgmt. Assessment Questionnaire
3245-0062 F4-Template.xls
SBIC Management Assessment Questionnaire & License Application; Exhibits to SBIC License App./Mgmt. Assessement Questionnaire
OMB: 3245-0062
⚠️ Notice: This form may be outdated. More recent filings and information on OMB 3245-0062 can be found here:
Document [xlsx]
Download: xlsx | pdf
Table 4.1
Table 4.2 (a)
Table 4.2 (b)
Table 4.2 (c)
Table 4.2 (d)
Table 4.2 (e)
Table 4.3
Table 4.3 (a)
Table 4.4 (a)
Table 4.4 (b)
Table 4.4 (c)
Table 4.4 (d)
Table 4.4 (e)
File Name Help






Overview
InstructionsTable 4.1
Table 4.2 (a)
Table 4.2 (b)
Table 4.2 (c)
Table 4.2 (d)
Table 4.2 (e)
Table 4.3
Table 4.3 (a)
Table 4.4 (a)
Table 4.4 (b)
Table 4.4 (c)
Table 4.4 (d)
Table 4.4 (e)
File Name Help
Sheet 1: Instructions
| Exhibit 4: Synthesized Fund Workbook Instructions | ||||
| V1.1.b - May 24, 2006 | ||||
| General Instructions: | ||||
| You will have one Excel workbook (file) for each Complete fund you are presenting. | ||||
| Save the name of this file as "F4-" + 10 character (or less) acronym that identifies your applicant name + "; Syn" + year of first investment + "; " + the first and last name initials for each principal for which this workbook pertains separated by commas + "; " +date when this report was prepared in YYYYMMDD format. | ||||
| For assistance in creating the correct file name, click on the link to the right. | File Name Help | |||
| Example: | ||||
| Applicant Name: Southern Ventures Fund | ||||
| Principal Name: John Browning, Mary Jones | ||||
| Year of First Investment: 1995 | ||||
| Date Report Prepared: September 30, 2003 | ||||
| File Name for Workbook: F4-SouthernVF; Syn1995; JB,MJ; 20030930 |
||||
| Follow the step by step instructions below, referring to Exhibit F for detailed instructions on each table. | ||||
| Click on tables to go to associated worksheets. | ||||
| Instruction | Worksheet | |||
| 1. Enter General Information on Investment Group | Table F4.1 | |||
| 2. Enter Portfolio Information | ||||
| a. Enter List of Portfolio Companies | Table F4.2 ( a ) | |||
| b. Enter Portfolio Financing Information | Table F4.2 ( b ) | |||
| c. Enter Portfolio Company Realized Events | Table F4.2 ( c ) | |||
| d. Current Status and Unrealized Portfolio Company Information | Table F4.2 ( d ) | |||
| e. Describe Your Involvement with Company | Table F4.2 ( e ) | |||
| 3. Enter Fund Cashflow Information | Table F4.3 | |||
| 4. Review Fund Statistics | ||||
| a. Review Portfolio Summary | Table F4.4 ( a ) | |||
| b. Review Financing Statistics | Table F4.4 ( b ) | |||
| c. Review Investment Performance Statistics | Table F4.4 ( c ) | |||
| d. Review Graphics | Table F4.4 ( d ) | |||
| e. Review Fund Statistics | Table F4.4 ( e) | |||
Sheet 2: Table 4.1
| i | Next Step | ||||||||||||||||||
| Table F4.1 General Fund Information | |||||||||||||||||||
| 1. SBIC Applicant: |
|
||||||||||||||||||
| 2. Principal: |
|
||||||||||||||||||
| 3. Investment Group Name | SYN1899 | ||||||||||||||||||
| 4. Starting Date for Investment Group (MM/DD/YYYY format) |
|
12 | 1899 | ||||||||||||||||
| 5. Last Date of Investment Period (No new investments should be taken down after this date.) | 12/30/1904 | ||||||||||||||||||
| 6. Number of Portfolio Companies |
|
||||||||||||||||||
| 7. Is there any unrealized value left in the investments made in this group? |
|
||||||||||||||||||
| Note: If you would like to include unrealized value in the investments as part of your IRR calculation, enter "Y". If you enter "Y", you | |||||||||||||||||||
| must continue to maintain some level of management fees, similar to those proposed in your business plan. | |||||||||||||||||||
| 8. If there is no unrealized value left in the investments (previous answer is "N"), when (mm/yyyy) was the last exit or write-off? |
|
1899 | |||||||||||||||||
| Note: Management expenses should continue until the month/year identified above, unless your business plan proposes otherwise. | |||||||||||||||||||
| 9. Enter the date of the last exit OR the "as of" date for which the fund information will be reported, if the fund is ongoing. |
|
1899 | |||||||||||||||||
| 10. Very short narrative on investment strategy of investment group, including lifecycle stages of investments and industry sectors | |||||||||||||||||||
|
|
|||||||||||||||||||
| 11. Footnotes | |||||||||||||||||||
|
|
|||||||||||||||||||
| Next Step | |||||||||||||||||||
Sheet 3: Table 4.2 (a)
| i | #N/A | Next Step | ||||||
| Table F4.2 (a) Portfolio Company Data | ||||||||
| SBIC Applicant/Principal: ; | ||||||||
| Number of Portfolio Companies: | ||||||||
| List each portfolio company only once, regardless of the number of rounds of financing. | ||||||||
|
|
||||||||
|
|
|
|
|
|
|
|
||
| 1 | ||||||||
| N/A | ||||||||
| N/A | ||||||||
| N/A | ||||||||
| N/A | ||||||||
| N/A | ||||||||
| N/A | ||||||||
| N/A | ||||||||
| N/A | ||||||||
| N/A | ||||||||
| N/A | ||||||||
| N/A | ||||||||
| N/A | ||||||||
| N/A | ||||||||
| N/A | ||||||||
| N/A | ||||||||
| N/A | ||||||||
| N/A | ||||||||
| N/A | ||||||||
| N/A | ||||||||
| N/A | ||||||||
| N/A | ||||||||
| N/A | ||||||||
| N/A | ||||||||
| N/A | ||||||||
| N/A | ||||||||
| N/A | ||||||||
| N/A | ||||||||
| N/A | ||||||||
| N/A | ||||||||
| N/A | ||||||||
| N/A | ||||||||
| N/A | ||||||||
| N/A | ||||||||
| N/A | ||||||||
| N/A | ||||||||
| N/A | ||||||||
| N/A | ||||||||
| N/A | ||||||||
| N/A | ||||||||
| N/A | ||||||||
| N/A | ||||||||
| N/A | ||||||||
| N/A | ||||||||
| N/A | ||||||||
| N/A | ||||||||
| N/A | ||||||||
| N/A | ||||||||
| N/A | ||||||||
| N/A | ||||||||
| N/A | ||||||||
| N/A | ||||||||
| N/A | ||||||||
| N/A | ||||||||
| N/A | ||||||||
| N/A | ||||||||
| N/A | ||||||||
| N/A | ||||||||
| N/A | ||||||||
| N/A | ||||||||
| N/A | ||||||||
| N/A | ||||||||
| N/A | ||||||||
| N/A | ||||||||
| N/A | ||||||||
| N/A | ||||||||
| N/A | ||||||||
| N/A | ||||||||
| N/A | ||||||||
| N/A | ||||||||
| N/A | ||||||||
| N/A | ||||||||
| N/A | ||||||||
| N/A | ||||||||
| N/A | ||||||||
| N/A | ||||||||
| N/A | ||||||||
| N/A | ||||||||
| N/A | ||||||||
| N/A | ||||||||
| N/A | ||||||||
| N/A | ||||||||
| N/A | ||||||||
| N/A | ||||||||
| N/A | ||||||||
| N/A | ||||||||
| N/A | ||||||||
| N/A | ||||||||
| N/A | ||||||||
| N/A | ||||||||
| N/A | ||||||||
| N/A | ||||||||
| N/A | ||||||||
| N/A | ||||||||
| N/A | ||||||||
| N/A | ||||||||
| N/A | ||||||||
| N/A | ||||||||
| N/A | ||||||||
| N/A | ||||||||
| N/A | ||||||||
| N/A | ||||||||
| N/A | ||||||||
| N/A | ||||||||
| N/A | ||||||||
| N/A | ||||||||
| N/A | ||||||||
| N/A | ||||||||
| N/A | ||||||||
| N/A | ||||||||
| N/A | ||||||||
| N/A | ||||||||
| N/A | ||||||||
| N/A | ||||||||
| N/A | ||||||||
| N/A | ||||||||
| N/A | ||||||||
| N/A | ||||||||
| N/A | ||||||||
| N/A | ||||||||
| N/A | ||||||||
| N/A | ||||||||
| N/A | ||||||||
| N/A | ||||||||
| N/A | ||||||||
| N/A | ||||||||
| N/A | ||||||||
| N/A | ||||||||
| N/A | ||||||||
| N/A | ||||||||
| N/A | ||||||||
| N/A | ||||||||
| N/A | ||||||||
| N/A | ||||||||
| N/A | ||||||||
| N/A | ||||||||
| N/A | ||||||||
| N/A | ||||||||
| N/A | ||||||||
| N/A | ||||||||
| N/A | ||||||||
| N/A | ||||||||
| N/A | ||||||||
Sheet 4: Table 4.2 (b)
| i | #N/A | Next Step | |||||||||
| Table F4.2 (b) Portfolio Company Financing Rounds | |||||||||||
| SBIC Applicant/Principal: ; | |||||||||||
| Create a separate line for each round of financing. For example, if you had 3 rounds of financing, you will have 3 lines for a single portfolio company. | |||||||||||
| You must use the same company names as those in Table F4.2. | Total Financing | $- | |||||||||
|
|
|
|
|
|
|
|
|
|
|
||
Sheet 5: Table 4.2 (c)
| i | #N/A | Next Step | |||||||||
| Table F4.2 (c) Portfolio Company Realized Events | |||||||||||
| SBIC Applicant/Principal: / | |||||||||||
| Create a separate line for each realized event. For example, if you sold your shares in a company in 2 traunches, you will have two lines for that company. | |||||||||||
| Enter a separate line item for each exit/liquidation. If you had 3 separate liquidations (at separate times) of a company, then you will have 3 line items. You must use the same company names as those in Table F4.2. | |||||||||||
| Totals | $- | $- | $- | $- | |||||||
|
|
of Exit |
|
|
|
|
|
|
|
Total Proceeds | ||
| $- | |||||||||||
| $- | |||||||||||
| $- | |||||||||||
| $- | |||||||||||
| $- | |||||||||||
| $- | |||||||||||
| $- | |||||||||||
| $- | |||||||||||
| $- | |||||||||||
| $- | |||||||||||
| $- | |||||||||||
| $- | |||||||||||
| $- | |||||||||||
| $- | |||||||||||
| $- | |||||||||||
| $- | |||||||||||
| $- | |||||||||||
| $- | |||||||||||
| $- | |||||||||||
| $- | |||||||||||
| $- | |||||||||||
| $- | |||||||||||
| $- | |||||||||||
| $- | |||||||||||
| $- | |||||||||||
| $- | |||||||||||
| $- | |||||||||||
| $- | |||||||||||
| $- | |||||||||||
| $- | |||||||||||
| $- | |||||||||||
| $- | |||||||||||
| $- | |||||||||||
| $- | |||||||||||
| $- | |||||||||||
| $- | |||||||||||
| $- | |||||||||||
| $- | |||||||||||
| $- | |||||||||||
| $- | |||||||||||
| $- | |||||||||||
| $- | |||||||||||
| $- | |||||||||||
| $- | |||||||||||
| $- | |||||||||||
| $- | |||||||||||
| $- | |||||||||||
| $- | |||||||||||
| $- | |||||||||||
| $- | |||||||||||
| $- | |||||||||||
| $- | |||||||||||
| $- | |||||||||||
| $- | |||||||||||
| $- | |||||||||||
| $- | |||||||||||
| $- | |||||||||||
| $- | |||||||||||
| $- | |||||||||||
| $- | |||||||||||
| $- | |||||||||||
| $- | |||||||||||
| $- | |||||||||||
| $- | |||||||||||
| $- | |||||||||||
| $- | |||||||||||
| $- | |||||||||||
| $- | |||||||||||
| $- | |||||||||||
| $- | |||||||||||
| $- | |||||||||||
| $- | |||||||||||
| $- | |||||||||||
| $- | |||||||||||
| $- | |||||||||||
| $- | |||||||||||
| $- | |||||||||||
| $- | |||||||||||
| $- | |||||||||||
| $- | |||||||||||
| $- | |||||||||||
| $- | |||||||||||
| $- | |||||||||||
| $- | |||||||||||
| $- | |||||||||||
| $- | |||||||||||
| $- | |||||||||||
| $- | |||||||||||
| $- | |||||||||||
| $- | |||||||||||
| $- | |||||||||||
| $- | |||||||||||
| $- | |||||||||||
| $- | |||||||||||
| $- | |||||||||||
| $- | |||||||||||
| $- | |||||||||||
| $- | |||||||||||
| $- | |||||||||||
| $- | |||||||||||
| $- | |||||||||||
| $- | |||||||||||
| $- | |||||||||||
| $- | |||||||||||
| $- | |||||||||||
| $- | |||||||||||
| $- | |||||||||||
| $- | |||||||||||
| $- | |||||||||||
| $- | |||||||||||
| $- | |||||||||||
| $- | |||||||||||
| $- | |||||||||||
| $- | |||||||||||
| $- | |||||||||||
| $- | |||||||||||
| $- | |||||||||||
| $- | |||||||||||
| $- | |||||||||||
| $- | |||||||||||
| $- | |||||||||||
| $- | |||||||||||
| $- | |||||||||||
| $- | |||||||||||
| $- | |||||||||||
| $- | |||||||||||
| $- | |||||||||||
| $- | |||||||||||
| $- | |||||||||||
| $- | |||||||||||
| $- | |||||||||||
| $- | |||||||||||
| $- | |||||||||||
| $- | |||||||||||
| $- | |||||||||||
| $- | |||||||||||
| $- | |||||||||||
| $- | |||||||||||
| $- | |||||||||||
| $- | |||||||||||
| $- | |||||||||||
| $- | |||||||||||
| $- | |||||||||||
| $- | |||||||||||
| $- | |||||||||||
| $- | |||||||||||
| $- | |||||||||||
| $- | |||||||||||
| $- | |||||||||||
| $- | |||||||||||
| $- | |||||||||||
| $- | |||||||||||
| $- | |||||||||||
| $- | |||||||||||
| $- | |||||||||||
| $- | |||||||||||
| $- | |||||||||||
| $- | |||||||||||
| $- | |||||||||||
| $- | |||||||||||
| $- | |||||||||||
| $- | |||||||||||
| $- | |||||||||||
| $- | |||||||||||
| $- | |||||||||||
| $- | |||||||||||
| $- | |||||||||||
| $- | |||||||||||
| $- | |||||||||||
| $- | |||||||||||
| $- | |||||||||||
| $- | |||||||||||
| $- | |||||||||||
| $- | |||||||||||
| $- | |||||||||||
| $- | |||||||||||
| $- | |||||||||||
| $- | |||||||||||
| $- | |||||||||||
| $- | |||||||||||
| $- | |||||||||||
| $- | |||||||||||
| $- | |||||||||||
| $- | |||||||||||
| $- | |||||||||||
| $- | |||||||||||
| $- | |||||||||||
| $- | |||||||||||
| $- | |||||||||||
| $- | |||||||||||
| $- | |||||||||||
| $- | |||||||||||
| $- | |||||||||||
| $- | |||||||||||
| $- | |||||||||||
| $- | |||||||||||
| $- | |||||||||||
| $- | |||||||||||
| $- | |||||||||||
| $- | |||||||||||
Sheet 6: Table 4.2 (d)
| i | #N/A | Next Step | Next Step | ||||||||||||||||||||
| Table F4.2 (d) Current Status and Unrealized Portfolio Company Information | |||||||||||||||||||||||
| SBIC Applicant/Principal: ; | |||||||||||||||||||||||
| Number of Portfolio Companies: | |||||||||||||||||||||||
| Enter data for each of the companies you listed in Table 4.2 (a) | |||||||||||||||||||||||
| Status of Company |
Information |
|
|
||||||||||||||||||||
| Total | $- | Total | $- | $- | Total | $- | |||||||||||||||||
|
|
|
|
|
|
|
|
|
|
|
|
|
|
|
|
|
|
|
|
|||||
| 1 | 0 | ||||||||||||||||||||||
| N/A | 0 | ||||||||||||||||||||||
| N/A | 0 | ||||||||||||||||||||||
| N/A | 0 | ||||||||||||||||||||||
| N/A | 0 | ||||||||||||||||||||||
| N/A | 0 | ||||||||||||||||||||||
| N/A | 0 | ||||||||||||||||||||||
| N/A | 0 | ||||||||||||||||||||||
| N/A | 0 | ||||||||||||||||||||||
| N/A | 0 | ||||||||||||||||||||||
| N/A | 0 | ||||||||||||||||||||||
| N/A | 0 | ||||||||||||||||||||||
| N/A | 0 | ||||||||||||||||||||||
| N/A | 0 | ||||||||||||||||||||||
| N/A | 0 | ||||||||||||||||||||||
| N/A | 0 | ||||||||||||||||||||||
| N/A | 0 | ||||||||||||||||||||||
| N/A | 0 | ||||||||||||||||||||||
| N/A | 0 | ||||||||||||||||||||||
| N/A | 0 | ||||||||||||||||||||||
| N/A | 0 | ||||||||||||||||||||||
| N/A | 0 | ||||||||||||||||||||||
| N/A | 0 | ||||||||||||||||||||||
| N/A | 0 | ||||||||||||||||||||||
| N/A | 0 | ||||||||||||||||||||||
| N/A | 0 | ||||||||||||||||||||||
| N/A | 0 | ||||||||||||||||||||||
| N/A | 0 | ||||||||||||||||||||||
| N/A | 0 | ||||||||||||||||||||||
| N/A | 0 | ||||||||||||||||||||||
| N/A | 0 | ||||||||||||||||||||||
| N/A | 0 | ||||||||||||||||||||||
| N/A | 0 | ||||||||||||||||||||||
| N/A | 0 | ||||||||||||||||||||||
| N/A | 0 | ||||||||||||||||||||||
| N/A | 0 | ||||||||||||||||||||||
| N/A | 0 | ||||||||||||||||||||||
| N/A | 0 | ||||||||||||||||||||||
| N/A | 0 | ||||||||||||||||||||||
| N/A | 0 | ||||||||||||||||||||||
| N/A | 0 | ||||||||||||||||||||||
| N/A | 0 | ||||||||||||||||||||||
| N/A | 0 | ||||||||||||||||||||||
| N/A | 0 | ||||||||||||||||||||||
| N/A | 0 | ||||||||||||||||||||||
| N/A | 0 | ||||||||||||||||||||||
| N/A | 0 | ||||||||||||||||||||||
| N/A | 0 | ||||||||||||||||||||||
| N/A | 0 | ||||||||||||||||||||||
| N/A | 0 | ||||||||||||||||||||||
| N/A | 0 | ||||||||||||||||||||||
| N/A | 0 | ||||||||||||||||||||||
| N/A | 0 | ||||||||||||||||||||||
| N/A | 0 | ||||||||||||||||||||||
| N/A | 0 | ||||||||||||||||||||||
| N/A | 0 | ||||||||||||||||||||||
| N/A | 0 | ||||||||||||||||||||||
| N/A | 0 | ||||||||||||||||||||||
| N/A | 0 | ||||||||||||||||||||||
| N/A | 0 | ||||||||||||||||||||||
| N/A | 0 | ||||||||||||||||||||||
| N/A | 0 | ||||||||||||||||||||||
| N/A | 0 | ||||||||||||||||||||||
| N/A | 0 | ||||||||||||||||||||||
| N/A | 0 | ||||||||||||||||||||||
| N/A | 0 | ||||||||||||||||||||||
| N/A | 0 | ||||||||||||||||||||||
| N/A | 0 | ||||||||||||||||||||||
| N/A | 0 | ||||||||||||||||||||||
| N/A | 0 | ||||||||||||||||||||||
| N/A | 0 | ||||||||||||||||||||||
| N/A | 0 | ||||||||||||||||||||||
| N/A | 0 | ||||||||||||||||||||||
| N/A | 0 | ||||||||||||||||||||||
| N/A | 0 | ||||||||||||||||||||||
| N/A | 0 | ||||||||||||||||||||||
| N/A | 0 | ||||||||||||||||||||||
| N/A | 0 | ||||||||||||||||||||||
| N/A | 0 | ||||||||||||||||||||||
| N/A | 0 | ||||||||||||||||||||||
| N/A | 0 | ||||||||||||||||||||||
| N/A | 0 | ||||||||||||||||||||||
| N/A | 0 | ||||||||||||||||||||||
| N/A | 0 | ||||||||||||||||||||||
| N/A | 0 | ||||||||||||||||||||||
| N/A | 0 | ||||||||||||||||||||||
| N/A | 0 | ||||||||||||||||||||||
| N/A | 0 | ||||||||||||||||||||||
| N/A | 0 | ||||||||||||||||||||||
| N/A | 0 | ||||||||||||||||||||||
| N/A | 0 | ||||||||||||||||||||||
| N/A | 0 | ||||||||||||||||||||||
| N/A | 0 | ||||||||||||||||||||||
| N/A | 0 | ||||||||||||||||||||||
| N/A | 0 | ||||||||||||||||||||||
| N/A | 0 | ||||||||||||||||||||||
| N/A | 0 | ||||||||||||||||||||||
| N/A | 0 | ||||||||||||||||||||||
| N/A | 0 | ||||||||||||||||||||||
| N/A | 0 | ||||||||||||||||||||||
| N/A | 0 | ||||||||||||||||||||||
| N/A | 0 | ||||||||||||||||||||||
| N/A | 0 | ||||||||||||||||||||||
| N/A | 0 | ||||||||||||||||||||||
| N/A | 0 | ||||||||||||||||||||||
| N/A | 0 | ||||||||||||||||||||||
| N/A | 0 | ||||||||||||||||||||||
| N/A | 0 | ||||||||||||||||||||||
| N/A | 0 | ||||||||||||||||||||||
| N/A | 0 | ||||||||||||||||||||||
| N/A | 0 | ||||||||||||||||||||||
| N/A | 0 | ||||||||||||||||||||||
| N/A | 0 | ||||||||||||||||||||||
| N/A | 0 | ||||||||||||||||||||||
| N/A | 0 | ||||||||||||||||||||||
| N/A | 0 | ||||||||||||||||||||||
| N/A | 0 | ||||||||||||||||||||||
| N/A | 0 | ||||||||||||||||||||||
| N/A | 0 | ||||||||||||||||||||||
| N/A | 0 | ||||||||||||||||||||||
| N/A | 0 | ||||||||||||||||||||||
| N/A | 0 | ||||||||||||||||||||||
| N/A | 0 | ||||||||||||||||||||||
| N/A | 0 | ||||||||||||||||||||||
| N/A | 0 | ||||||||||||||||||||||
| N/A | 0 | ||||||||||||||||||||||
| N/A | 0 | ||||||||||||||||||||||
| N/A | 0 | ||||||||||||||||||||||
| N/A | 0 | ||||||||||||||||||||||
| N/A | 0 | ||||||||||||||||||||||
| N/A | 0 | ||||||||||||||||||||||
| N/A | 0 | ||||||||||||||||||||||
| N/A | 0 | ||||||||||||||||||||||
| N/A | 0 | ||||||||||||||||||||||
| N/A | 0 | ||||||||||||||||||||||
| N/A | 0 | ||||||||||||||||||||||
| N/A | 0 | ||||||||||||||||||||||
| N/A | 0 | ||||||||||||||||||||||
| N/A | 0 | ||||||||||||||||||||||
| N/A | 0 | ||||||||||||||||||||||
| N/A | 0 | ||||||||||||||||||||||
| N/A | 0 | ||||||||||||||||||||||
| N/A | 0 | ||||||||||||||||||||||
Sheet 7: Table 4.2 (e)
| i | #N/A | Next Step | ||||||||||||||||||
| Table F4.2 (e) Company Involvement | ||||||||||||||||||||
| SBIC Applicant/Principal: | ; | ; | ||||||||||||||||||
| Number of Investments: | ||||||||||||||||||||
|
|
|
|||||||||||||||||||
| Count | 0 | 0 | 0 | 0 | 0 | 0 | 0 | 0 | 0 | 0 | 0 | 0 | 0 | 0 | 0 | |||||
|
|
|
|
|
|
|
|
|
|
|
Pre-Investment Role |
|
|
|
|
|
|
Post-Investment Role |
|||
| N/A | - | |||||||||||||||||||
| N/A | - | |||||||||||||||||||
| N/A | - | |||||||||||||||||||
| N/A | - | |||||||||||||||||||
| N/A | - | |||||||||||||||||||
| N/A | - | |||||||||||||||||||
| N/A | - | |||||||||||||||||||
| N/A | - | |||||||||||||||||||
| N/A | - | |||||||||||||||||||
| N/A | - | |||||||||||||||||||
| N/A | - | |||||||||||||||||||
| N/A | - | |||||||||||||||||||
| N/A | - | |||||||||||||||||||
| N/A | - | |||||||||||||||||||
| N/A | - | |||||||||||||||||||
| N/A | - | |||||||||||||||||||
| N/A | - | |||||||||||||||||||
| N/A | - | |||||||||||||||||||
| N/A | - | |||||||||||||||||||
| N/A | - | |||||||||||||||||||
| N/A | - | |||||||||||||||||||
| N/A | - | |||||||||||||||||||
| N/A | - | |||||||||||||||||||
| N/A | - | |||||||||||||||||||
| N/A | - | |||||||||||||||||||
| N/A | - | |||||||||||||||||||
| N/A | - | |||||||||||||||||||
| N/A | - | |||||||||||||||||||
| N/A | - | |||||||||||||||||||
| N/A | - | |||||||||||||||||||
| N/A | - | |||||||||||||||||||
| N/A | - | |||||||||||||||||||
| N/A | - | |||||||||||||||||||
| N/A | - | |||||||||||||||||||
| N/A | - | |||||||||||||||||||
| N/A | - | |||||||||||||||||||
| N/A | - | |||||||||||||||||||
| N/A | - | |||||||||||||||||||
| N/A | - | |||||||||||||||||||
| N/A | - | |||||||||||||||||||
| N/A | - | |||||||||||||||||||
| N/A | - | |||||||||||||||||||
| N/A | - | |||||||||||||||||||
| N/A | - | |||||||||||||||||||
| N/A | - | |||||||||||||||||||
| N/A | - | |||||||||||||||||||
| N/A | - | |||||||||||||||||||
| N/A | - | |||||||||||||||||||
| N/A | - | |||||||||||||||||||
| N/A | - | |||||||||||||||||||
| N/A | - | |||||||||||||||||||
| N/A | - | |||||||||||||||||||
| N/A | - | |||||||||||||||||||
| N/A | - | |||||||||||||||||||
| N/A | - | |||||||||||||||||||
| N/A | - | |||||||||||||||||||
| N/A | - | |||||||||||||||||||
| N/A | - | |||||||||||||||||||
| N/A | - | |||||||||||||||||||
| N/A | - | |||||||||||||||||||
| N/A | - | |||||||||||||||||||
| N/A | - | |||||||||||||||||||
| N/A | - | |||||||||||||||||||
| N/A | - | |||||||||||||||||||
| N/A | - | |||||||||||||||||||
| N/A | - | |||||||||||||||||||
| N/A | - | |||||||||||||||||||
| N/A | - | |||||||||||||||||||
| N/A | - | |||||||||||||||||||
| N/A | - | |||||||||||||||||||
| N/A | - | |||||||||||||||||||
| N/A | - | |||||||||||||||||||
| N/A | - | |||||||||||||||||||
| N/A | - | |||||||||||||||||||
| N/A | - | |||||||||||||||||||
| N/A | - | |||||||||||||||||||
| N/A | - | |||||||||||||||||||
| N/A | - | |||||||||||||||||||
| N/A | - | |||||||||||||||||||
| N/A | - | |||||||||||||||||||
| N/A | - | |||||||||||||||||||
| N/A | - | |||||||||||||||||||
| N/A | - | |||||||||||||||||||
| N/A | - | |||||||||||||||||||
| N/A | - | |||||||||||||||||||
| N/A | - | |||||||||||||||||||
| N/A | - | |||||||||||||||||||
| N/A | - | |||||||||||||||||||
| N/A | - | |||||||||||||||||||
| N/A | - | |||||||||||||||||||
| N/A | - | |||||||||||||||||||
| N/A | - | |||||||||||||||||||
| N/A | - | |||||||||||||||||||
| N/A | - | |||||||||||||||||||
| N/A | - | |||||||||||||||||||
| N/A | - | |||||||||||||||||||
| N/A | - | |||||||||||||||||||
| N/A | - | |||||||||||||||||||
| N/A | - | |||||||||||||||||||
| N/A | - | |||||||||||||||||||
| N/A | - | |||||||||||||||||||
| N/A | - | |||||||||||||||||||
| N/A | - | |||||||||||||||||||
| N/A | - | |||||||||||||||||||
| N/A | - | |||||||||||||||||||
| N/A | - | |||||||||||||||||||
| N/A | - | |||||||||||||||||||
| N/A | - | |||||||||||||||||||
| N/A | - | |||||||||||||||||||
| N/A | - | |||||||||||||||||||
| N/A | - | |||||||||||||||||||
| N/A | - | |||||||||||||||||||
| N/A | - | |||||||||||||||||||
| N/A | - | |||||||||||||||||||
| N/A | - | |||||||||||||||||||
| N/A | - | |||||||||||||||||||
| N/A | - | |||||||||||||||||||
| N/A | - | |||||||||||||||||||
| N/A | - | |||||||||||||||||||
| N/A | - | |||||||||||||||||||
| N/A | - | |||||||||||||||||||
| N/A | - | |||||||||||||||||||
| N/A | - | |||||||||||||||||||
| N/A | - | |||||||||||||||||||
| N/A | - | |||||||||||||||||||
| N/A | - | |||||||||||||||||||
| N/A | - | |||||||||||||||||||
| N/A | - | |||||||||||||||||||
| N/A | - | |||||||||||||||||||
| N/A | - | |||||||||||||||||||
| N/A | - | |||||||||||||||||||
| N/A | - | |||||||||||||||||||
| N/A | - | |||||||||||||||||||
| N/A | - | |||||||||||||||||||
| N/A | - | |||||||||||||||||||
| N/A | - | |||||||||||||||||||
| N/A | - | |||||||||||||||||||
| N/A | - | |||||||||||||||||||
| N/A | - | |||||||||||||||||||
| N/A | - | |||||||||||||||||||
| N/A | - | |||||||||||||||||||
| N/A | - | |||||||||||||||||||
| N/A | - | |||||||||||||||||||
Sheet 8: Table 4.3
| i | Go to Explanations Worksheet | Next Step | ||||||||||||||||||||||||||||||||
| Table 4.3 Synthesized Fund - Cash Flow Adjustments Worksheet | ||||||||||||||||||||||||||||||||||
| for : | ||||||||||||||||||||||||||||||||||
| WORKSHEET INSTRUCTIONS | ||||||||||||||||||||||||||||||||||
| 1.25 | Factor Used to Estimate Amount Needed During 1st 5 Years for Expenses | |||||||||||||||||||||||||||||||||
| This worksheet contains the fund cashflows and related financial statements, based on those investments entered in the Investments Worksheet. Using those investments, an estimate of the needed | First year adds additional 50% plus organizational set up fees to provide enough capital for management fees for next year | |||||||||||||||||||||||||||||||||
| take-downs, distributions, carried interest, and management fees were calculated. You may adjust these cashflows in two different methods: 1) By changing the "Calculation Variables" or 2) By "overriding" the | ||||||||||||||||||||||||||||||||||
| values, under "Override Cashflow Values". However, you must keep positive cash balances for at least one year of management fees. This can be accomplished by increasing take-down of capital, decreasing | 2.5% | Interest on Cash | ||||||||||||||||||||||||||||||||
| distributions, or decreasing management fees. However, if you materially change management fees, they must reflect what is in your business plan. Provide on the Explanations worksheet, rationale for | ||||||||||||||||||||||||||||||||||
| changes in any variables or changes to the management fee or carried interest cashflows. You do NOT need to explain changes to take down and distribution cashflow overrides, as long as you maintain a cash | ||||||||||||||||||||||||||||||||||
| balance equal to half a year of management fees AND your total Take Downs EXCEED Total Financings plus first five years of Management Fee Expenses. | ||||||||||||||||||||||||||||||||||
| FUND STATISTICS WITH CURRENT INPUTS | ||||||||||||||||||||||||||||||||||
| IRR | Err:523 | VY | 1899 | Last Year in Investment Group: | 1899 | |||||||||||||||||||||||||||||
| Distributions to Paid In Capital | #DIV/0! | Fund Age | 0 | Number of Investments: | 0 | |||||||||||||||||||||||||||||
| Residual Value to Paid In Capital | #DIV/0! | Year Paid Back | 0 | |||||||||||||||||||||||||||||||
| Next Step | Total Value to Paid In Capital | #DIV/0! | Years Until Payback | Not yet | ||||||||||||||||||||||||||||||
| Investment Period | ||||||||||||||||||||||||||||||||||
| Total | 1899 | |||||||||||||||||||||||||||||||||
| INVESTMENT SUMMARY INFORMATION | ||||||||||||||||||||||||||||||||||
| Investment Financings | $- | $- | $- | $- | $- | $- | $- | $- | $- | $- | $- | $- | $- | $- | $- | $- | $- | $- | $- | $- | $- | $- | $- | $- | $- | $- | ||||||||
| Balance Sheet Cost of Investments | $- | |||||||||||||||||||||||||||||||||
| Total Cash/Non-Cash Proceeds | $- | $- | $- | $- | $- | $- | $- | $- | $- | $- | $- | $- | $- | $- | $- | $- | $- | $- | $- | $- | $- | $- | $- | $- | $- | $- | ||||||||
| Cost Basis Associated With Proceeds | $- | $- | $- | $- | $- | $- | $- | $- | $- | $- | $- | $- | $- | $- | $- | $- | $- | $- | $- | $- | $- | $- | $- | $- | $- | $- | ||||||||
| Realized Gains (Losses) | $- | $- | $- | $- | $- | $- | $- | $- | $- | $- | $- | $- | $- | $- | $- | $- | $- | $- | $- | $- | $- | $- | $- | $- | $- | $- | ||||||||
| METHOD 1 - ADJUSTMENT TO CALCULATION VARIABLES | ||||||||||||||||||||||||||||||||||
| Management Fee Rate | 2.50% | The maximum SBIC management fee rate is 2.5% which is applied to committed capital plus an assumed two tiers of SBA capital during the investment | ||||||||||||||||||||||||||||||||
| period (five years) and to cost of assets thereafter. If you are proposing a different rate, you should change it to your proposed rate. | ||||||||||||||||||||||||||||||||||
| Carried Interest Rate | 20% | Identify the carried interest used in your business plan. | ||||||||||||||||||||||||||||||||
| Organizational/Setup Fees | $- | While this may be amortized over time, the cash outlay normally occurs in the first year. | ||||||||||||||||||||||||||||||||
| CALCULATED TAKE DOWNS, DISTRIBUTIONS, CARRIED INTEREST, AND MGT FEE CASHFLOWS | ||||||||||||||||||||||||||||||||||
| Take Downs | $- | $- | $- | $- | $- | $- | $- | $- | $- | $- | $- | $- | $- | $- | $- | $- | $- | $- | $- | $- | $- | $- | $- | $- | $- | $- | ||||||||
| Total Distributions (before carried interest) | $- | $- | $- | $- | $- | $- | $- | $- | $- | $- | $- | $- | $- | $- | $- | $- | $- | $- | $- | $- | $- | $- | $- | $- | $- | $- | ||||||||
| Carried Interest | $- | $- | $- | $- | $- | $- | $- | $- | $- | $- | $- | $- | $- | $- | $- | $- | $- | $- | $- | $- | $- | $- | $- | $- | $- | $- | ||||||||
| Total Distributions after carried interest | $- | $- | $- | $- | $- | $- | $- | $- | $- | $- | $- | $- | $- | $- | $- | $- | $- | $- | $- | $- | $- | $- | $- | $- | $- | $- | ||||||||
| Management Fee Expenses | $- | - | - | - | - | - | - | - | - | - | - | - | - | - | - | - | - | - | - | - | - | - | - | - | - | - | ||||||||
| METHOD 2 - ADJUSTMENT TO CASHFLOW VALUES | ||||||||||||||||||||||||||||||||||
| Minimum Takedowns | $- | |||||||||||||||||||||||||||||||||
| OVERRIDE CASHFLOW VALUES | Override? (Y or N) | |||||||||||||||||||||||||||||||||
| Take Downs | N | $- | ||||||||||||||||||||||||||||||||
| Total Distributions (before carried interest) | N | $- | ||||||||||||||||||||||||||||||||
| Carried Interest | N | $- | ||||||||||||||||||||||||||||||||
| Management Fee Expenses | N | $- | ||||||||||||||||||||||||||||||||
| Resulting Distributions Minus Carried Interest | $- | $- | $- | $- | $- | $- | $- | $- | $- | $- | $- | $- | $- | $- | $- | $- | $- | $- | $- | $- | $- | $- | $- | $- | $- | $- | ||||||||
| ENDING YEAR CASH BALANCE | $- | $- | $- | $- | $- | $- | $- | $- | $- | $- | $- | $- | $- | $- | $- | $- | ||||||||||||||||||
| *Cash Problem Indicators-> | ||||||||||||||||||||||||||||||||||
| Number of Cashflow Problems: | 0 | |||||||||||||||||||||||||||||||||
| * | Red cells indicate too low cash balances. Cash balances need to maintain at least one year of management fees (based on that year). Either less distributions need to be taken or more take downs are needed. Please fix via cashflow overrides. | |||||||||||||||||||||||||||||||||
| FINANCIALS | ||||||||||||||||||||||||||||||||||
| DISTRIBUTION CALCULATIONS | ||||||||||||||||||||||||||||||||||
| FUND STATISTICS CALCULATIONS | ||||||||||||||||||||||||||||||||||
Sheet 9: Table 4.3 (a)
| Table 4.3 Synthesized Fund - Cash Flow Adjustments Worksheet Explanations | Return to Cashflow Adjustments Worksheet | Next Step | |||||||||||||
| for : | |||||||||||||||
Sheet 10: Table 4.4 (a)
| i | IRR Guess | -90% | Next Step | |||||||||||||||||||||||||||
| Table F4.4 (a) Portfolio Summary | ||||||||||||||||||||||||||||||
| SBIC Applicant/Principal: ; | ||||||||||||||||||||||||||||||
| Number of Investments: | ||||||||||||||||||||||||||||||
| Portfolio Company Overview | Gains (Loss) | Performance Metrics based on Current Values | ||||||||||||||||||||||||||||
| Company |
|
|
Total Financing Costs | Percent of Cost | Total Cash & Non-Cash Proceeds | Cost Basis of Proceeds | Residual Value | Residual Cost | Realized | Unrealized | Total | Realized Gains | Realized Losses | IRR | Residual Value to Residual Cost | Distributions to Total Cost | Residual Value to Total Cost | Total Value to Cost Multiple | Year of Initial Investment | Last Year Exited | Projected/ Actual year to Exit | Years to Exit | ||||||||
| TOTALS | $- | 0% | $- | $- | $- | $- | $- | $- | $- | Gross Pool | Err:523 | #DIV/0! | 0.00 | 0.00 | 0.00 | 0 | 0 | 0 | 0.00 | |||||||||||
| Average | #DIV/0! | #DIV/0! | #DIV/0! | #DIV/0! | #DIV/0! | #DIV/0! | #DIV/0! | #DIV/0! | ||||||||||||||||||||||
| Cpt Wgt Avg | 0.0% | 0.00 | 0.00 | 0.00 | 0.00 | |||||||||||||||||||||||||
| Median | #VALUE! | #VALUE! | #VALUE! | #VALUE! | #VALUE! | #VALUE! | #VALUE! | #VALUE! | ||||||||||||||||||||||
Sheet 11: Table 4.4 (b)
| i | Next Step | |||||||||||||||||||||||||||
| Table F4.4 (b) Portfolio Financing Statistics | ||||||||||||||||||||||||||||
| SBIC Applicant/Principal: ; | ||||||||||||||||||||||||||||
| Gross Financing/Investment Statistics (Before Expenses) | ||||||||||||||||||||||||||||
| Number of Portfolio Companies | 0 | |||||||||||||||||||||||||||
| Number of Financings | #VALUE! | |||||||||||||||||||||||||||
| Total Cost of Investments | $- | |||||||||||||||||||||||||||
| Distribution of Individual Financings by Dollar Size | ||||||||||||||||||||||||||||
| From | To | Total Financing Dollars | % of Financing Dollars | Number of Financings | % of Financings | |||||||||||||||||||||||
| 1 | $- | #VALUE! | #VALUE! | #VALUE! | #VALUE! | #VALUE! | ||||||||||||||||||||||
| 2 | #VALUE! | #VALUE! | #VALUE! | #VALUE! | #VALUE! | #VALUE! | ||||||||||||||||||||||
| 3 | #VALUE! | #VALUE! | #VALUE! | #VALUE! | #VALUE! | #VALUE! | ||||||||||||||||||||||
| 4 | #VALUE! | #VALUE! | #VALUE! | #VALUE! | #VALUE! | #VALUE! | ||||||||||||||||||||||
| Total | #VALUE! | #VALUE! | #VALUE! | #VALUE! | ||||||||||||||||||||||||
| Median Financing Size | #VALUE! | Maximum | #VALUE! | Smallest | $- | |||||||||||||||||||||||
| Distribution of Company Financings by Dollar Size | ||||||||||||||||||||||||||||
| From | To | Total Financing Dollars | % of Financing Dollars | Number of Companies | % of Companies | |||||||||||||||||||||||
| 1 | $- | #VALUE! | #VALUE! | #VALUE! | #VALUE! | #VALUE! | ||||||||||||||||||||||
| 2 | #VALUE! | #VALUE! | #VALUE! | #VALUE! | #VALUE! | #VALUE! | ||||||||||||||||||||||
| 3 | #VALUE! | #VALUE! | #VALUE! | #VALUE! | #VALUE! | #VALUE! | ||||||||||||||||||||||
| 4 | #VALUE! | $- | #VALUE! | #VALUE! | #VALUE! | #VALUE! | ||||||||||||||||||||||
| Total | #VALUE! | #VALUE! | #VALUE! | #VALUE! | ||||||||||||||||||||||||
| Median Company Financing Size | #VALUE! | Maximum | $- | Smallest | $- | |||||||||||||||||||||||
| Distribution of Exit Mechanisms Utilized | ||||||||||||||||||||||||||||
| Exit Mechanism | Total Financing Dollars (Cost) | % of Financing Dollars | Number of Exit Events | % of Exits | Total Proceeds | % of Proceeds | ||||||||||||||||||||||
| 1 | IPO | $- | #DIV/0! | 0 | #DIV/0! | $- | #DIV/0! | |||||||||||||||||||||
| 2 | Write-off | $- | #DIV/0! | 0 | #DIV/0! | $- | #DIV/0! | |||||||||||||||||||||
| 3 | Sale | $- | #DIV/0! | 0 | #DIV/0! | $- | #DIV/0! | |||||||||||||||||||||
| 4 | Recap | $- | #DIV/0! | 0 | #DIV/0! | $- | #DIV/0! | |||||||||||||||||||||
| 5 | Loan Repayment | $- | #DIV/0! | 0 | #DIV/0! | $- | #DIV/0! | |||||||||||||||||||||
| 6 | Merger/Acquisition | $- | #DIV/0! | 0 | #DIV/0! | $- | #DIV/0! | |||||||||||||||||||||
| 7 | Distress | $- | #DIV/0! | 0 | #DIV/0! | $- | #DIV/0! | |||||||||||||||||||||
| 8 | MBO (including ESOPs) | $- | #DIV/0! | 0 | #DIV/0! | $- | #DIV/0! | |||||||||||||||||||||
| Total | $- | #DIV/0! | 0 | #DIV/0! | $- | #DIV/0! | ||||||||||||||||||||||
| Total | ||||||||||||||||||||||||||||
| Distribution of Company Financings by Stage/Life Cycle | ||||||||||||||||||||||||||||
| Stage | Total Financing Dollars | % of Financing Dollars | Number of Companies | % of Companies | Proceeds ($) | % of Proceeds | Residual Values ($) | Residual Cost ($) | Multiple of Cost | Basis of Cost of Proceeds | Realized Gains (Losses) | Unrealized Gains (Losses) | Total Gains (Losses) | Realized Gains | Realized Losses | |||||||||||||
| 1 | Expansion | $- | #DIV/0! | 0 | #DIV/0! | $- | #DIV/0! | $- | $- | - | $- | $- | $- | $- | Expansion | $- | $- | |||||||||||
| 2 | Early | $- | #DIV/0! | 0 | #DIV/0! | $- | #DIV/0! | $- | $- | - | $- | $- | $- | $- | Early | $- | $- | |||||||||||
| 3 | Seed | $- | #DIV/0! | 0 | #DIV/0! | $- | #DIV/0! | $- | $- | - | $- | $- | $- | $- | Seed | $- | $- | |||||||||||
| 4 | Later | $- | #DIV/0! | 0 | #DIV/0! | $- | #DIV/0! | $- | $- | - | $- | $- | $- | $- | Later | $- | $- | |||||||||||
| 5 | Change of Control | $- | #DIV/0! | 0 | #DIV/0! | $- | #DIV/0! | $- | $- | - | $- | $- | $- | $- | Change of Control | $- | $- | |||||||||||
| 6 | Turn Around | $- | #DIV/0! | 0 | #DIV/0! | $- | #DIV/0! | $- | $- | - | $- | $- | $- | $- | Turn Around | $- | $- | |||||||||||
| Total | $- | #DIV/0! | 0 | #DIV/0! | $- | #DIV/0! | $- | $- | - | $- | $- | $- | $- | |||||||||||||||
| By Industry | ||||||||||||||||||||||||||||
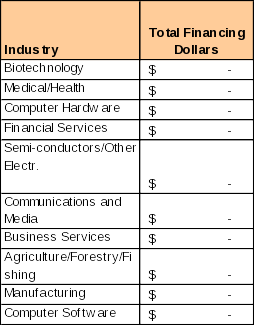
| Industry | Total Financing Dollars | % of Financing Dollars | Number of Companies | % of Companies | Proceeds ($) | % of Proceeds | Residual Values ($) | Residual Cost ($) | Multiple of Cost | Basis of Cost of Proceeds | Realized Gains (Losses) | Unrealized Gains (Losses) | Total Gains (Losses) | Realized Gains | Realized Losses | |||||||||||||
| 1 | Biotechnology | $- | #DIV/0! | 0 | #DIV/0! | $- | #DIV/0! | $- | $- | - | $- | $- | $- | $- | Biotechnology | $- | $- | |||||||||||
| 2 | Medical/Health | $- | #DIV/0! | 0 | #DIV/0! | $- | #DIV/0! | $- | $- | - | $- | $- | $- | $- | Medical/Health | $- | $- | |||||||||||
| 3 | Computer Hardware | $- | #DIV/0! | 0 | #DIV/0! | $- | #DIV/0! | $- | $- | - | $- | $- | $- | $- | Computer Hardware | $- | $- | |||||||||||
| 4 | Financial Services | $- | #DIV/0! | 0 | #DIV/0! | $- | #DIV/0! | $- | $- | - | $- | $- | $- | $- | Financial Services | $- | $- | |||||||||||
| 5 | Semi-conductors/Other Electr. | $- | #DIV/0! | 0 | #DIV/0! | $- | #DIV/0! | $- | $- | - | $- | $- | $- | $- | Semi-conductors/Other Electr. | $- | $- | |||||||||||
| 6 | Communications and Media | $- | #DIV/0! | 0 | #DIV/0! | $- | #DIV/0! | $- | $- | - | $- | $- | $- | $- | Communications and Media | $- | $- | |||||||||||
| 7 | Business Services | $- | #DIV/0! | 0 | #DIV/0! | $- | #DIV/0! | $- | $- | - | $- | $- | $- | $- | Business Services | $- | $- | |||||||||||
| 8 | Agriculture/Forestry/Fishing | $- | #DIV/0! | 0 | #DIV/0! | $- | #DIV/0! | $- | $- | - | $- | $- | $- | $- | Agriculture/Forestry/Fishing | $- | $- | |||||||||||
| 9 | Manufacturing | $- | #DIV/0! | 0 | #DIV/0! | $- | #DIV/0! | $- | $- | - | $- | $- | $- | $- | Manufacturing | $- | $- | |||||||||||
| 10 | Computer Software | $- | #DIV/0! | 0 | #DIV/0! | $- | #DIV/0! | $- | $- | - | $- | $- | $- | $- | Computer Software | $- | $- | |||||||||||
| 11 | Consumer Related | $- | #DIV/0! | 0 | #DIV/0! | $- | #DIV/0! | $- | $- | - | $- | $- | $- | $- | Consumer Related | $- | $- | |||||||||||
| 12 | Transportation | $- | #DIV/0! | 0 | #DIV/0! | $- | #DIV/0! | $- | $- | - | $- | $- | $- | $- | Transportation | $- | $- | |||||||||||
| 13 | Industrial/Energy | $- | #DIV/0! | 0 | #DIV/0! | $- | #DIV/0! | $- | $- | - | $- | $- | $- | $- | Industrial/Energy | $- | $- | |||||||||||
| 14 | Internet Specific | $- | #DIV/0! | 0 | #DIV/0! | $- | #DIV/0! | $- | $- | - | $- | $- | $- | $- | Internet Specific | $- | $- | |||||||||||
| 15 | Computer Other | $- | #DIV/0! | 0 | #DIV/0! | $- | #DIV/0! | $- | $- | - | $- | $- | $- | $- | Computer Other | $- | $- | |||||||||||
| 16 | Construction | $- | #DIV/0! | 0 | #DIV/0! | $- | #DIV/0! | $- | $- | - | $- | $- | $- | $- | Construction | $- | $- | |||||||||||
| 17 | Utilities | $- | #DIV/0! | 0 | $- | #DIV/0! | $- | $- | - | $- | $- | $- | $- | Utilities | $- | $- | ||||||||||||
| 18 | Other | $- | #DIV/0! | 0 | #DIV/0! | $- | #DIV/0! | $- | $- | - | $- | $- | $- | $- | Other | $- | $- | |||||||||||
| $- | #DIV/0! | 0 | #DIV/0! | $- | #DIV/0! | $- | $- | - | $- | $- | $- | $- | ||||||||||||||||
| By Geographic Region | ||||||||||||||||||||||||||||
| Region | Total Financing Dollars | % of Financing Dollars | Number of Companies | % of Companies | Proceeds ($) | % of Proceeds | Residual Values ($) | Residual Cost ($) | Multiple of Cost | Basis of Cost of Proceeds | Realized Gains (Losses) | Unrealized Gains (Losses) | Total Gains (Losses) | Realized Gains | Realized Losses | |||||||||||||
| 1 | Southwest | $- | #DIV/0! | 0 | #DIV/0! | $- | #DIV/0! | $- | $- | - | $- | $- | $- | $- | Southwest | $- | $- | |||||||||||
| 2 | Northeast | $- | #DIV/0! | 0 | #DIV/0! | $- | #DIV/0! | $- | $- | - | $- | $- | $- | $- | Northeast | $- | $- | |||||||||||
| 3 | Mid-Atlantic | $- | #DIV/0! | 0 | #DIV/0! | $- | #DIV/0! | $- | $- | - | $- | $- | $- | $- | Mid-Atlantic | $- | $- | |||||||||||
| 4 | Southeast | $- | #DIV/0! | 0 | #DIV/0! | $- | #DIV/0! | $- | $- | - | $- | $- | $- | $- | Southeast | $- | $- | |||||||||||
| 5 | Northwest | $- | #DIV/0! | 0 | #DIV/0! | $- | #DIV/0! | $- | $- | - | $- | $- | $- | $- | Northwest | $- | $- | |||||||||||
| 6 | MidCentral | $- | #DIV/0! | 0 | #DIV/0! | $- | #DIV/0! | $- | $- | - | $- | $- | $- | $- | MidCentral | $- | $- | |||||||||||
| 7 | Other/Non-US | $- | #DIV/0! | 0 | #DIV/0! | $- | #DIV/0! | $- | $- | - | $- | $- | $- | $- | Other/Non-US | $- | $- | |||||||||||
| $- | #DIV/0! | 0 | #DIV/0! | $- | #DIV/0! | $- | $- | - | $- | $- | $- | $- | ||||||||||||||||
| By Financial Status | ||||||||||||||||||||||||||||
| Financial Status | Total Financing Dollars | % of Financing Dollars | Number of Companies | % of Companies | Proceeds ($) | % of Proceeds | Residual Values ($) | Residual Cost ($) | Multiple of Cost | Basis of Cost of Proceeds | Realized Gains (Losses) | Unrealized Gains (Losses) | Total Gains (Losses) | Realized Gains | Realized Losses | |||||||||||||
| 1 | Above | $- | #DIV/0! | 0 | #DIV/0! | $- | #DIV/0! | $- | $- | - | $- | $- | $- | $- | $- | $- | ||||||||||||
| 2 | Loss | $- | #DIV/0! | 0 | #DIV/0! | $- | #DIV/0! | $- | $- | - | $- | $- | $- | $- | $- | $- | ||||||||||||
| 3 | Total Loss | $- | #DIV/0! | 0 | #DIV/0! | $- | #DIV/0! | $- | $- | - | $- | $- | $- | $- | $- | $- | ||||||||||||
| 4 | Flat | $- | #DIV/0! | 0 | #DIV/0! | $- | #DIV/0! | $- | $- | - | $- | $- | $- | $- | $- | $- | ||||||||||||
| $- | #DIV/0! | 0 | #DIV/0! | $- | #DIV/0! | $- | $- | - | $- | $- | $- | $- | ||||||||||||||||
Sheet 12: Table 4.4 (c)
| i | Next Step | |||||||||||||||||||||||||
| Table F4.4 (c) Portfolio Company Performance Statistics | ||||||||||||||||||||||||||
| SBIC Applicant/Principal: ; | ||||||||||||||||||||||||||
| Gross Financing/Investment Statistics (Before Expenses) | ||||||||||||||||||||||||||
| Total Cost of Investments | $- | Gross IRR (Includes Residual Value) | Err:523 | |||||||||||||||||||||||
| Total Distributions/Proceeds from Investments | $- | |||||||||||||||||||||||||
| Total Residual Value of Investments | $- | Distributions to Total Cost/Financing | 0.00 | |||||||||||||||||||||||
| Distributions + Residual Value - Cost | $- | Residual Value to Total Cost | 0.00 | |||||||||||||||||||||||
| Total Value to Total Cost | 0.00 | |||||||||||||||||||||||||
| Cost Basis for Investment Proceeds | $- | |||||||||||||||||||||||||
| Total Realized Gains (Losses) | $- | Residual Value to Residual Cost | #DIV/0! | |||||||||||||||||||||||
| By Stage/Life Cycle | ||||||||||||||||||||||||||
| Averages | ||||||||||||||||||||||||||
| Stage | Realized Gains (Losses) | Unrealized Gains (Losses) | Total Gains (Losses) | IRR | Distributions to Total Costs | Residual Value to Total Cost | Total Value to Total Cost | Residual Value to Residual Costs | Years to Exit | |||||||||||||||||
| 1 | Seed | $- | $- | $- | 0.0% | - | - | - | - | - | ||||||||||||||||
| 2 | Early | $- | $- | $- | 0.0% | - | - | - | - | - | ||||||||||||||||
| 3 | Expansion | $- | $- | $- | 0.0% | - | - | - | - | - | ||||||||||||||||
| 4 | Later | $- | $- | $- | 0.0% | - | - | - | - | - | ||||||||||||||||
| 5 | Change of Control | $- | $- | $- | 0.0% | - | - | - | - | - | ||||||||||||||||
| 6 | Turn Around | $- | $- | $- | 0.0% | - | - | - | - | - | ||||||||||||||||
| Total | $- | $- | $- | |||||||||||||||||||||||
| By Industry | ||||||||||||||||||||||||||
| Averages | ||||||||||||||||||||||||||
| Industry | Realized Gains (Losses) | Unrealized Gains (Losses) | Total Gains (Losses) | IRR | Distributions to Total Costs | Residual Value to Total Cost | Total Value to Total Cost | Residual Value to Residual Costs | Years to Exit | |||||||||||||||||
| 1 | Communications and Media | $- | $- | $- | 0.0% | - | - | - | - | - | ||||||||||||||||
| 2 | Internet Specific | $- | $- | $- | 0.0% | - | - | - | - | - | ||||||||||||||||
| 3 | Computer Hardware | $- | $- | $- | 0.0% | - | - | - | - | - | ||||||||||||||||
| 4 | Computer Software | $- | $- | $- | 0.0% | - | - | - | - | - | ||||||||||||||||
| 5 | Computer Other | $- | $- | $- | 0.0% | - | - | - | - | - | ||||||||||||||||
| 6 | Semi-conductors/Other Electr. | $- | $- | $- | 0.0% | - | - | - | - | - | ||||||||||||||||
| 7 | Biotechnology | $- | $- | $- | 0.0% | - | - | - | - | - | ||||||||||||||||
| 8 | Medical/Health | $- | $- | $- | 0.0% | - | - | - | - | - | ||||||||||||||||
| 9 | Consumer Related | $- | $- | $- | 0.0% | - | - | - | - | - | ||||||||||||||||
| 10 | Industrial/Energy | $- | $- | $- | 0.0% | - | - | - | - | - | ||||||||||||||||
| 11 | Transportation | $- | $- | $- | 0.0% | - | - | - | - | - | ||||||||||||||||
| 12 | Financial Services | $- | $- | $- | 0.0% | - | - | - | - | - | ||||||||||||||||
| 13 | Business Services | $- | $- | $- | 0.0% | - | - | - | - | - | ||||||||||||||||
| 14 | Manufacturing | $- | $- | $- | 0.0% | - | - | - | - | - | ||||||||||||||||
| 15 | Agriculture/Forestry/Fishing | $- | $- | $- | 0.0% | - | - | - | - | - | ||||||||||||||||
| 16 | Construction | $- | $- | $- | 0.0% | - | - | - | - | - | ||||||||||||||||
| 17 | Utilities | $- | $- | $- | 0.0% | - | - | - | - | - | ||||||||||||||||
| 18 | Other | $- | $- | $- | 0.0% | - | - | - | - | - | ||||||||||||||||
| $- | $- | $- | ||||||||||||||||||||||||
| By Geographic Region | ||||||||||||||||||||||||||
| Averages | ||||||||||||||||||||||||||
| Region | Realized Gains (Losses) | Unrealized Gains (Losses) | Total Gains (Losses) | IRR | Distributions to Total Costs | Residual Value to Total Cost | Total Value to Total Cost | Residual Value to Residual Costs | Years to Exit | |||||||||||||||||
| 1 | Northeast | $- | $- | $- | 0.0% | - | - | - | - | - | ||||||||||||||||
| 2 | Northwest | $- | $- | $- | 0.0% | - | - | - | - | - | ||||||||||||||||
| 3 | Mid-Atlantic | $- | $- | $- | 0.0% | - | - | - | - | - | ||||||||||||||||
| 4 | Southeast | $- | $- | $- | 0.0% | - | - | - | - | - | ||||||||||||||||
| 5 | Southwest | $- | $- | $- | 0.0% | - | - | - | - | - | ||||||||||||||||
| 6 | MidCentral | $- | $- | $- | 0.0% | - | - | - | - | - | ||||||||||||||||
| 7 | Other/Non-US | $- | $- | $- | 0.0% | - | - | - | - | - | ||||||||||||||||
| $- | $- | $- | ||||||||||||||||||||||||
| By Financial Status | ||||||||||||||||||||||||||
| Averages | ||||||||||||||||||||||||||
| Financial Status | Realized Gains (Losses) | Unrealized Gains (Losses) | Total Gains (Losses) | IRR | Distributions to Total Costs | Residual Value to Total Cost | Total Value to Total Cost | Residual Value to Residual Costs | Years to Exit | |||||||||||||||||
| 1 | Above | $- | $- | $- | 0.0% | - | - | - | - | - | ||||||||||||||||
| 2 | Flat | $- | $- | $- | 0.0% | - | - | - | - | - | ||||||||||||||||
| 3 | Loss | $- | $- | $- | 0.0% | - | - | - | - | - | ||||||||||||||||
| 4 | Total Loss | $- | $- | $- | 0.0% | - | - | - | - | - | ||||||||||||||||
| $- | $- | $- | ||||||||||||||||||||||||
Sheet 13: Table 4.4 (d)
| i | Next Step | |||||||||||||||||||||||||
| Table F4.4 (d) Graphics | ||||||||||||||||||||||||||
| SBIC Applicant/Principal: ; | ||||||||||||||||||||||||||
| PORTFOLIO INVESTMENTS BY FINANCIAL STATUS | ||||||||||||||||||||||||||

|
||||||||||||||||||||||||||
| Total Number of Investments | 0 | Total Financing Costs to Date | $- | |||||||||||||||||||||||
|
|
|||||||||||||||||||||||||
| PORTFOLIO COMPANIES BY REGION | 
|
|||||||||||||||||||||||||
| Total Number of Investments | 0 | Total Financing Costs to Date | $- | |||||||||||||||||||||||
|
|
|||||||||||||||||||||||||
| PORTFOLIO INVESTMENTS BY COMPANY | ||||||||||||||||||||||||||
| Total Financing Costs to Date | $- | Total Proceeds | $- | Total Realized Gains (Losses) | $- | |||||||||||||||||||||
|
|
|||||||||||||||||||||||||
| Legend of top 14 companies by cost. | ||||||||||||||||||||||||||
|
||||||||||||||||||||||||||
| PORTFOLIO INVESTMENTS BY INDUSTRY | ||||||||||||||||||||||||||
| Total Financing Costs to Date | $- | Total Proceeds | $- | Total Realized Gains (Losses) | $- | |||||||||||||||||||||
|
|
|||||||||||||||||||||||||
| PORTFOLIO INVESTMENTS BY STAGE | ||||||||||||||||||||||||||
|
|
|
||||||||||||||||||||||||


Sheet 14: Table 4.4 (e)
| i | |||||||||||||||||||||||||||||
| Table F4.4(e) - Overall Fund Statistics | As of Date: | 12/1899 | |||||||||||||||||||||||||||
| SBIC Applicant/Principal: ; | Number of Investments: | 0 | |||||||||||||||||||||||||||
| FUND SUMMARY STATISTICS | |||||||||||||||||||||||||||||
| Net Financing/Investment Statistics (After Management Expenses) | |||||||||||||||||||||||||||||
| Total Takedowns (Paid-In Capital) | $- | ||||||||||||||||||||||||||||
| Total Distributions (After Carry) | $- | ||||||||||||||||||||||||||||
| Total Residual Value | $- | ||||||||||||||||||||||||||||
| Distributions + Residual - Take-downs | $- | ||||||||||||||||||||||||||||
| Venture Comparison | |||||||||||||||||||||||||||||
| Net IRR (Includes Residual Value) | Err:523 | #N/A | |||||||||||||||||||||||||||
| Distributions to Paid In Capital | #DIV/0! | #N/A | |||||||||||||||||||||||||||
| Residual Value to Paid in Capital | #DIV/0! | ||||||||||||||||||||||||||||
| Total Value to Paid in Capital | #DIV/0! | ||||||||||||||||||||||||||||
| Vintage Year of Fund | |||||||||||||||||||||||||||||
| Age of Fund (Through Close of Investment Group or Today) | 0 | ||||||||||||||||||||||||||||
| Years to Payback | Not yet | ||||||||||||||||||||||||||||
| Total Management Fees and Carry | |||||||||||||||||||||||||||||
| Management Fees | $- | ||||||||||||||||||||||||||||
| Carried Interest | $- | ||||||||||||||||||||||||||||
| Residual Value Carry | $- | ||||||||||||||||||||||||||||
| Total | $- | ||||||||||||||||||||||||||||
| Principal's Activity | |||||||||||||||||||||||||||||
| Pre-Investment | Post-Investment | ||||||||||||||||||||||||||||
| Deal Lead | Top Ranking Officer Replaced | ||||||||||||||||||||||||||||
| Deal Co-Lead | Board of Directors | ||||||||||||||||||||||||||||
| Deal Source | Committees | ||||||||||||||||||||||||||||
| Financial Analysis | Exit Process | ||||||||||||||||||||||||||||
| Market Research | Workouts, etc.. | ||||||||||||||||||||||||||||
| Lead Due Diligence | Officer of the company | ||||||||||||||||||||||||||||
| Investment Committee | |||||||||||||||||||||||||||||
| Negotiation | |||||||||||||||||||||||||||||
| Closing | |||||||||||||||||||||||||||||
Sheet 15: File Name Help
| File Name Help | Return to Instructions | ||||||||||||
| Select type of Exhibit | 3 |
F2 | Complete | Complete | Exhibit F2 - Complete.xls | If you were with a venture fund for the entire fund's life or if fund is still ongoing. | |||||||
| F3 | Partial | Partial | Exhibit F3 - Partial.xls | If you were with a venture fund for only part of the fund's timeframe. | |||||||||
| 10 character name acronym identifying your applicant name | New Ven II | F4 | Synthesized | Syn | Exhibit F4 - Synthesized.xls | Groups of separate investments not done within a single venture fund. Investments must be at least $250,000 by total company financing OR a minimum of $100,000 with a board seat. | |||||||
| F5 | Other | Other | Exhibit F5 - Other.xls | All other investments. | |||||||||
| First Year of Investment for this Fund or Group | 1994 | ||||||||||||
| First and last name initials for each principal for which the workbook applies (separated by commas) | |||||||||||||
| DJ | |||||||||||||
| Date when this report was prepared | 9/30/2003 | ||||||||||||
| Resulting File Name: | F4-New Ven II; Syn1994; DJ; 20030930.xls | ||||||||||||
| F4-New Ven II; Syn1994; DJ; 20030930.xls | |||||||||||||
| File Type | application/vnd.ms-excel |
| Author | TMJamers |
| Last Modified By | CBRich |
| File Modified | 2007-04-04 |
| File Created | 2003-10-20 |
© 2026 OMB.report | Privacy Policy