Form CFI 197 CFI 197 DOC NOAA NWS Climate Services
American Customer Satisfaction Index
CFI 197 DOC NOAA NWS Climate Services
CFI 197 DOC NOAA NWS Climate Services, CFI 198 USDA FSA
OMB: 1505-0191


NOAA’s National Weather Service
Climate Services Program
Customer Satisfaction Study 2009
Introduction
NOAA’s National Weather Service (NWS) Climate Services program is committed to meeting the needs of its customers through collaboration and partnerships, outreach and training, and the NWS delivery infrastructure, which includes the Climate Prediction Center and NWS Regional and Local offices. The NWS is researching user satisfaction with products and services provided by the Climate Services program, and would appreciate your feedback. The purpose of this research, conducted in partnership with the federal government as part of the American Customer Satisfaction Index, is to help NWS improve its climate products and services for you and others like you.
Your answers are voluntary, but your opinions are very important for this research. Your responses will be held completely confidential, and you will never be identified by name. CFI Group, a third party research and consulting firm, is administering this survey via a secure server. The time required to complete this survey will be dependent on how certain questions are answered, but it will likely take approximately 20 minutes, and is authorized by Office of Management and Budget Control No. 1505-0191.
Please click on the “Next” button below to begin the survey.
Part 1: Information about you:
1.1 Please provide your zip code.
1.2 What area best applies to you as a user of NWS climate information?
a. Academia
b. Government (non-NOAA)
c. NOAA (non-NWS)
d. NWS
e. Commercial
f. Public
g. Other (please specify)
1.3 What best describes your geographical scope of use of NWS climate information?
a. Local (US)
b. State or regional area (US)
c. US only
d. North America
e. Global or a region outside North America
f. Other (please specify)
1.4 What best describes your area of responsibility as a user of NWS climate information?
a. Forecasting
b. Emergency management
c. Research
d. Education
e. Media
f. Resource management
g. Agriculture
h. Transportation
i. Financial markets
j. Personal
k. Other (please specify)
Part 2: Climate Prediction Center (CPC) climate services
2.1 Please check all types of CPC climate information that you use. You may check more than one type.
a. Graphics
b. Data
c. Text discussions
d. Forecasts or Predictions
e. Monitoring
f. Expert assessment
g. Do not use (Skip to Part 3)
2.2 Which specific CPC climate products do you use? Please select all that apply.
a. Extended range (6-10 day or 8-14 day forecasts) (Skip to 2.3.1)
b. Long range (Monthly or seasonal forecasts) (Skip to 2.4.1)
c. Hazards (US or Global) (Skip to 2.5.1)
d. ENSO (El Nino and La Nina) (Skip to 2.6.1)
e. Drought (Monitor or Outlook) (Skip to 2.7.1)
f. Other (Skip to 2.2.1)
User specified CPC products
2.2.1 Please state CPC products you use that were not listed: Open text answer
2.2.2 How frequently do you use these CPC products?
a. Infrequently, but I have used it.
b. Occasionally
c. Frequently
d. Very frequently, but not always
e. Nearly every time it is released
2.2.3 Using a 1 to 10 scale where 1 means Very Dissatisfied and 10 means Very Satisfied, how satisfied overall are you with these CPC products?
2.2.4a Using a 1 to 10 scale where 1 means Poor and 10 means Excellent, how well do these CPC products meet your needs for this type of climate information?
2.2.4b If you did not answer 8 or above to the last question, what do you need in these CPC products that is currently missing from CPC products? Open text answer
2.2.5 On a scale from 1 to 10, where 1 is Poor and 10 is Excellent, how would you rate these CPC products’…
a. Clarity
b. Presentation
c. Provided information
2.2.6 Using a 1 to 10 scale, where 1 means Not Likely and 10 means Very Likely, how likely are you to make or change a decision based on the information in these CPC products?
Extended range (6-10 day or 8-14 day forecasts)
2.3.1 Please select all individual Extended Range products that you use:
a. 6-10 day forecasts
b. 8-14 day forecasts
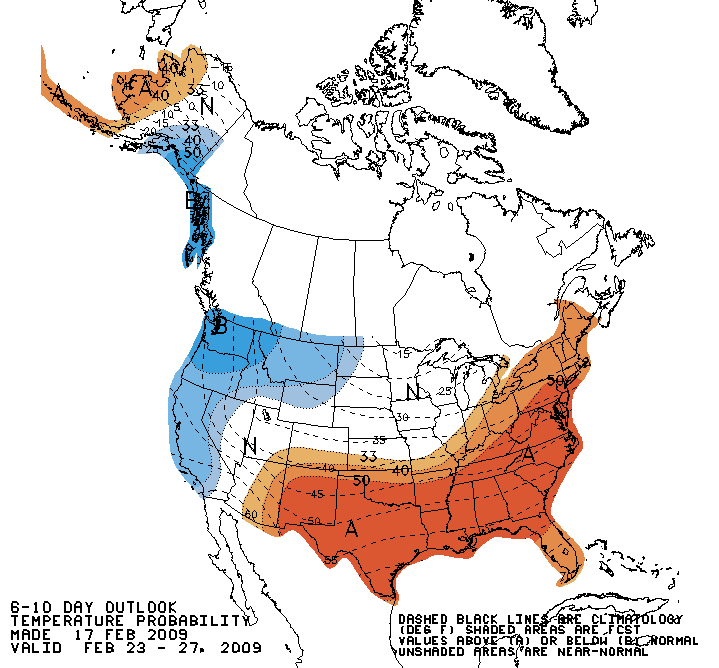
c. Temperature graphic (as shown above)
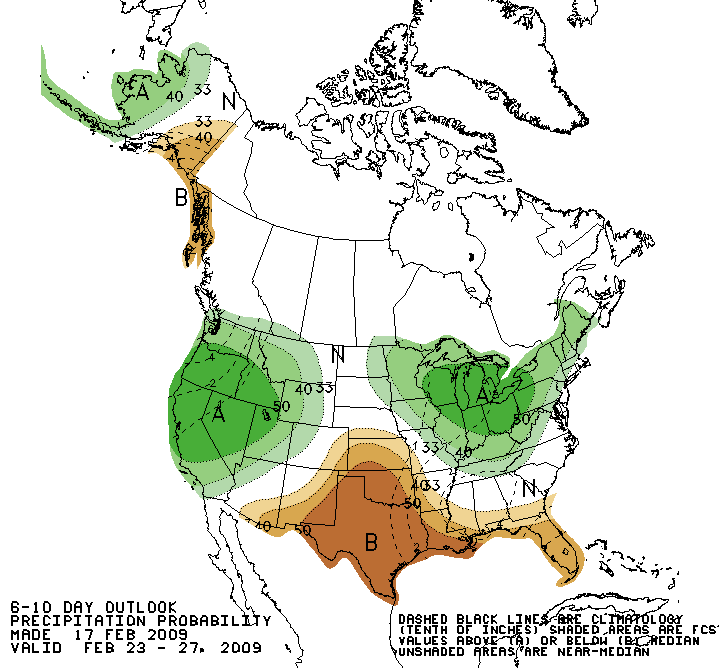
d. Precipitation graphic (as shown above)
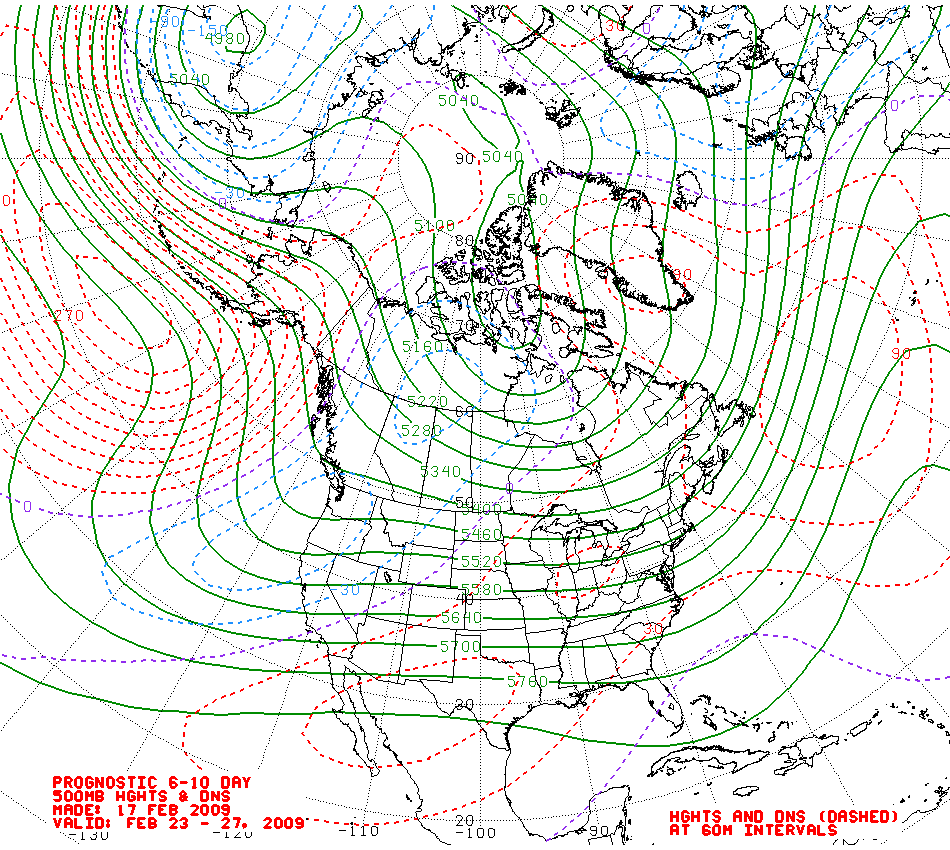
e. Official height graphic (as shown above)
PROGNOSTIC DISCUSSION FOR 6 TO 10 AND 8 TO 14 DAY OUTLOOKS
NWS CLIMATE PREDICTION CENTER CAMP SPRINGS, MD
300 PM EST TUE FEB 17 2009
6-10 DAY OUTLOOK FOR FEB 23 - 27 2009
TODAYS ENSEMBLE MEAN FORECASTS ARE IN GOOD AGREEMENT …
8-14 DAY OUTLOOK FOR FEB 25 - MAR 03, 2009 …
f. Text discussion (as shown above)
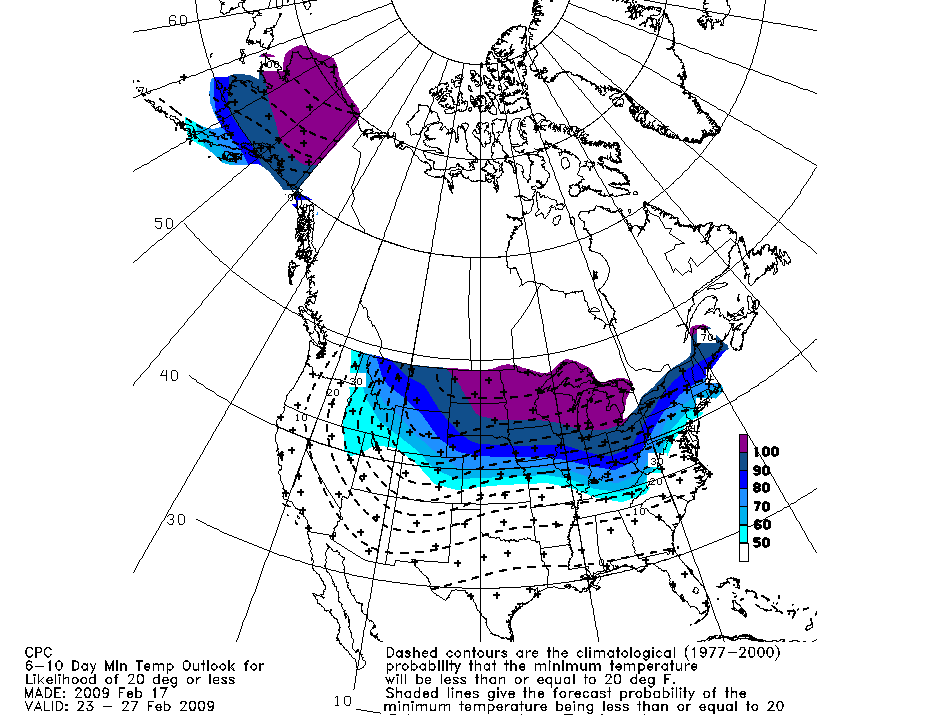
g. Automated Wind chill or Heat index graphics (as shown above)
2.3.2 How frequently do you use an Extended Range (6-10 day or 8-14 day forecasts) product?
a. Infrequently, but I have used it.
b. Occasionally
c. Frequently
d. Very frequently, but not always
e. Nearly every time it is released
2.3.3 Using a 1 to 10 scale where 1 means Very Dissatisfied and 10 means Very Satisfied, how satisfied overall are you with Extended Range products?
2.3.4a Using a 1 to 10 scale where 1 means Poor and 10 means Excellent, how well do Extended Range products meet your needs for this type of climate information?
2.3.4b If you did not answer 8 or above to the last question, what do you need in Extended Range forecast products that is currently missing from CPC products? Open text answer
2.3.5 On a scale from 1 to 10, where 1 is Poor and 10 is Excellent, how would you rate Extended Range products…
a. Clarity
b. Presentation
c. Provided information
2.3.6 Using a 1 to 10 scale, where 1 means Not Likely and 10 means Very Likely, how likely are you to make or change a decision based on the information in Extended Range products?
Long range (monthly and seasonal forecasts)
2.4.1 Please select all individual Long Range products that you use:
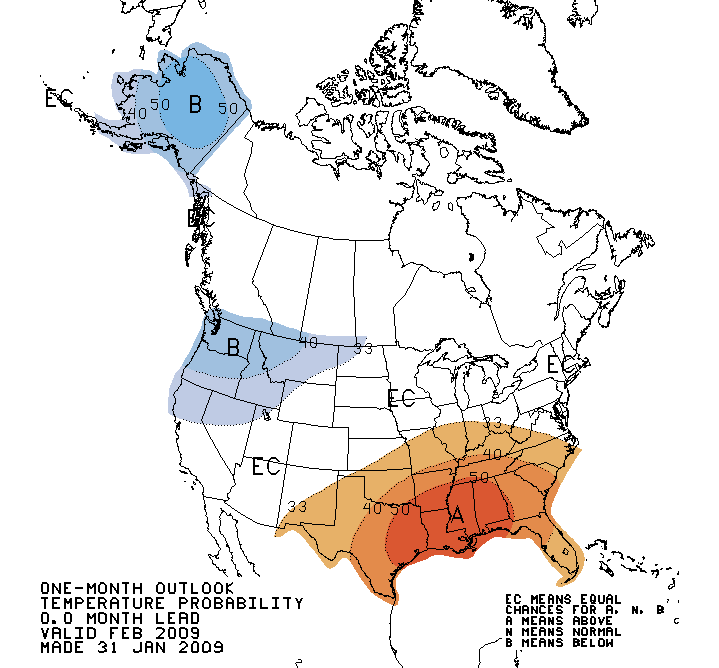
a. Monthly Temperature forecast (as shown above)
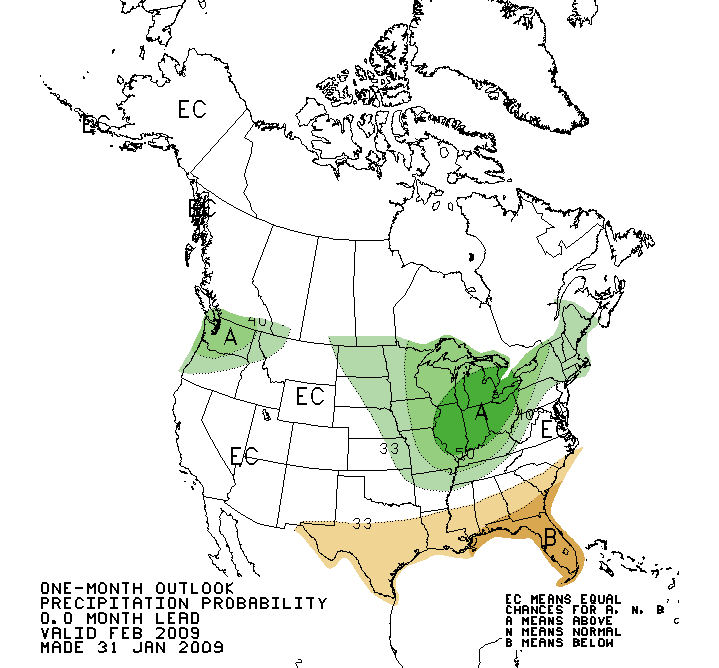
b. Monthly Precipitation forecast (as shown above)

c. Seasonal Temperature forecasts (as shown above)
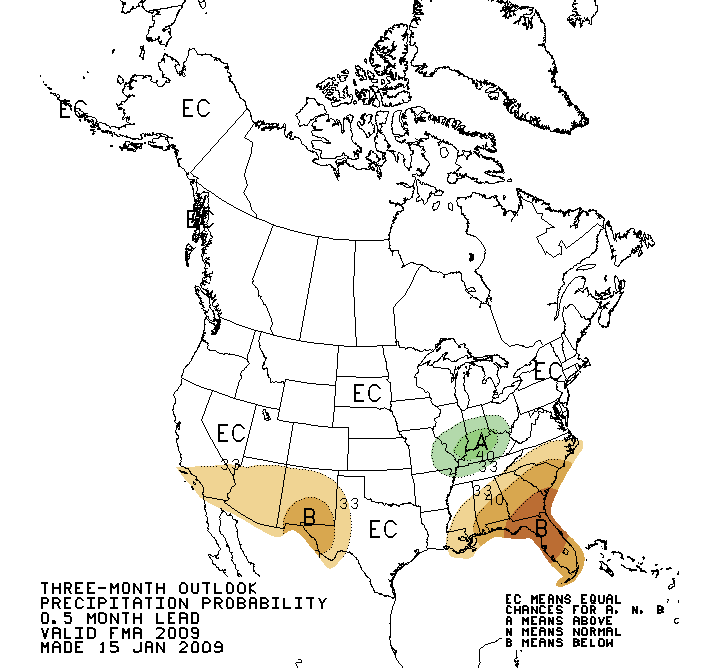
d. Seasonal Precipitation forecasts (as shown above)
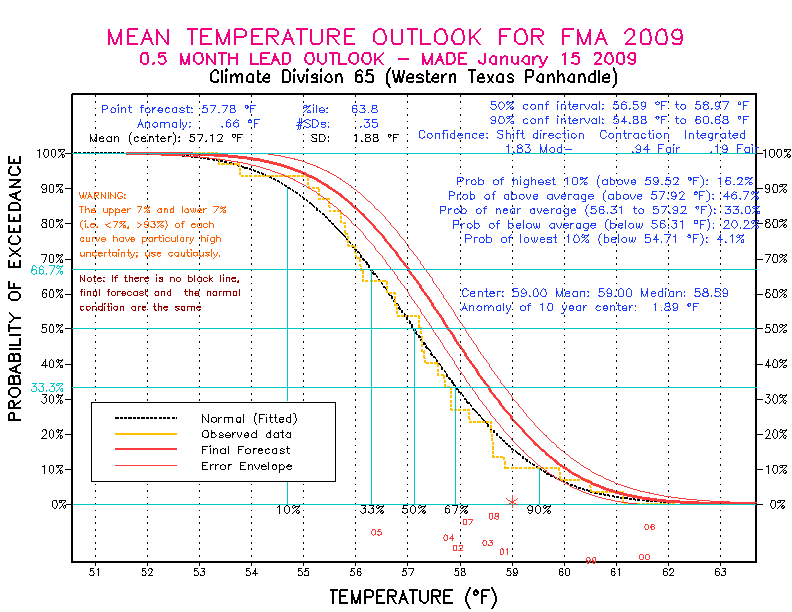
e. Seasonal Local Probability of Exceedence Information (as shown above)
2.4.2 How frequently do you use a Long Range (monthly or seasonal forecasts) product?
a. Infrequently, but I have used it.
b. Occasionally
c. Frequently
d. Very frequently, but not always
e. Nearly every time it is released
2.4.3 Using a 1 to 10 scale where 1 means Very Dissatisfied and 10 means Very Satisfied, how satisfied overall are you with Long Range products?
2.4.4a Using a 1 to 10 scale where 1 means Poor and 10 means Excellent, how well do Long Range products meet your needs for this type of climate information?
2.4.4b If you did not answer 8 or above to the last question, what do you need in Long Range forecast products that is currently missing from CPC products? Open text answer
2.4.5 On a scale from 1 to 10, where 1 is Poor and 10 is Excellent, how would you rate Long Range products…
a. Clarity
b. Presentation
c. Provided information
2.4.6 Using a 1 to 10 scale, where 1 means Not Likely and 10 means Very Likely, how likely are you to make or change a decision based on the information in Long Range products?
Hazards (US or Global)
2.5.1 Please select all individual Hazards products that you use:
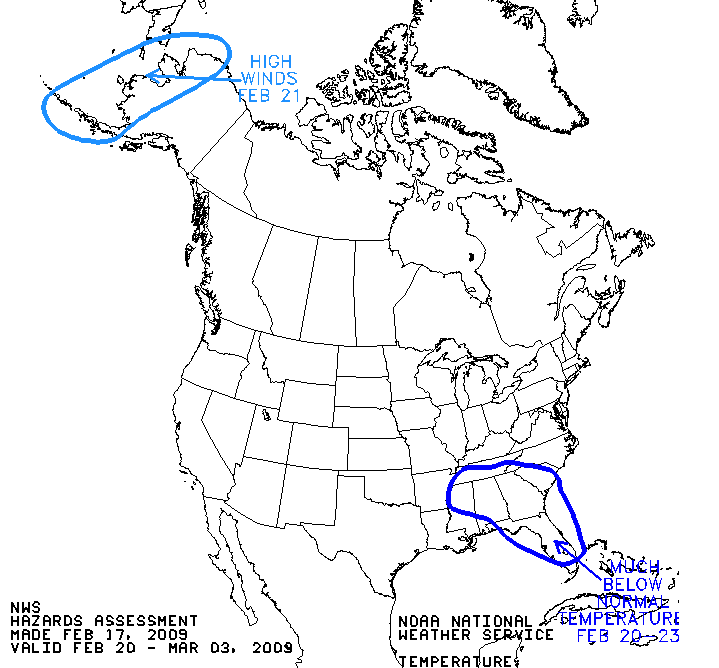
a. US temperature and wind hazards (as shown above)
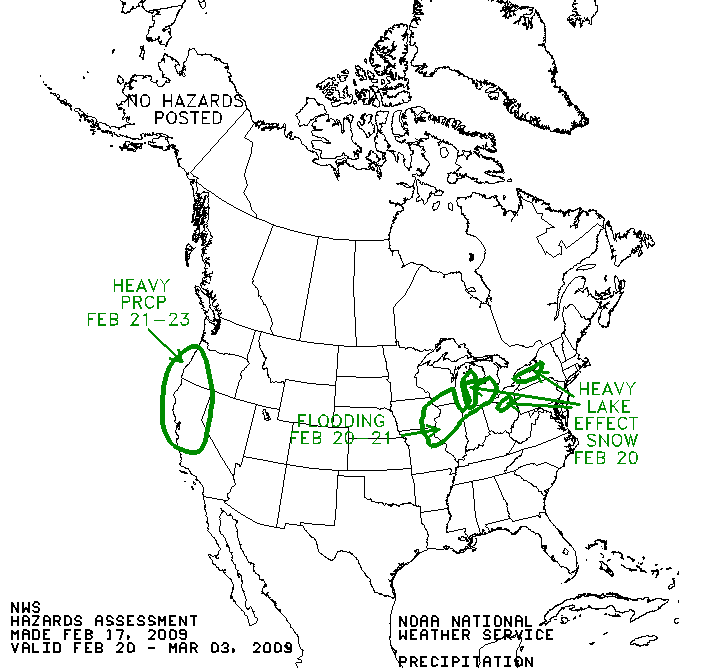
b. US precipitation hazards (as shown above)
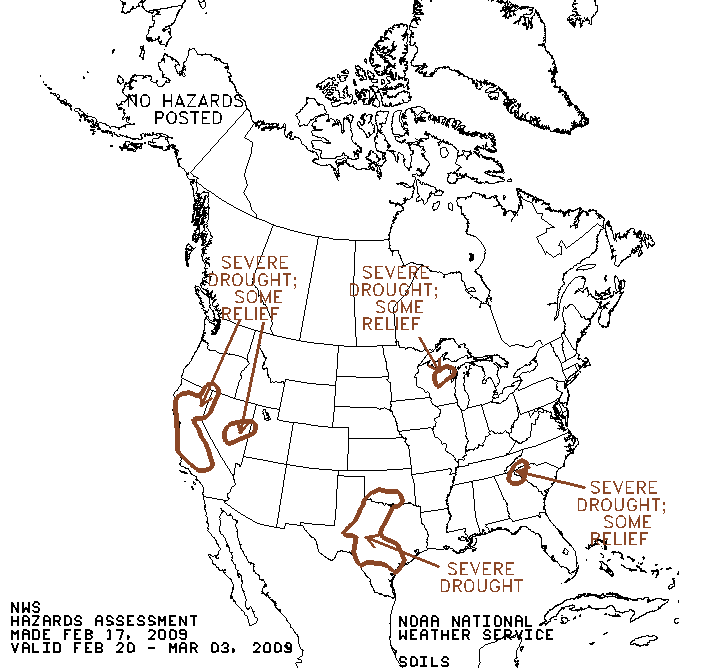
c. US drought and wildfire hazards (as shown above)
US
HAZARDS ASSESSMENT
NWS CLIMATE PREDICTION CENTER CAMP SPRINGS
MD
300 PM EST FEBRUARY 17 2009
SYNOPSIS: A STRONG AREA OF LOW PRESSURE IS EXPECTED TO MOVE …
d. US hazards assessment text (as shown above)
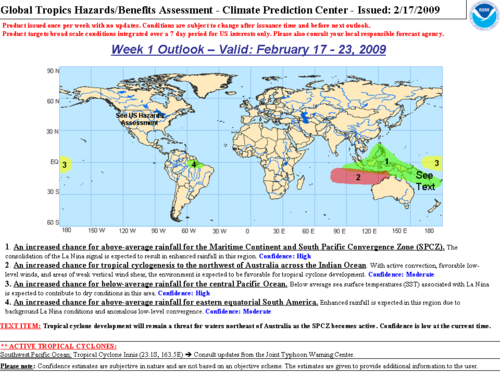
e. Global tropics benefits/hazards assessment graphic and text (as shown above)
2.5.2 How frequently do you use a Hazards (US or Global) product?
a. Infrequently, but I have used it.
b. Occasionally
c. Frequently
d. Very frequently, but not always
e. Nearly every time it is released
2.5.3 Using a 1 to 10 scale where 1 means Very Dissatisfied and 10 means Very Satisfied, how satisfied overall are you with Hazards product?
2.5.4a Using a 1 to 10 scale where 1 means Poor and 10 means Excellent, how well do Hazards products meet your needs for this type of climate information?
2.5.4b If you did not answer 8 or above to the last question, what do you need in Hazards products that is currently missing from CPC products? Open text answer
2.5.5 On a scale from 1 to 10, where 1 is Poor and 10 is Excellent, how would you rate Hazards products…
a. Clarity
b. Presentation
c. Provided information
2.5.6 Using a 1 to 10 scale, where 1 means Not Likely and 10 means Very Likely, how likely are you to make or change a decision based on the information in Hazards products?
ENSO
2.6.1 Please select all individual ENSO products that you use:
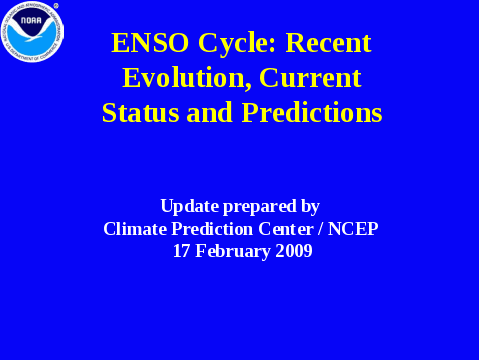
a. Weekly Update (as shown above)
EL NIÑO/SOUTHERN OSCILLATION (ENSO) DIAGNOSTIC DISCUSSION
issued
by
CLIMATE PREDICTION CENTER/NCEP
5 February 2009
b. Monthly ENSO discussion (as shown above)
2.6.2 How frequenty do you use an ENSO product?
a. Infrequently, but I have used it.
b. Occasionally
c. Frequently
d. Very frequently, but not always
e. Nearly every time it is released
2.6.3 Using a 1 to 10 scale where 1 means Very Dissatisfied and 10 means Very Satisfied, how satisfied overall are you with ENSO products?
2.6.4a Using a 1 to 10 scale where 1 means Poor and 10 means Excellent, how well do ENSO products meet your needs for this type of climate information?
2.6.4b If you did not answer 8 or above to the last question, what do you need in ENSO products that is currently missing from CPC products? Open text answer
2.6.5 On a scale from 1 to 10, where 1 is Poor and 10 is Excellent, how would you rate ENSO products…
a. Clarity
b. Presentation
c. Provided information
2.6.6 Using a 1 to 10 scale, where 1 means Not Likely and 10 means Very Likely, how likely are you to make or change a decision based on the information in ENSO products?
Drought (Monitor or Outlook)
2.7.1 Please select all individual Drought products that you use:
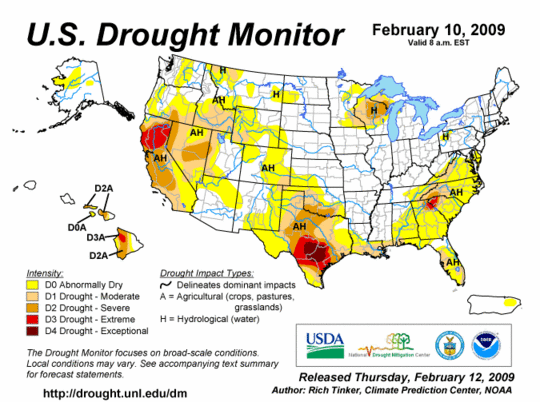
a. Monitor graphic (as shown above)
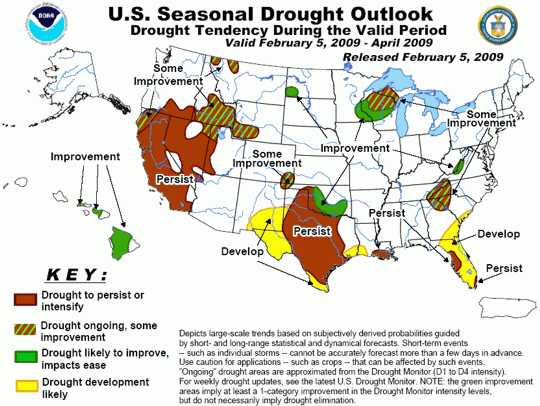
b. Outlook graphic (as shown above)
Latest Seasonal Assessment - The drought over the southern Great Plains has expanded westward in recent weeks …
c. Drought assessment text (as shown above)
2.7.2 How frequently do you use a Drought product?
a. Infrequently, but I have used it.
b. Occasionally
c. Frequently
d. Very frequently, but not always
e. Nearly every time it is released
2.7.3 Using a 1 to 10 scale where 1 means Very Dissatisfied and 10 means Very Satisfied, how satisfied overall are you with Drought products?
2.7.4a Using a 1 to 10 scale where 1 means Poor and 10 means Excellent, how well do Drought products meet your needs for this type of climate information?
2.7.4b If you did not answer 8 or above to the last question, what do you need in Drought products that is currently missing from CPC products? Open text answer
2.7.5 On a scale from 1 to 10, where 1 is Poor and 10 is Excellent, how would you rate Drought products…
a. Clarity
b. Presentation
c. Provided information
2.7.6 Using a 1 to 10 scale, where 1 means Not Likely and 10 means Very Likely, how likely are you to make or change a decision based on the information in Drought products?
Overall evaluation of Climate Prediction Center (CPC) climate services
2.8.1 Accuracy is defined as the frequency that information is correct, and reliability is defined as correctly stating the likelihood of something occurring. Using a 1 to 10 scale, when 1 means Inaccurate and Unreliable and 10 means Very Accurate and Completely Reliable, please rate CPC climate information?
2.8.2 On a 1-10 scale where 1 means Poor and 10 means Excellent, how well does CPC meet your climate services needs?
2.8.3 To help us develop our decision support capabilities, please tell us what decisions you make based on CPC products? (open-ended question)
2.8.4 Do you contact CPC staff if you need additional climate information or help with CPC products and services?
a. Yes
b. No
2.8.5 This is the end of the first section for CPC Climate Services. Would you like to continue to the remaining CPC Climate Services questions?
a. Yes
b. No (Skip to Part 3)
OPTIONAL questions on CPC climate services
2.9 What do you see as the most important area of climate prediction research?
a. Climate-weather interaction
b. Weekly and seasonal climate variability
c. Climate change and associated changes in climate and weather variability
d. Global warming impacts
e. Global impacts of tropical variability, such as El Nino and La Nina
f. Extreme weather event prediction
g. Water or other resource sustainability
h. Sea-level change and coastal inundation
i. Ecosystem sustainability
j. Tropical storm and hurricane prediction
Forecast presentation (categories and classes)
2.10 NWS 3-Month Outlooks use an Equal Chance (EC) forecast category to define the forecast case when there is no basis for altering the odds from historical frequencies. Please select the best approach for explaining this category from the list below.
a. Equal Chances (EC)
b. Indeterminate Forecast
c. Use past data records for your specific needs
d. Other (please specify)
2.11 NWS 3-Month Outlooks are 3 class probabilistic outlooks. The classes are defined by 1971-2000 climatological tercile limits using the following: Below Normal, Near Normal and Above Normal. Use of the word “Normal” in this context is (1) technically incorrect: Normal implies Normal Distribution features and properties; and, (2) leads to misinterpretation that Near Normal is the most frequently occurring class.
Which of the following names for tercile classes would you give Temperature classes?
a. Feeling Associations: Cool, Neutral, Warm
b. Computations: Lower Tercile, Middle Tercile, Upper Tercile
c. Statistic in the middle Tercile: Below Median*, Near Median, Above Median
d. Climate Variable Measurement Scale: Less than 50 degrees F, Between 50 degrees F and 65 degrees F, Greater than 65 degrees F
e. Other, please specify
*Median is a middle value in the climate records: half of the records (50%) were greater than the value of Median and half of the records (50%) were less than this value
Which of the following names for tercile classes would you give Precipitation classes?
a. Feeling Associations; Dry, Neutral, Wet
b. Computations: Lower Tercile, Middle Tercile, Upper Tercile
c. Statistic in the middle Tercile: Below Median, Near Median, Above Median
d. Climate Variable Measurement Scale: Less than 2”, Between 2” and 7”, and Greater than 7”
e. Other, please specify
Current or future Climate Prediction Center (CPC) climate products
Data and Models
2.12 Do you use or have an interest in datasets used by CPC?
a. Yes
b. No
2.13 If so, please state which datasets. Open text answer
2.14 Would a Model Test Facility that provides users with the Climate Forecast System (CFS) Model, the related datasets, documentation, and technical support be useful to you?
a. Yes
b. No
Probabilistic Products (Hazards)
2.15 A statement can be made when the probability of an unlikely extreme event exceeds the event's observed climatological frequency. Would information about the probability of various extreme weather or climate events, given the current climate state, be useful to you?
a. Yes
b. No
2.16 For this question, an extreme event is defined as an event that has occurred less than 5% of the time in the observed climate of recent decades. Using a 1-10 scale where 1 means Not Likely and 10 means Very Likely, please rate the likelihood that you would use a prediction that an extreme event is expected to occur in a stated period with the following probability:
a. 5%
b. 10%
c. 20%
d. 50%
Conveying the certainty of forecasts
2.17 Expert assessment products from CPC generally contain a subjective statement of the likelihood of occurrence of climate events but do not state a numerical probability of occurrence.
Would a percentage probability of occurrence for various climate events make climate assessment products more useful to you?
a. Yes
b. No
2.18 Please list any CPC products for which percentage probabilities are not currently provided, but for which you feel probabilities would be useful. Open text answer
Verification
2.19 On a 1-10 scale where 1 means Not Likely and 10 means Very Likely, how likely is it that information on the accuracy of climate predictions would help you make or change a decision?
2.20 A new Forecast Evaluation Tool is being developed for evaluation of forecasts against the corresponding observations covering the forecast period.
Would you use a web page designed to allow you to make measures of forecast accuracy for your choice of time periods and regions?
a. Yes
b. No
Automated products
2.21 It is possible to provide more climate information that is not directly created by a forecaster but is automatically generated from dynamical model output. On a 1-10 point scale where 1 means Not Likely and 10 means Very Likely, how likely are you to use an automated product?
2.22 On a 1-10 scale where 1 means Not Likely and 10 means Very Likely, how likely are you to use an automated product, if a forecaster checked the product for accuracy?
2.23 Do you have any additional comments? Open text answer
Part 3: NWS local climate data products
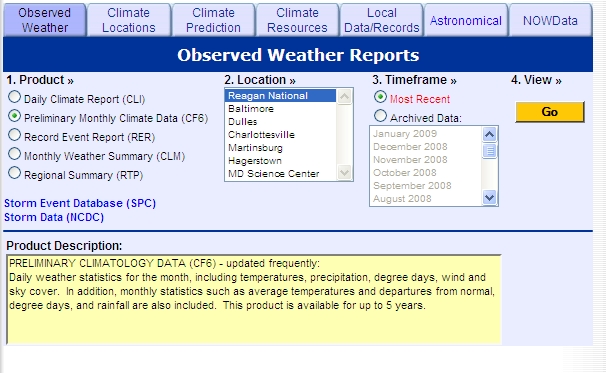
3.1 Look at the example above, which shows the NWS Local Climate Data Products available under the “Observed Weather” tab. Do you use any of these products?
a. Yes (Continue to 3.2.1)
b. No (go to Part 4)
CLI
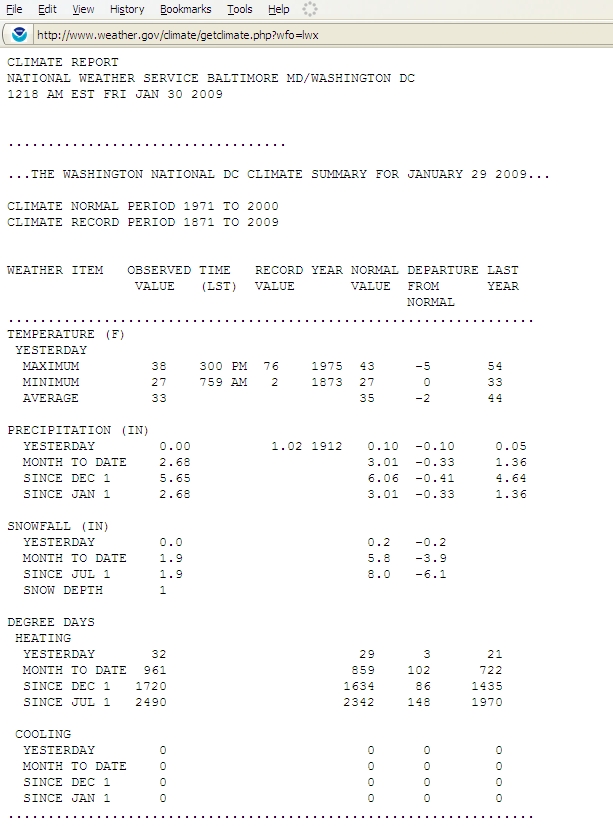
3.2.1 During the last 12 months, please indicate the frequency with which you have used Daily Climate Report (CLI).
a. Have not used it, but intend to use in the future
b. Infrequently, but I have used it.
c. Occasionally
d. Frequently
e. Do not use (skip to 3.3.1)
3.2.2 What are your primary reasons for accessing the Daily Climate Report (CLI)? A sample is shown above.
a. Casual browsing
b. Distributing to others
c. Decision-making
d. Research
e. Other (please specify)
3.2.3 Please think about the Daily Climate Report (CLI) that. On a 10 point scale, where 1 means Poor and 10 means Excellent, please rate the CLI on the following:
a. Clarity
b. Timeliness
c. Organization of information
d. Meets my needs
CLM
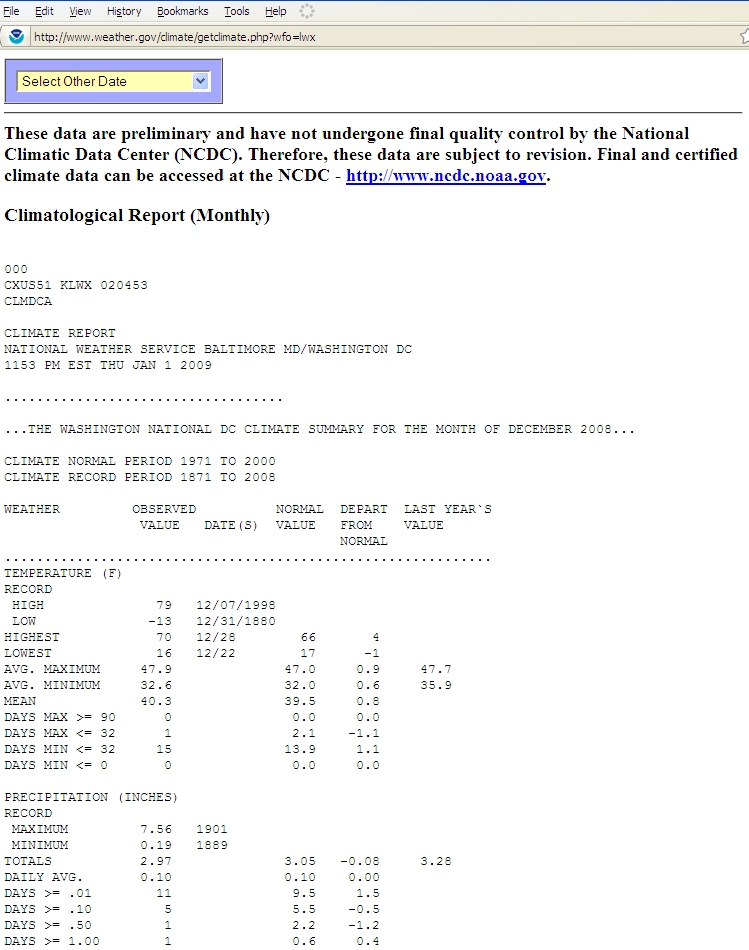
3.3.1 During the last 12 months, please indicate the frequency with which you have used Monthly Weather Summary (CLM).
a. Have not used it, but intend to use in the future
b. Infrequently, but I have used it.
c. Occasionally
d. Frequently
e. Do not use (skip to 3.4.1)
3.3.2 What are your primary reasons for accessing the Monthly Weather Summary (CLM)?
a. Casual browsing
b. Distributing to others
c. Decision-making
d. Research
e. Other (please specify)
3.3.3 Please think about the Monthly Weather Summary (CLM). On a 10 point scale, where 1 means Poor and 10 means Excellent, please rate the CLM on the following:
a. Clarity
b. Timeliness
c. Organization of information
d. Meets my needs
CF-6
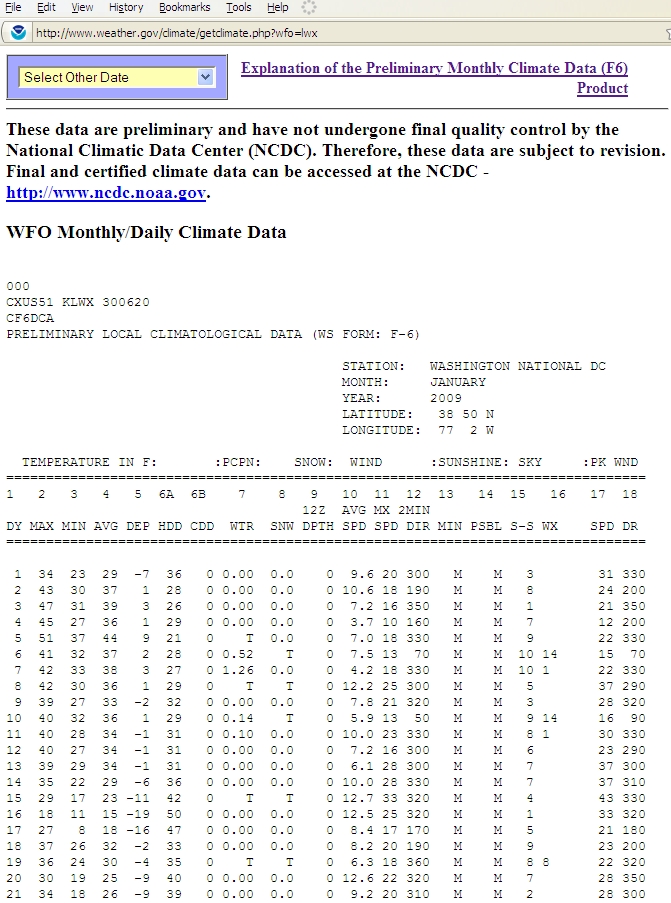
3.4.1 During the last 12 months, please indicate the frequency with which you have used Monthly Climate Data (CF-6).
a. Have not used it, but intend to use in the future
b. Infrequently, but I have used it.
c. Occasionally
d. Frequently
e. Do not use (skip to 3.5.1)
3.4.2 What are your primary reasons for accessing the Preliminary Monthly Climate Data (CF-6)?
a. Casual browsing
b. Distributing to others
c. Decision-making
d. Research
e. Other (please specify)
3.4.3 Please think about the Preliminary Monthly Climate Data (CF-6). On a 10 point scale, where 1 means Poor and 10 means Excellent, please rate the CF-6 on the following:
a. Clarity
b. Timeliness
c. Organization of information
d. Meets my needs
RER

3.5.1 During the last 12 months, please indicate the frequency with which you have used Record Event Report (RER).
a. Have not used it, but intend to use in the future
b. Infrequently, but I have used it.
c. Occasionally
d. Frequently
e. Do not use (skip to 3.6.1)
3.5.2 What are your primary reasons for accessing the Record Event Report (RER).
a. Casual browsing
b. Distributing to others
c. Decision-making
d. Research
e. Other (please specify)
3.5.3 Please think about the Record Event Report (RER). On a 10 point scale, where 1 means Poor and 10 means Excellent, please rate the RER on the following:
a. Clarity
b. Timeliness
c. Organization of information
d. Meets my needs
RTP
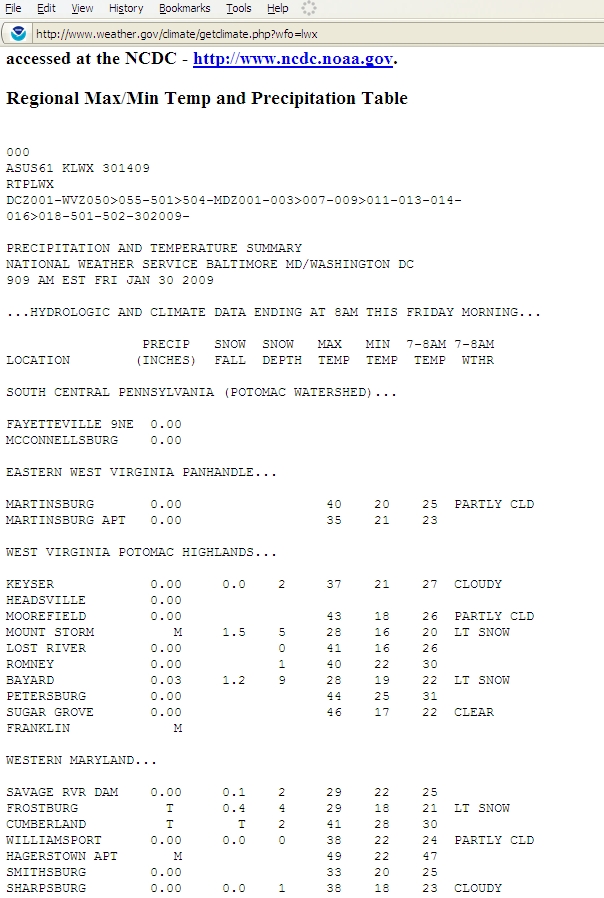
3.6.1 During the last 12 months, please indicate the frequency with which you have used Regional Summary (RTP).
a. Have not used it, but intend to use in the future
b. Infrequently, but I have used it.
c. Occasionally
d. Frequently
e. Do not use (skip to 3.7)
3.6.2 What are your primary reasons for accessing the Regional Summary (RTP).
a. Casual browsing
b. Distributing to others
c. Decision-making
d. Research
e. Other (please specify)
3.6.3 Please think about the Regional Summary (RTP). On a 10 point scale, where 1 means Poor and 10 means Excellent, please rate the RTP on the following:
a. Clarity
b. Timeliness
c. Organization of information
d. Meets my needs
3.7. Please comment on how you think the NWS can improve its climate data services to better serve your needs. (open-ended response)
NOWData

3.8.1 The image above shows the National Weather Service NOWData, an online tool that allows users to access recent climate data and statistics. First, on a scale from 1 to 5 where 1 is Never and 5 is Very Often, please indicate how frequently you use this interface to access and download climate data from each of the products available through NOWData? Second, from the choices available below, please indicate your primary reason (s) for accessing climate data through NOWData. Programming Note: Both questions to be asked within one table.
NOWData Products
a. Daily data for a month _____
b. Daily almanac ___________
c. Monthly avgs/totals________
d. Monthly occurrences ______
e. Monthly extremes ________
f. Daily extremes ___________
g. Daily/monthly normals _____
h. Record extremes _________
i. First/last dates ____________
Primary Reasons for Accessing Climate Data
1. Casual browsing
2. Distributing to others
3. Decision-making
4 Research
6. Other (please specify)
3.8.2 Please think about the interface utilized to access the climate data through NOWData. On a 10 point scale, where 1 means Poor and 10 means Excellent, please rate the following:
a. Easy to understand
b. Easy to use
c. Eye appealing
d. Meets my needs
3.8.3 Please think about the climate data provided through NOWData. On a 10 point scale, where 1 means Poor and 10 means Excellent, please rate the following:
a. Clarity
b. Timeliness
c. Organization of information
d. Product selection
e. Location selection
f. Variable selection
g. Length of data record
h. Meets my needs
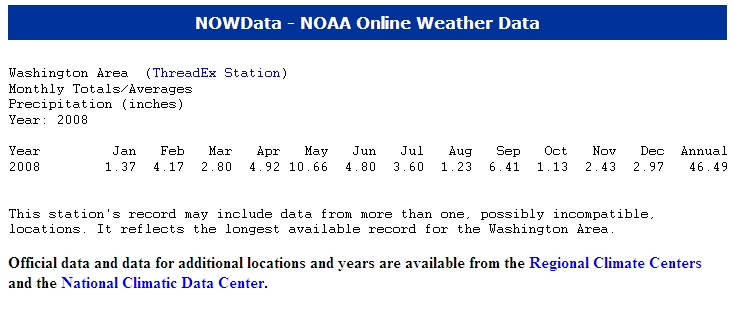
3.8.4 Please think about the format in which the data accessed from NOWData is displayed (see image above). On a 10 point scale, where 1 means Poor and 10 means Excellent, please rate the data display system on the following:
a. Clarity
b. Organization of information
c. Usefulness
d. Meets my needs
3.8.5 Considering future improvements to the NOWData tool and information, using a 1 to 10 point scale where 1 means Not at all Useful and 10 means Very Useful, please rate the usefulness of the following:
a. Navigational map interface
b. Additional product and data types
c. Multiple data formats (txt, csv, shp, kml, etc)
d. More locations
e. Longer period of data record
f. More user-defined functions (time period selection, query-options, etc.)
3.8.6 Using a 1 to 10 scale, where 1 means Not Very Likely and 10 means Very Likely, how likely are you to make or change a decision based on information from NOWdata products?
3.8.7
If you did not answer 8 or above to the last question, what is
missing from this tool that would help you to make or change a
decision? (Open-ended
question)
3.8.8 This is the end of the first section for Local Climate Data Products. Would you like to continue to the remaining Local Climate Data Products questions?
a. Yes
b. No (Skip to Part 4)
OPTIONAL Questions regarding NWS Local Climate Data Products
3.9 Using a 1 to 10 point scale where 1 means Not at all Useful and 10 means Very Useful, please rate the usefulness of receiving climate data information in the following formats (Include option 11=”Not familiar with this format”):.
a. Text
b. Graphics
c. A combination of text and graphics
d. Digital (numerical information that can be downloaded)
e. NOAA Weather Radio All Hazards
3.10 Digital information can be provided for a number of different purposes. Using a 1 to 10 point scale where 1 means Not at all Useful and 10 means Very Useful, please rate the usefulness of the following (Include option 11=”Not familiar with this format”):
a. Numerical information using standards-based formats (e.g., XML, NetCDF)
b. Information formatted geospatially for use with Geographic Information Systems (e.g. shapefiles)
c. RSS (Real Simple Syndication)
d. WAP (Wireless Application Protocol)
e. Metadata information
3.11 Considering information in geospatial formats, using a 1 to 10 point scale where 1 means Not at all Useful and 10 means Very Useful, please rate the usefulness of the following (Include option 11=”Not familiar with this format”):
a. Shapefile
b. Worldfile
c. KML/KMZ format
d. GeoPDF
e. Open Geospatial Consortium standards
3.12 Please comment on how you think the NWS can improve the overall climate data services program to better serve your needs. (open-ended response)
Part 4: NWS Local 3-month Temperature Outlook
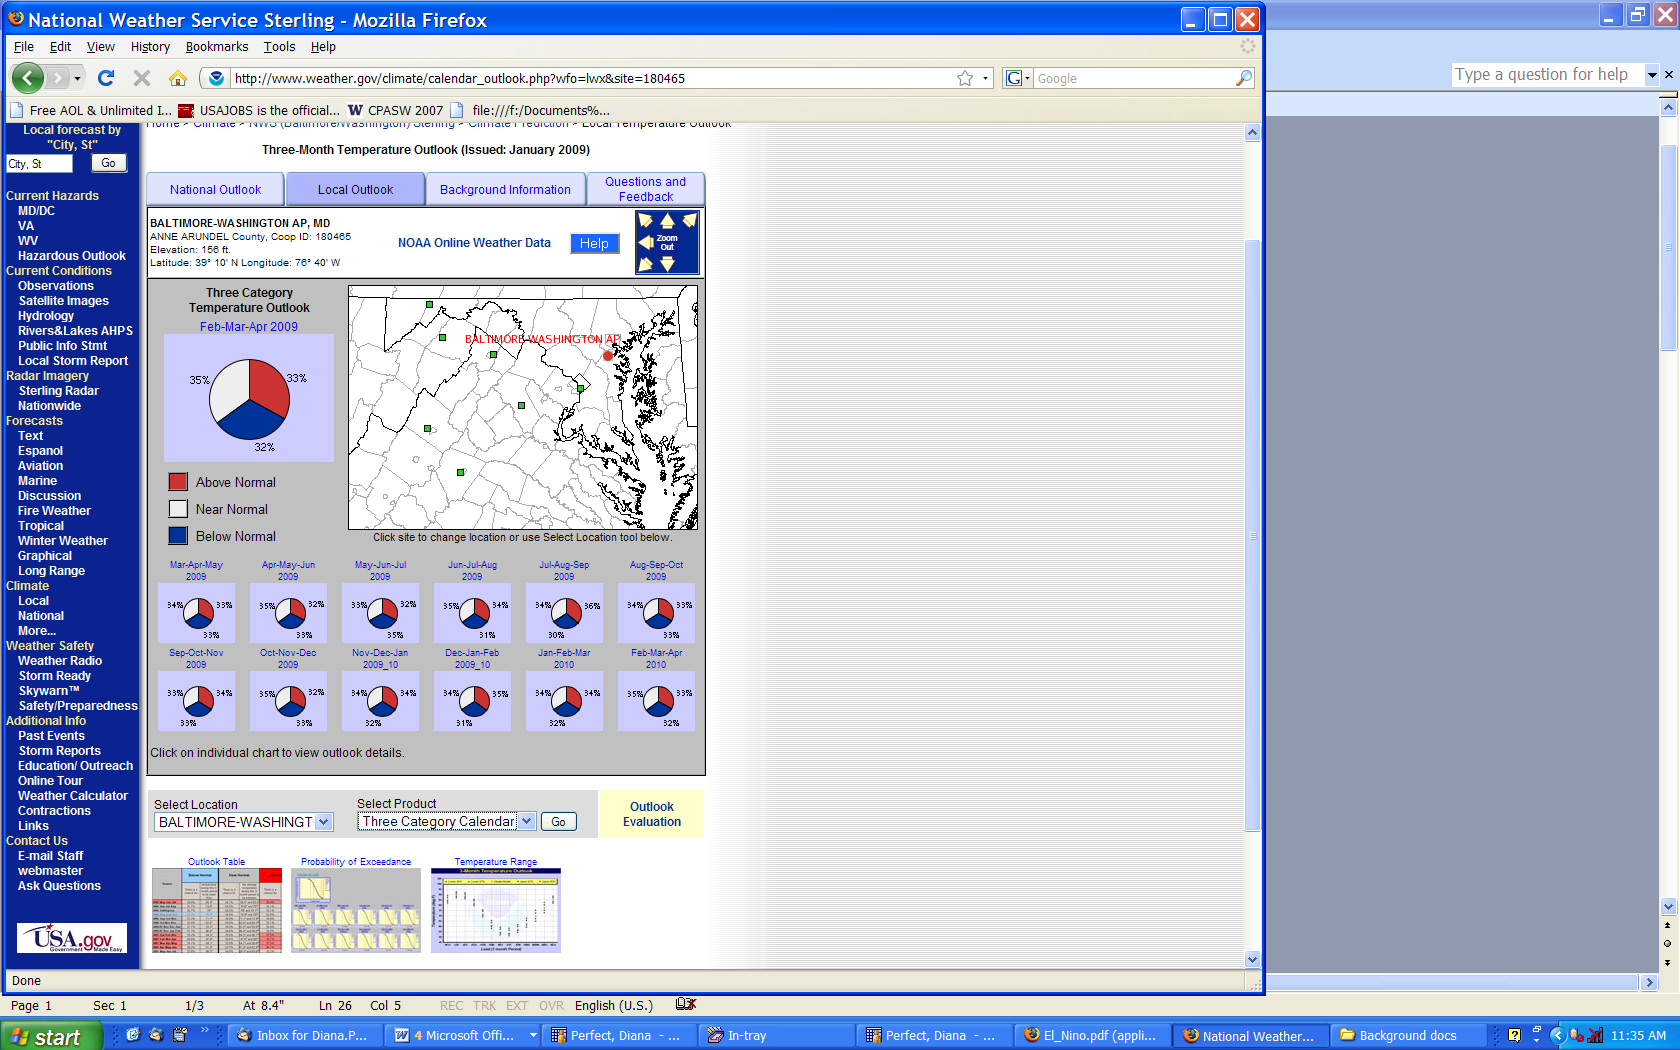
4.1 What is your primary reason for accessing the NWS Local 3-Month Temperature Outlook? A sample from the Washington D.C. area Outlook is shown above. If you do not use NWS Local 3-Month Temperature Outlook, please select "do not use". (select only one)
a. Casual browsing
b. Disseminating to others
c. Decision-making
d. Research
e. I am not familiar with this product/Do Not Use (Skip to end of survey)
f. Other (please specify)
4.2 Referring specifically to the functionality of the Local 3-Month Temperature Outlook, on a 10 point scale where 1 means Poor and 10 means Excellent please rate each of the following:
a. Station identifiers are consistent from page to page
b. All product components are present for all sites
c. All labels seem correct (i.e., correct axis labels, captions/titles make sense, etc…)
4.3 Referring specifically to the functionality of navigation of the Local 3-Month Temperature Outlook, on a 10 point scale where 1 means Poor and 10 means Excellent please rate each of the following:
a. Station search works correctly
b. Clickable areas work correctly
c. WFO CWA displayed correctly
d. Ability to navigate all sites in all methods offered
4.4 Referring specifically to comprehension of the Local 3-Month Temperature Outlook, on a 10 point scale where 1 means Poor and 10 means Excellent please rate each of the following:
a. The product layout is clear and logical
b. The product content is understandable
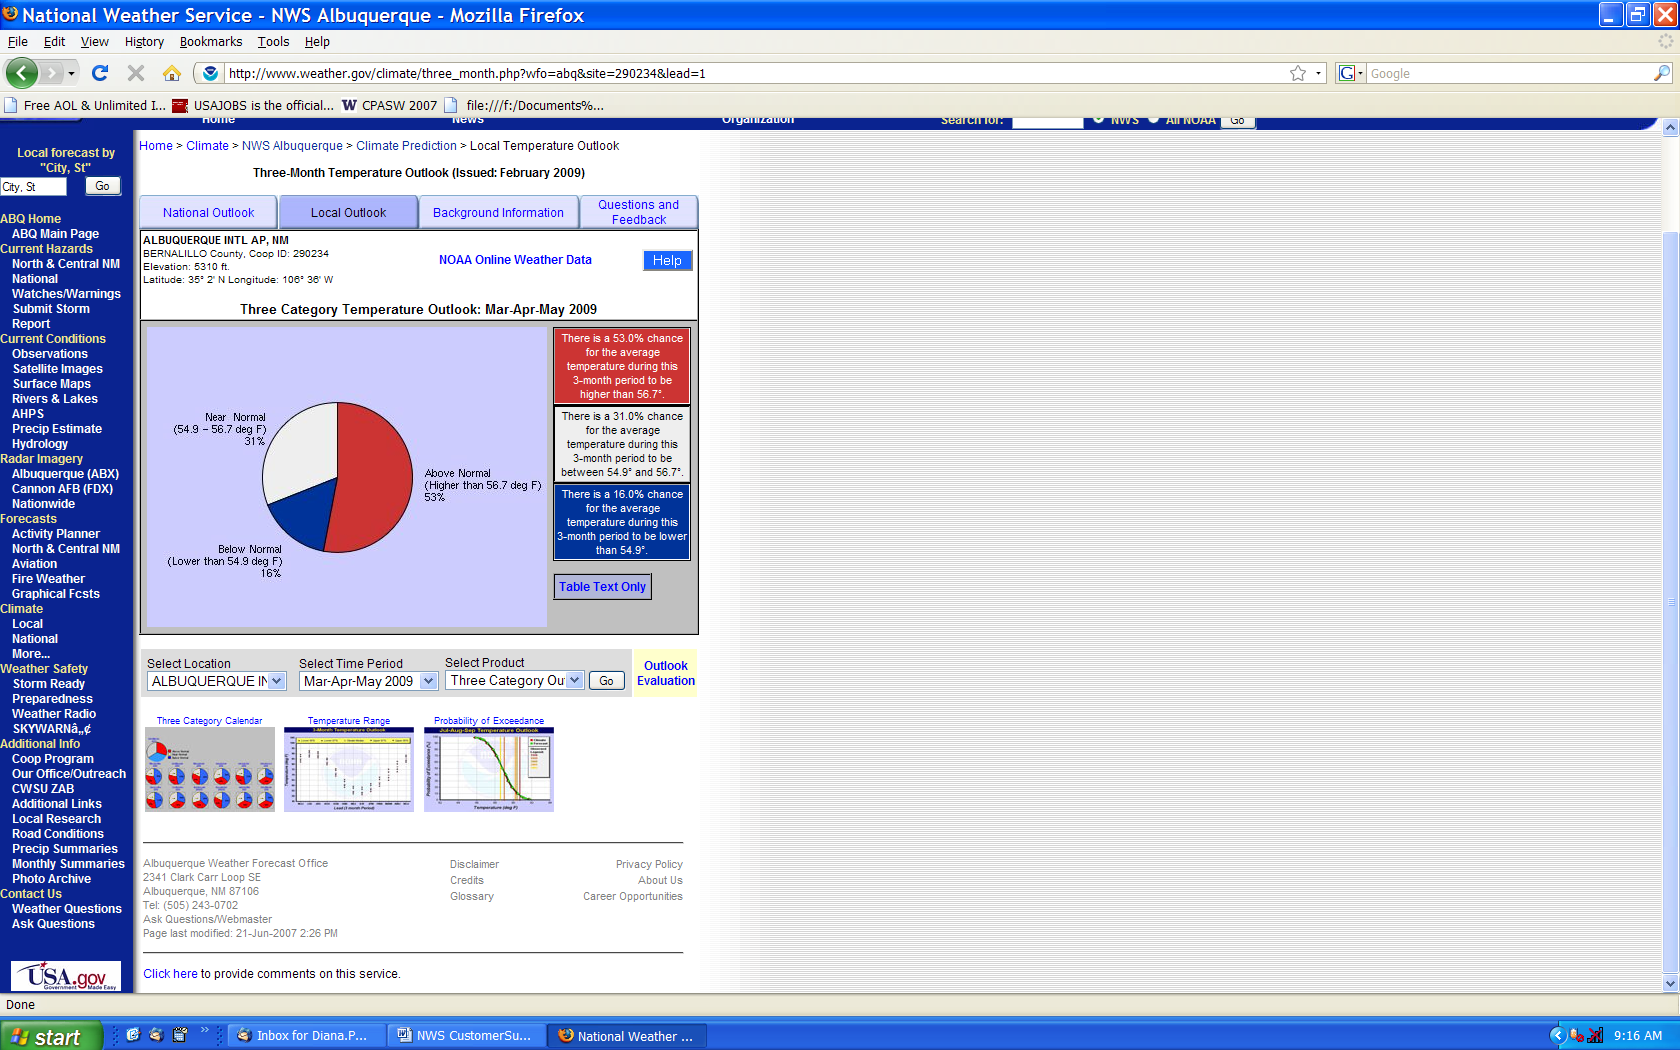
4.5 The graphic above shows the Local 3-Month Temperature Outlook, presented as a pie chart. How frequently do you use the product in this format?
a. Have not used it, but intend to use in the future
b. Infrequently, but I have used it.
c. Occasionally
d. Frequently, but not always
e. Nearly every time it is released
f. Do not use (skip to 4.8)
4.6 Using a 10 point scale where 1 means Poor and 10 means Excellent, please rate the above graphic on the following Information and Content Characteristics:
a. Completeness
b. Clarity
c. Usefulness
d. Clarity of terms and definitions
e. Text interpretations
4.7 Using a 10 point scale where 1 means Poor and 10 means Excellent, please rate the above graphic on the following Display and Graphical Features:
a. Tabs organization
b. Navigation functionality
c. Titles
d. Colors
e. Plot type
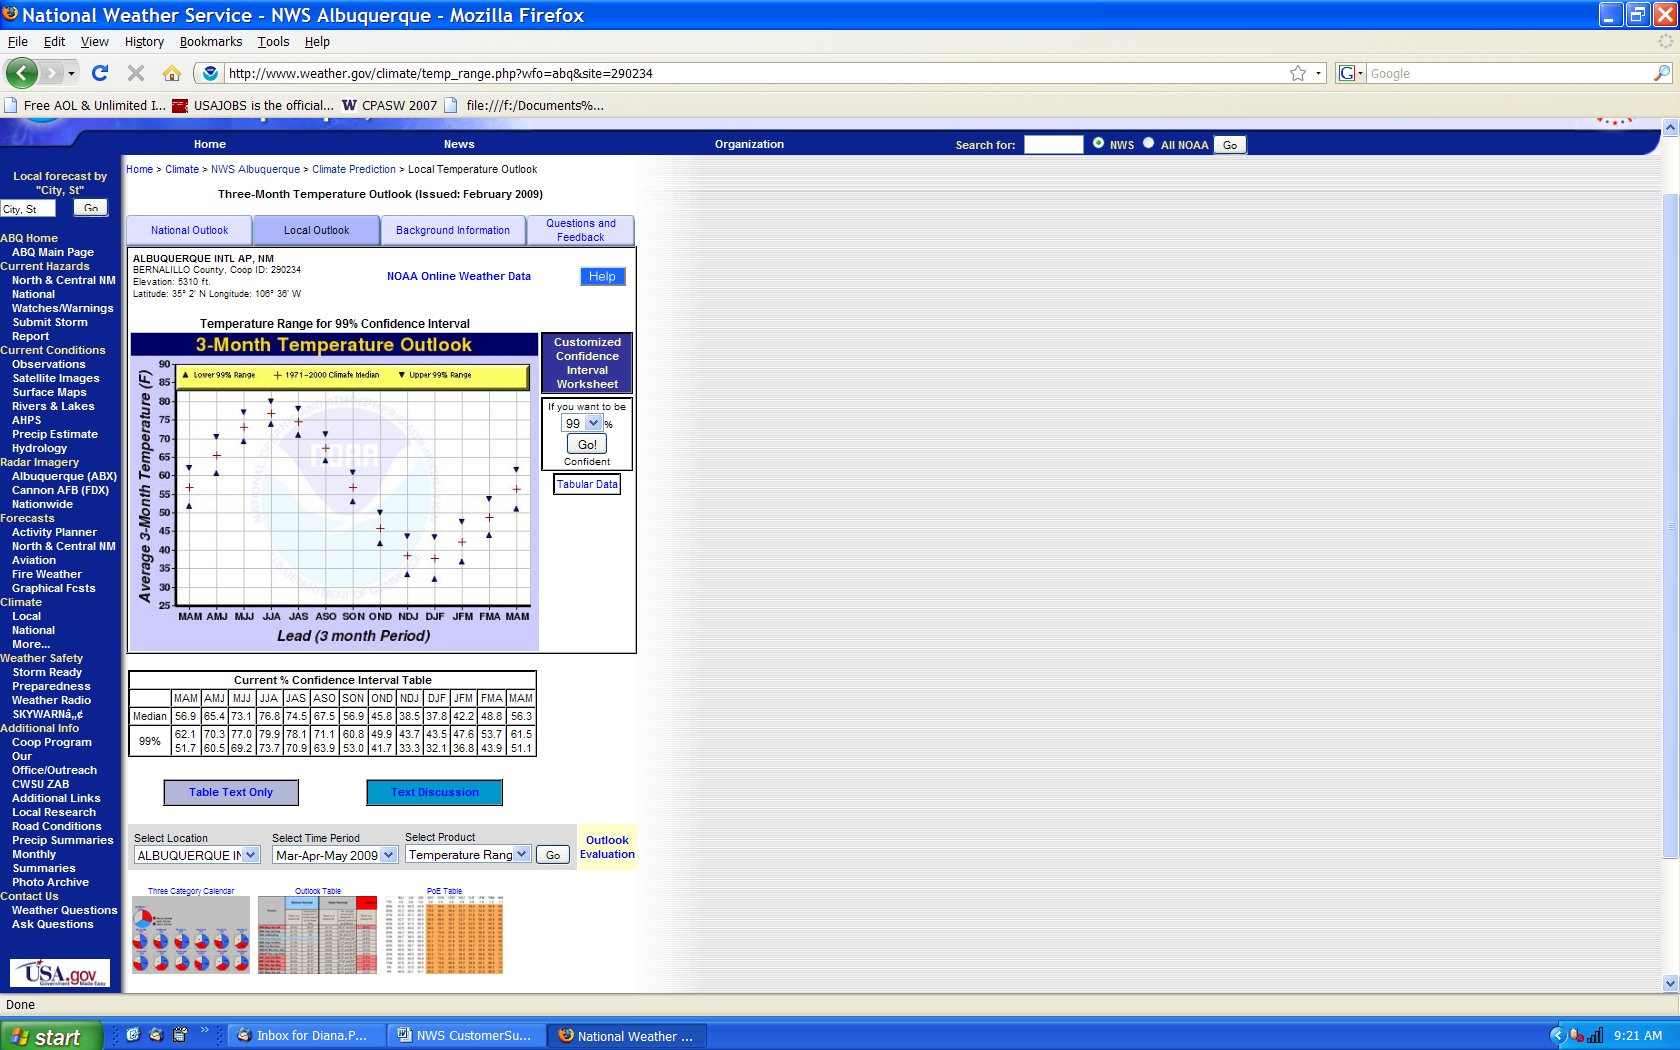
4.8 The graphic above shows the Local 3-Month Temperature Outlook, presented as Temperature Range for Selected Confidence Interval. How frequently do you use the product in this format?
a. Have not used it, but intend to use in the future
b. Infrequently, but I have used it.
c. Occasionally
d. Frequently, but not always
e. Nearly every time it is released
f. Do not use (skip to 4.11)
4.9 Using a 10 point scale where 1 means Poor and 10 means Excellent, please rate the above graphic on the following Information and Content Characteristics:
a. Completeness
b. Clarity
c. Usefulness
d. Clarity of terms and definitions
e. Text interpretations
4.10 Using a 10 point scale where 1 means Poor and 10 means Excellent, please rate the above graphic on the following Display and Graphical Features:
a. Tabs organization
b. Navigation functionality
c. Titles
d. Colors
e. Plot type
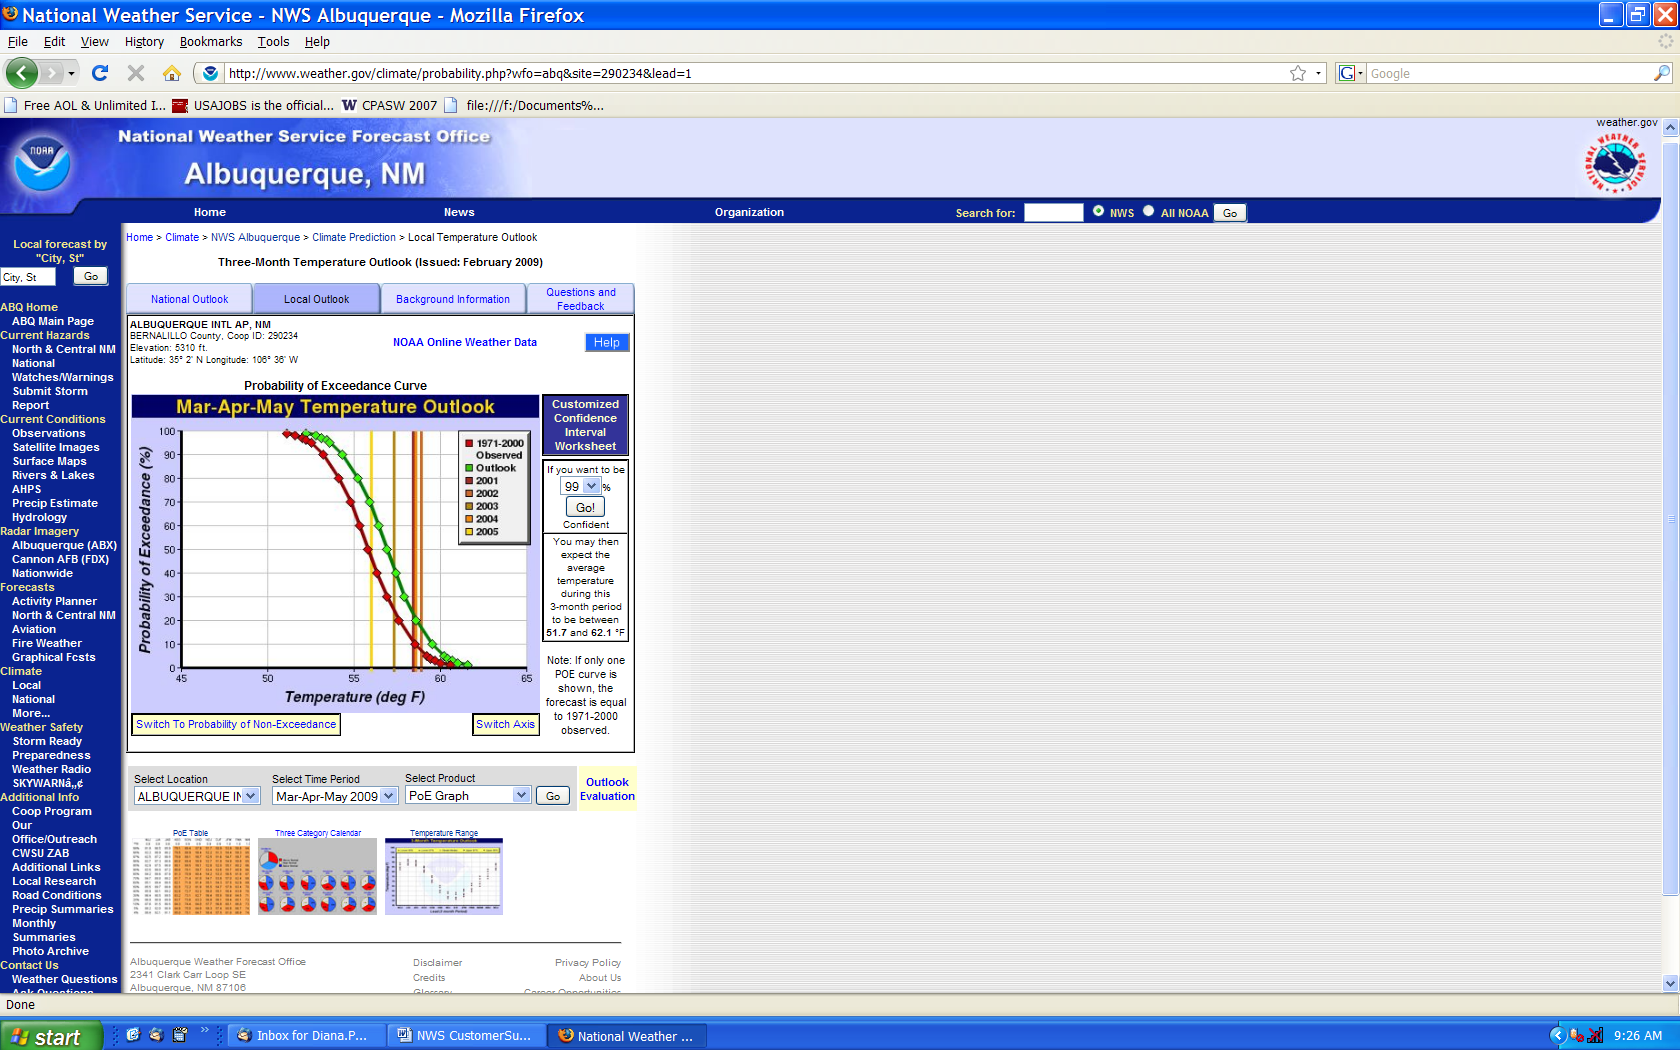

4.11 The graphic above shows the Local 3-Month Temperature Outlook, presented as a Probability of Exceedance/Non-Exceedance Curve. How frequently do you use the product in this format?
a. Have not used it, but intend to use in the future
b. Infrequently, but I have used it.
c. Occasionally
d. Frequently, but not always
e. Nearly every time it is released
f. Do not use (skip to 4.15)
4.12 Using a 10 point scale where 1 means Poor and 10 means Excellent, please rate the above graphic on the following Information and Content Characteristics:
a. Completeness
b. Clarity
c. Usefulness
d. Clarity of terms and definitions
e. Text interpretations
4.13 Using a 10 point scale where 1 means Poor and 10 means Excellent, please rate the above graphic on the following Display and Graphical Features:
a. Tabs organization
b. Navigation functionality
c. Titles
d. Colors
e. Plot type
4.14 Are there any comments you would like to provide NWS regarding the Information and Content characteristics and/or the Display and Graphical features of the Local 3-Month Temperature Outlook? (open-ended question)
4.15 This is the end of the first section for Local 3-Month Temperature Outlook. Would you like to continue to the remaining Local Outlook questions?
a. Yes
b. No (Skip to 5.0)
OPTIONAL questions related to NWS Local 3-Month Temperature Outlook
4.16 NWS provides the Local 3-Month Temperature Outlook for about 1500 locations in the US and has the capability to produce this product for additional sites. If you have suggestions for more locations, please specify municipality and state.
4.17 If NWS offered a Local 3-Month Precipitation Outlook, similar to the above Local 3-Month Temperature Outlook, would you find it useful for your needs?
a. Yes
b. No
4.19 If NWS offered a local climate change product displaying rate of change in different climate variables, such as temperature, precipitation, etc., would you find this useful for your needs?
a. Yes
b. No
4.20 If NWS offered a 3-Month Outlook of El Nino/La Nina impacts on local climate variables, such as temperature, precipitation, storminess, tornado occurrence, etc., would you find this useful for your needs?
a. Yes
b. No
Overall evaluation of NWS local climate services
5.0.1 On a 1-10 scale where 1 means Poor and 10 means Excellent, how well do NWS local climate products meet your climate services needs?
5.0.2 To help us develop our decision support capabilities, please tell us what decisions you make based on NWS local products? (open-ended question)
5.0.3 Do you contact regional or local staff if you need additional climate information or help with NWS climate products and services?
a. Yes
b. No
ACSI Benchmarks
Now, please think about your overall satisfaction with the NWS Climate Services program.
5.1 First, please consider all of your experiences with the NWS Climate Services program. Using a 10 point scale on which 1 means very dissatisfied and 10 means very satisfied, how satisfied are you with the NWS Climate Services program?
5.2 Considering all of the expectations that we have discussed, to what extent has the NWS Climate Services program fallen short of, or exceeded your expectations? Using a 10 point scale on which 1 now means falls short of your expectations and 10 means exceeds your expectations, to what extent has the NWS Climate Services program fallen short of, or exceeded your expectations?
5.3 Forget the NWS Climate Services program for a moment. Now, imagine an ideal climate service program. How well do you think the NWS Climate Services program compares with that ideal climate services program you just imagined? Please use a 10 point scale on which 1 means not very close to the ideal, and 10 means very close to the ideal.
Desired Outcomes
6.1 Have you ever formally contacted the National Weather Service to report a problem with regard to its climate products and services?
Yes
No (skip to Q6.3)
6.2 On a 10 point scale where 1 means poor and 10 means excellent, please rate the responsiveness of the NWS personnel to your problem.
6.3 Using a 10 point scale where 1 means not at all likely and 10 means very likely, how likely would you be to take action based on the climate information you receive from the National Weather Service?
Using a 10 point scale, on which 1 means not at all confident and 10 means very confident, how confident are you that the NWS Climate Services program will do a good job of assessing and forecasting the impacts of short-term climate variability, and emphasizing enhanced risks of weather-related extreme events in the future?
Concluding Questions
7.1 Please provide any additional comments on how the NWS Climate Services program can improve its current services to help you achieve your mission. (Open-ended response)
7.2 What types of additional services could the NWS Climate Services program provide for you to help you achieve your mission? (Open-ended response)
You have reached the end of the survey. Please click on the "Finish" button below to submit your survey.
The staff of the National Weather Service thanks you for your time and thoughtful feedback. Your input will be of great assistance as the agency works to improve its services.
| File Type | application/msword |
| File Title | Customer Survey |
| Author | Dr Dan C PhD |
| Last Modified By | RTate |
| File Modified | 2009-03-18 |
| File Created | 2009-03-17 |
© 2026 OMB.report | Privacy Policy