Questionnaire Design Research Laboratory - Surveillance Map Cognitive Testing
NCHS Questionnaire Design Research Laboratory
QDRL-OMB-10day surveillancef Maps 0108- Attach 1
Questionnaire Design Research Laboratory - Surveillance Map Cognitive Testing
OMB: 0920-0222
Attachment 1 – Maps to be cognitively tested and questionnaire
Public reporting burden for this collection of information is estimated to average 60 minutes per response, including the time for reviewing instructions, searching existing data sources, gathering and maintaining the data needed, and completing and reviewing the collection of information. An agency may not conduct or sponsor, and a person is not required to respond to, a collection of information unless it displays a currently valid OMB control number. Send comments regarding this burden estimate or any other aspect of this collection of information, including suggestions for reducing this burden, to CDC/ATSDR Reports Clearance Officer; 1600 Clifton Road, MS D-24, Atlanta, GA 30333, ATTN: PRA (0920-0222).
OMB #0920-0222; Expiration Date: 02/28/10
Note to reviewers: The maps used in testing will be labeled Version A or B only. The questionnaire following the choropleth and isopleth maps will be used as a tool to investigate and assess effectiveness of presenting BRFSS data in these two different formats.
Maps:
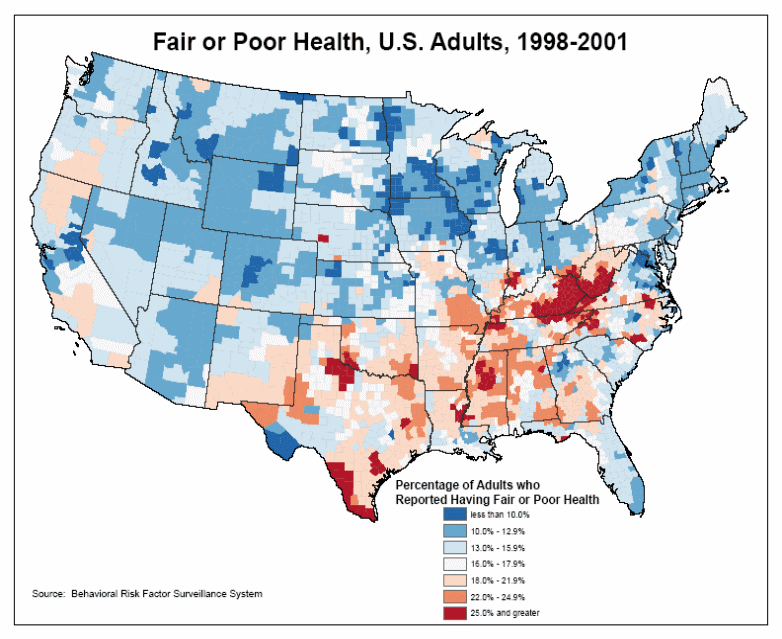
Version A, Choropleth Map
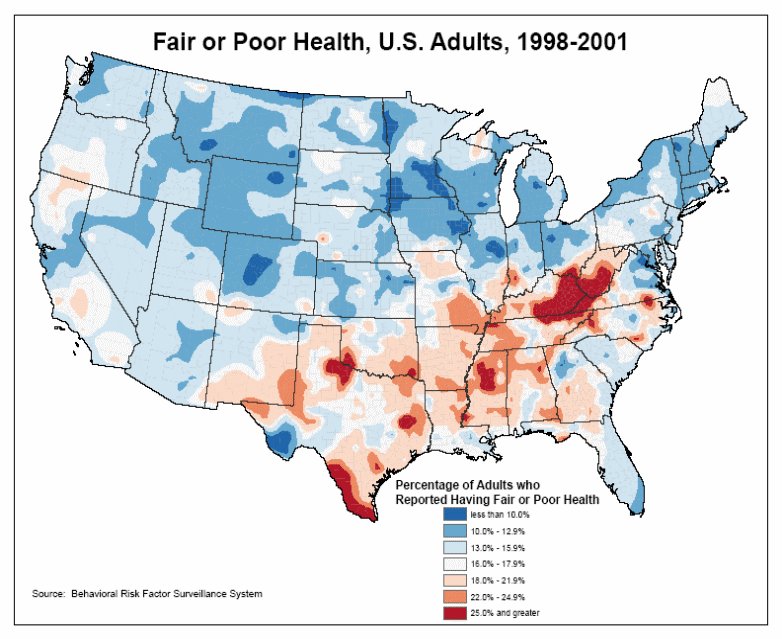
Version B, Isopleth Map
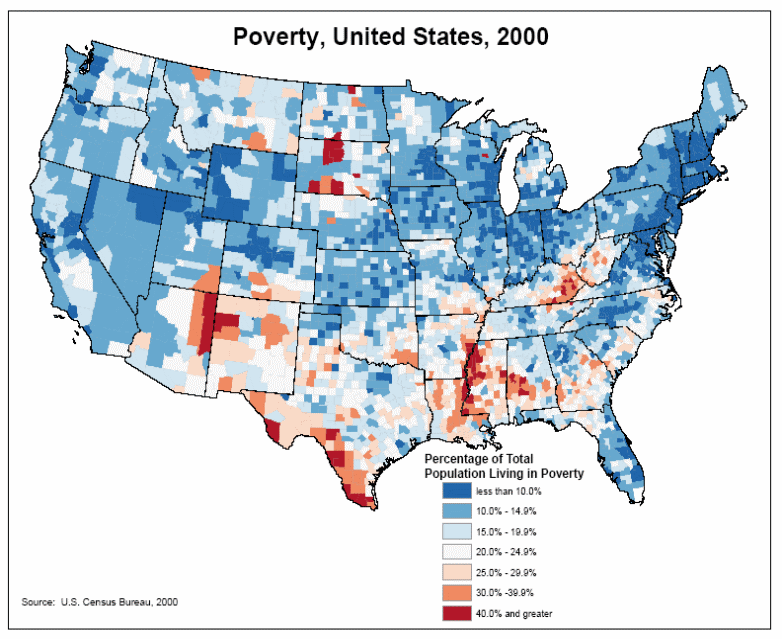
Version A, Choropleth Map
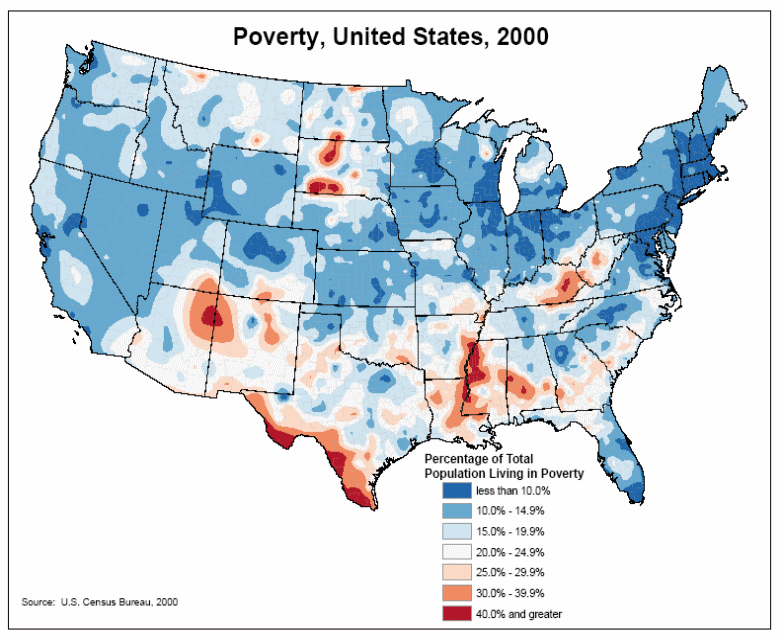
Version B, Isopleth Map
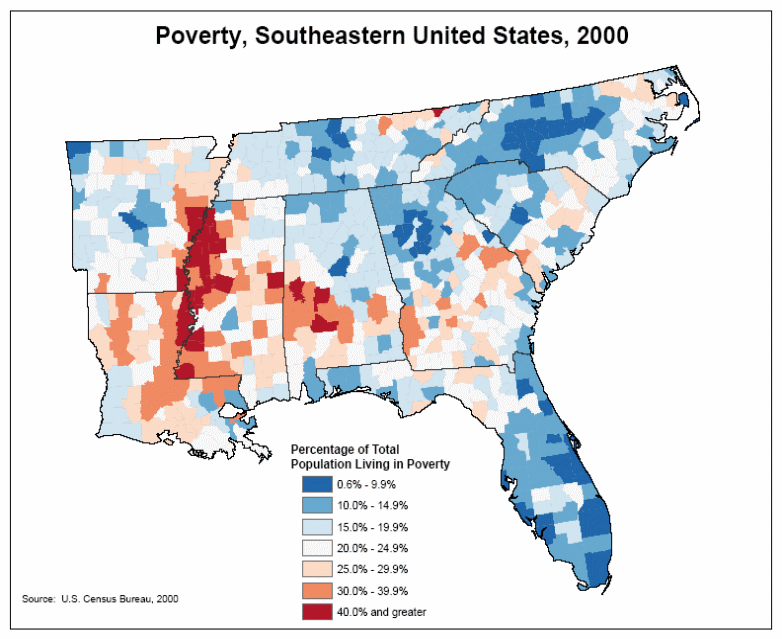
Version A, Choropleth Map
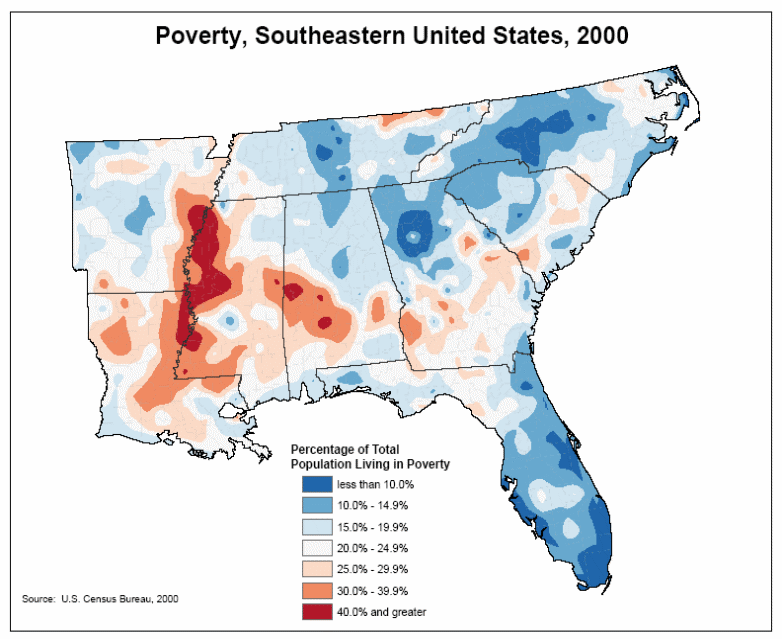
Version B, Isopleth Map

Version A, Choropleth Map
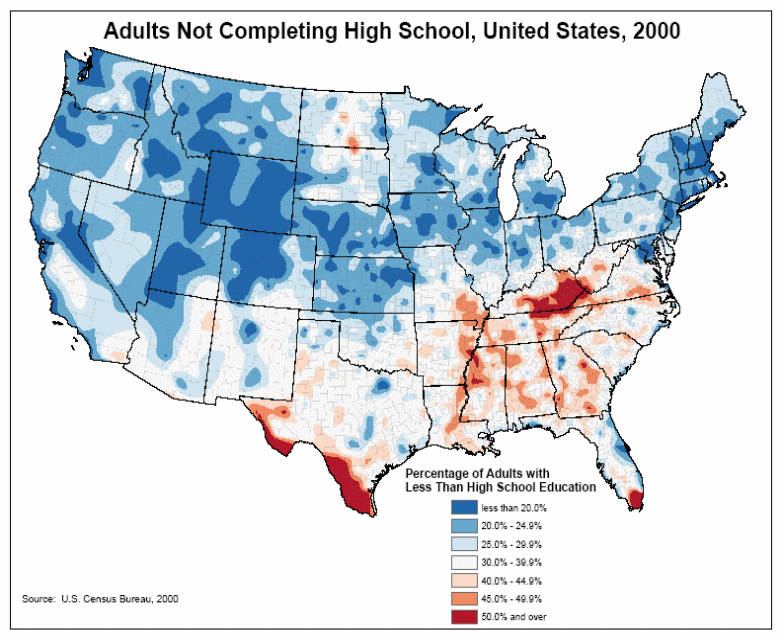
Version B, Isopleth Map
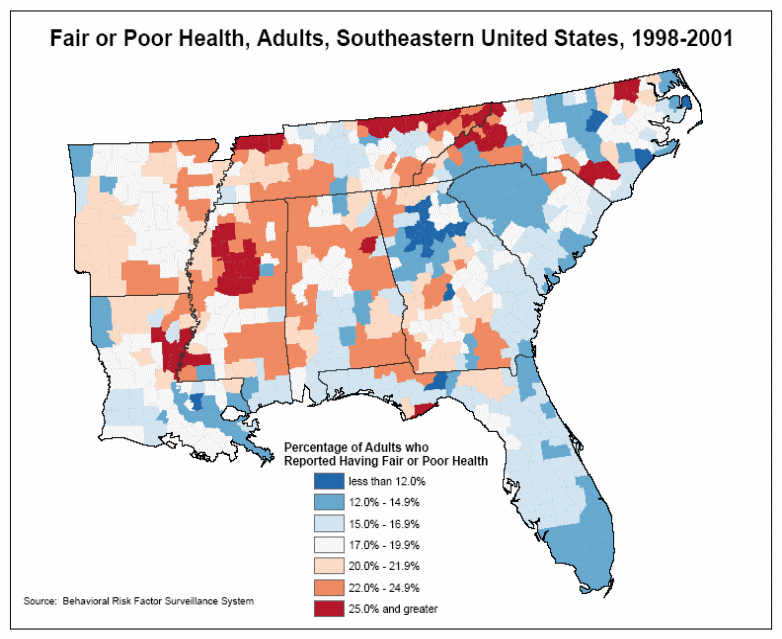
Version A, Choropleth Map
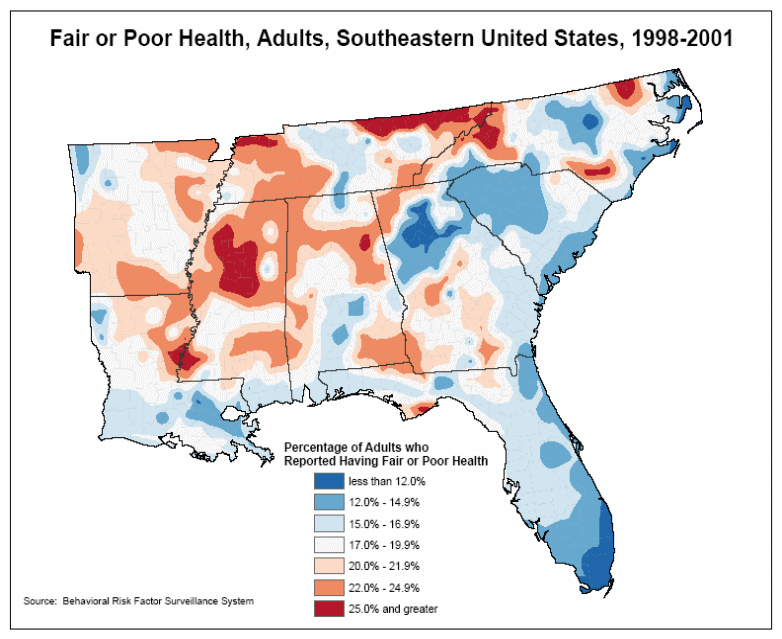
Version B, Isopleth Map
Map Assessment Tool (Questionnaire):
Fair or Poor Health, U.S. Adults, 1998-2001 (Version A, Choropleth Map)
1. Which state has the largest area where less than 10.0 percent of adults report having fair or poor health?
a. Minnesota
b. Wyoming
c. Montana
d. Iowa
2. What is the most prevalent rate of adults reporting fair or poor health in Wyoming?
a. less than 10.0%
b. 10.0%-12.9%
c. 13.0%-15.9%
d. 16.0%-17.9%
3. How many states have at least one county where 25.0 percent of the population or greater reports having fair or poor health.
a. 12
b. 13
c. 14
d. 15
4. In general terms, is there a visible pattern in the prevalence of fair or poor health in the United States?
a. Yes, from North to South (low to high prevalence)
b. Yes, from West to East (low to high prevalence)
c. Yes, from Northwest to Southeast (low to high prevalence)
d. No
Fair or Poor Health, U.S. Adults, 1998-2001 (Version B, Isopleth Map)
1. Which 3 states have an area where there is a clear gradient (a stepwise increase) involving 6 of the 7 of the health rates?
a. Ohio, North Carolina, and Georgia
b. Ohio, North Carolina, and Kentucky
c. Ohio, Texas, and Virginia
d. Ohio, Kentucky, and Virginia
2. How many states have at least one county where less than 10.0 percent of the population reports having fair or poor health?
a. 13
b. 14
c. 15
d. more than 15
3. Which of the following states has the largest area where greater than 25.0 percent of adults report having fair or poor health?
a. Mississippi
b. Kentucky
c. West Virginia
d. Virginia
4. Which of the following answers best describes the predominant rate of fair or poor health in New England (ME, NH, VT, MA, CT, RI)?
a. less than 10.0%
b. 10.0%-12.9%
c. 16.0%-17.9%
d. 18.0%-21.9%
Poverty, United States, 2000 (Version A, Choropleth Map)
1. Which of the poverty rates below covers a greater area in the US?
a. 15.0%-19.9%
b. 25.0%-29.9%
c. 40.0% and greater
d. Cannot assess
2. Where is the largest concentration of any single rate?
a. Northeast Coast (ME, NH, MA, RI, CT, NY, NJ)
b. Great Lakes States (MN, WI, IL, IN, MI, OH)
c. Inter-Mountain West (NV, UT, ID, AZ, Southern CA)
d. Cannot assess
3. In Utah, how many classes of rates are represented?
a. 3
b. 4
c. 5
d. 6
4. Which of the following states has a gradient of rates that increases from west to east within the state?
a. Mississippi
b. Kentucky
c. Georgia
d. Texas
Poverty, United States, 2000 (Version B, Isopleth Map)
1. How many different categories of poverty rates are reported in South Dakota?
a. 4
b. 5
c. 6
d. 7
2. Which one of the poverty rates below covers the most area in Texas?
a. 15.0%-19.9%
b. 20.0%-24.9%
c. 25.0%-29.9%
d. 30.0%-39.9%
3. Which of the following states has the largest area covered by the 30.0%-39.9% rate?
a. Arizona
b. Georgia
c. Arkansas
d. Texas
4. In Texas, as you move from north to south, the rates generally:
a. increase
b. decrease
c. stay the same
d. cannot assess
Poverty, Southeastern United States, 2000 (Version A, Choropleth Map)
1. What is the predominant poverty rate along the western border of Mississippi?
a. 25.0%-29.9%
b. 30.0%-39.9%
c. 40% and greater
d. Cannot assess
2. How many different categories of rates are there in Tennessee?
a. 4
b. 5
c. 6
d. 7
3. Which state has only 1 county with a poverty rate of 30.0%-39.9% and only 1 county with a poverty rate of 40.0% or greater?
Louisiana
Arkansas
Tennessee
South Carolina
4. Describe the poverty rate pattern visible when moving away from the center of the greater metropolitan Atlanta region (the northwest area or upper-left quadrant of Georgia).
a. Poverty rate increases away from the center
b. Poverty rate decreases away from the center
c. Poverty rate increases away from the center and then decreases again
d. Poverty rate decreases away from the center and then increases again
Poverty, Southeastern United States, 2000 (Version B, Isopleth Map)
1. What is the predominant poverty rate along the northern border of Florida?
a. 15.0%-19.9%
b. 20.0%-24.9%
c. 10.0%-14.9%
d. Cannot assess
2. How many categories of rates are there in Florida?
a. 4
b. 5
c. 6
d. 7
3. Which of the following states has a larger area covered by the rate of 40.0% and greater?
a. Mississippi
b. Arkansas
c. Louisiana
d. Alabama
4. In Mississippi, as you move from east to west, the rates tend to:
a. increase
b. decrease
c. stay the same
d. cannot assess
Adults Not Completing High School, United States, 2000 (Version A, Choropleth Map)
1. Which state has the greatest number of counties where 50% or more adults have not completed high school?
a. Georgia
b. Kentucky
c. Mississippi
d. Texas
2. How many different categories of no high school completion are reported in New Jersey?
a. 2
b. 3
c. 4
d. 5
3. What is the predominant rate in Vermont and New Hampshire?
a. less than 10.0%
b. less than 20.0%
c. 20.0%-24.9%
d. 25.0%-29.9%
4. In Missouri, as you move from northwest to southeast, the rates generally:
a. increase
b. decrease
c. stay the same
d. cannot assess
Adults Not Completing High School, United States, 2000 (Version B, Isopleth Map)
1. Which two states have the largest adjacent area where less than 20% of adults have not completed high school?
a. Utah and Arizona
b. California and Nevada
c. Wyoming and Idaho
d. Colorado and Wyoming
2. What is the predominant rate of adults who have not completed high school in Arkansas along its border with Mississippi?
a. 40.0% - 44.9%
b. 45.0% - 49.9%
c. 50.0% and over
d. Cannot assess
3. In Oregon, how many distinct areas have rates less than 20.0%?
a. 1
b. 2
c. 3
d. 4
4. In the eastern U.S., is there an apparent gradient of high school completion rates?
yes, increasing from north to south
yes, decreasing from north to south
yes, increasing from west to east
no
Fair or Poor Health, Adults, Southeastern United States, 1998-2001 (Version A, Choropleth Map)
1. Which of these states has the largest number of counties along a border with any other state where 25% or more adults report having fair or poor health?
a. Louisiana
b. Mississippi
c. North Carolina
d. Tennessee
2. What is the predominant rate of adults reporting fair or poor health in Alabama along its border with Mississippi?
17.0% - 19.9%
20.0% - 21.9%
22.0% - 24.9%
Cannot assess
3. How many categories of rates are there in South Carolina?
a. 3
b. 4
c. 5
d. 6
4. As you move away from counties bordering the coastline of the Atlantic Ocean, rates tend to initially:
a. increase
b. decrease
c. stay the same
d. cannot assess
Fair or Poor Health, Adults, Southeastern United States, 1998-2001 (Version B, Isopleth Map)
1. What is the predominant rate of adults with fair or poor health in Florida?
12.0% - 14.9%
15.0% - 16.9%
17.0% - 19.9%
cannot assess
2. Of the states below, which state has three separate areas where there is a clear stepwise increase across all seven of the categories of adults with fair or poor health?
a. Alabama
b. Arkansas
c. North Carolina
d. Tennessee
3. How many categories of rates are there in Louisiana?
a. 4
b. 5
c. 6
d. 7
4. Which of these states has the largest area where 12.0%-14.9% of adults report having fair or poor health?
a. Florida
b. Georgia
c. Louisiana
d. South Carolina
Map User Preferences
1. How familiar are you with the types of maps we used today?
1) Very familiar
2) Somewhat familiar
3) Not at all familiar
2. How often do you use maps like the ones presented here today in your work?
all of the time
some of the time
never
U.S Maps:
3. Overall, which type of U.S. map did you find easier to read?
a. Choropleth
b. Isopleth
4. Overall, which type of U.S. map did you prefer to use?
a. Choropleth
b. Isopleth
Southeast Maps:
5. Overall, which type of Southeast map did you find easier to read?
a. Choropleth
b. Isopleth
6. Overall, which type of Southeast map did you prefer to use?
a. Choropleth
b. Isopleth
Background Characteristics
1. Are you currently employed for pay, either full or part time?
a. Yes
b. No (Skip to question 3)
2. Which of the following best describes the primary setting of your current job?
a. state or local public health agency or department
b. university/college academic or school
d. university-affiliated hospital or health care facility
e. other hospital or health care facility
3. Which of the following best describes the primary setting of the most recent job you held?
a. state or local public health agency or department
b. university/college academic or school
d. university-affiliated hospital or health care facility
e. other hospital or health care facility
| File Type | application/msword |
| File Title | DEPARTMENT OF HEALTH & HUMAN SERVICES |
| Author | krs0 |
| Last Modified By | mxm3 |
| File Modified | 2008-01-31 |
| File Created | 2008-01-31 |
© 2026 OMB.report | Privacy Policy