CMS PHR OMB Statistical Methods Part B Revised.CLEAN
CMS PHR OMB Statistical Methods Part B Revised.CLEAN.doc
Medicare Registration Summary and Medication History Personal Health Record Evaluation
OMB: 0938-1058
Centers for Medicare & Medicaid Services
OMB Clearance Application
Supporting Statement Part B
Medicare Registration Summary and Medication History Personal Health Record Evaluation
March 3, 2009
Table of Contents
B. Collections of Information Employing Statistical Methods 3
1. Respondent Universe and Selection Methods 3
2. Procedures for Collection of Information 5
3. Methods to Maximize Response Rates 8
B. Collections of Information Employing Statistical Methods
1. Respondent Universe and Selection Methods
The potential respondent universe (referred to here as the in-scope population) is comprised of Medicare beneficiaries who have: 1) registered for use of a personal health record (PHR) through their Medicare Advantage Health Plan; and 2) accessed their PHR at least once since June 1, 2007. This in-scope population has been identified from seven health plans that are participating in a Medicare managed care PHR demonstration sponsored by the Centers for Medicare and Medicaid Services. To participate, the health plans’ PHRs needed to contain: content on beneficiaries’ basic demographics, medication history, and health encounter information such as diagnoses and procedures; functionalities such as supporting the use of claims data, ability to print reports and capability to provide access to others (such as caregives and providers); and features such as health assessments and links to health educational materials.
Seven plans (three of them part D plans) across the country volunteered to participate in this pilot. These plans and their total number of Medicare Advantage and Part D members are as follows, Blue Cross Blue Shield of Arkansas (1,454), Blue Cross Blue Shield of Louisiana (12,548), HIP USA in New York (138,406), Humana (4,530,803), Kaiser (908,952), Medcore (1,816) and University of Pittsburg Medical Center “UPMC” (90,912).
As the population distribution is heavily skewed by health plan (refer to Exhibit 1), differential sampling rates within health plan (which define the primary stratification) will be used.
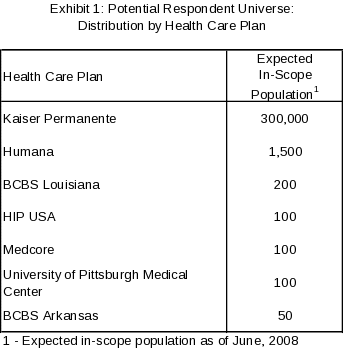
Exhibit 1 is based on of PHR usage by health plan provided by CMS. For health plans with fewer than 500 in-scope population, all eligible persons will be selected from the plan’s in-scope population. For health plans with more than 500 in-scope population (Humana and Kaiser Permanente), we will select a random sample without replacement of persons from the health plan’s in-scope population and will stratify our sample based on characteristics described below. For the Humana Health Plan, the selection will be made via simple random sampling without replacement (i.e., there will be no further stratification of the in-scope population).
Given the large in-scope population for the Kaiser Permanente Health Plan, it was desired to provide a sample design that would support analyses within the Kaiser Permanente Health Plan by key subgroups which could be related to PHR use and perceptions – gender, age group, and chronic condition. As a result, the Kaiser Permanente Health Plan in-scope population will be stratified by the key subgroups prior to selection.
The sampling strata thus will include the following:
Health Plan and (for Kaiser Permanente Health Plan):
Gender
Age group (<65, 65-74, 75+)
Chronic condition (present, not present)
For health plans with more than 500 in-scope population, the sample size was determined as that required to allow insight into the findings of greatest interest (proportion of in-scope population that reports benefits from using the PHR) for the following levels:
Health Plans.
Within Kaiser Permanente Health Plan – each of the dimensions of gender, age group, and chronic condition, taken one at a time
We cannot employ a similar stratification approach for Humana because data on these key beneficiary characteristics are not available for that plan. For the Humana Health Plan, the target sample size was determined so as to provide a minimum expected power of 80% for comparisons with the Kaiser Permanente Health Plan, assuming an average proportion of 0.50, an effect size of 0.10, a response rate of 80%, an assumed design effect of 1.0 (given simple random sampling is used for Humana), and a desired significance level of 95%.
For the Kaiser Permanente Health Plan, the sample size for each level of each dimension (gender, age group, and chronic condition) was determined so as to provide a minimum expected power of 80% for comparisons between levels within a dimension, assuming an average proportion of 0.50, an effect size of 0.10, a response rate of 80%, an assumed design effect of 1.1 (given differential weighting by cell – see discussion below – is required), and a desired significance level of 95%. A minimum selected sample of 552 (which translates to an expected reporting sample of 440) is thus required for each level of each dimension.
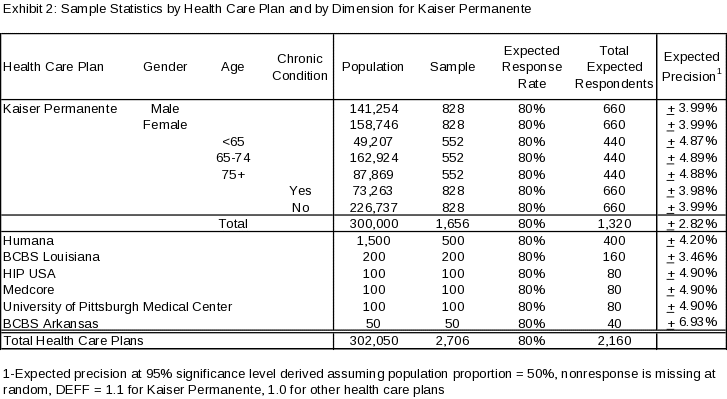
The total required sample sizes for each level of each dimension will be equally allocated across the cells defined by the cross-classification of the three dimensions of interest to ensure minimum sample sizes for all dimensions are met. Given the difference in the number of levels between the dimensions, sample sizes for gender and chronic conditions groupings will exceed minimum requirements, and thereby strengthen the analysis for those dimensions.
The resulting target selected and reporting sample sizes by Health Plan and by dimension (for Kaiser Permanente) are provided in Exhibit 2 (above), along with expected precision at the 95% significance level for the proportion of interest.
2. Procedures for Collection of Information
NORC is one of the nation’s premiere organizations for rigorously designing and implementing data collection for social scientific purposes. The current study will benefit from all of NORC’s expertise in this area. Initially, a sampling frame will be developed based on the information on beneficiaries’ data received by health plans. The frame will include separate sub-frames for each health plan and will be keyed to each individual eligible beneficiary whose data was received by the plan. Also included in the frame will be any additional data on the beneficiary that has been received by the plan and that is relevant to stratification (for Kaiser Permanente). Following development of the sampling frame, and using the procedure outlined in Section 1, we will identify an initial replicate sample comprising approximately one third of our final proposed sample and will initiate data collection among this group. Following this, we will repeat the process for the second and third replicates. Using a replicate approach where an initial representative sample is pulled from the sampling frame will allow for any necessary adjustments in processes used for data collection based on the initial experience. It will also allow for some preliminary hypothesis refinement by making a representative set of responses available to researchers while data collection is still taking place.
Once a given replicate is selected, NORC staff will include logistical information for the individuals included in our sample in our proprietary receipt control system and initiate data collection by printing appropriate materials and including questionnaires and envelopes and producing the initial mail out which will include a self-addressed stamped envelope for providing responses back to NORC. Consistent with best practices used by NORC on all surveys, two weeks following initial mailing we will contact non-responders by phone to prompt a responses and then will repeat telephone calls to non-responders another two weeks following the second call. As appropriate we will re-send the questionnaire or offer to allow the respondent to complete the survey on the phone when we reach them using computer assisted telephone interviewing techniques. Although we expect most beneficiaries will prefer to complete the survey on paper, we will offer to email the survey in electronic format for those who prefer this method. Beneficiaries will be able to return the electronic version to NORC by email or mail.
NORC’s state of the art production and phone facility located in downtown Chicago will be used for all mail outs and telephone work. This facility employs computerized dialing and adjudication systems that are able to efficiently initiate, adjudicate calls for disconnected numbers, and route live calls (or answering machines) to telephone interviewers who can then initiate the script and survey or leave a message. The interviewers then code each call in terms of status (e.g., complete, refusal, call back, and many other codes) of the call at the time the call ends and, if appropriate, the phone number is then fed back into our system for further follow-up. As data are collected we will develop an analysis file that includes all demographic data as well as data collected as part of the interview itself.
Using the response targets and design described above, we expect precision of +7 percentage points or smaller for all subgroups, with most subgroups having an expected precision of +5 percentage points or smaller. The sample distribution for the Kaiser Permanente Health Plan at the cell level is provided in Exhibit 3 (selected sample size) and Exhibit 4 (expected reporting sample size).
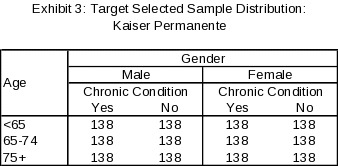
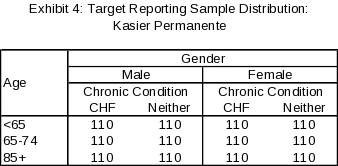
For the Humana Health Plan, and for each cell within the Kaiser Permanente Health Plan, we will determine the sampling interval (k) by dividing the number of cases in the in-scope population universe by the target selected sample size (500 for Humana, 138 for Kaiser). We will then randomly choose a number between 1 and k, and starting with that integer, sample every kth unit.
Each cell for the Kaiser Permanente sample will have a different sampling rate. In addition, actual response rates will vary by health plan and by cell for the Kaiser Permanente sample. As a result, sample weights will be derived to account for probability of selection (for Humana and Kaiser Permanente) and for nonresponse, to allow generation of estimates representing the total in-scope populations.
Power Calculation
As described above, this is primarily a descriptive study meant to characterize the experience of beneficiaries using PHRs. While this is not an experimental study, we do a power calculation for two reasons, first this is a standard part of OMB application process at NORC and second, we would like to able to conduct some basic comparisons as part of the study to compliment the descriptive results which are the main objective of the study. The key planned comparisons for the study are:
Humana vs Kaiser Permanente
and (for Kaiser Permanente Health Plan)Male vs. Female
Chronic condition present vs. Chronic condition not present
Age group 65-74 vs. Age group 75+
Age group 65-74 vs. Age group <65
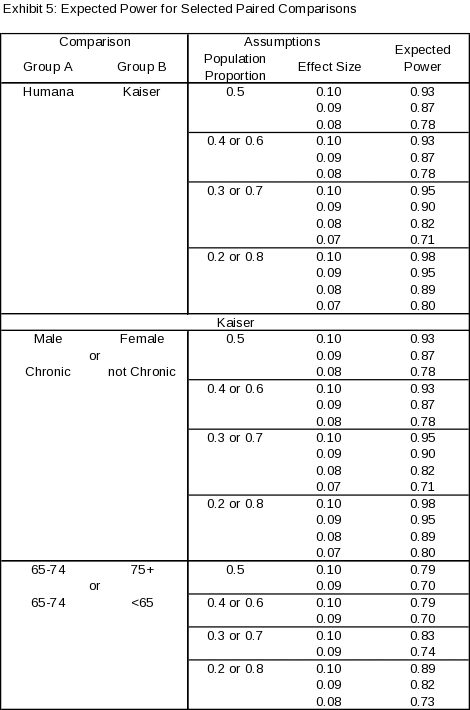
Exhibit 5 provides expected power for key planned paired comparisons with a 95% significance level, given varying assumptions concerning level of population proportions and effect sizes. The results indicate the proposed sample sizes will yield a power of 80% or greater for key paired comparisons in which the effect size is 0.10 or greater (i.e., the magnitude of the difference in proportion between the two groups is 10 percentage points or greater), with the potential for smaller effect sizes to be detected comparisons for subgroups with larger samples or if population proportions vary from 0.50.
3. Methods to Maximize Response Rates
The data collection procedures for the proposed SAQ will follow the standards of the well-established and proven Total Design Method (TDM).1 In brief, the theory underlying the TDM is one of social exchange, where the rate of response is a function of both the amount of effort required as well as what benefit a respondent will receive for their participation. The basic components of the TDM are as follows:
Minimization of respondent burden through the design of high-quality instruments that are attractive and easy to complete;
Persuasive communications which provide information about the study; and
A series of follow-up techniques that vary by mode, such as additional mailings and telephone calls. (Note that our approach to follow-up is described above)
Specifically, our plans for enhancing response rates are highlighted below.
Pre-testing. In order to further minimize the burden to respondents, NORC will pre-test the survey instrument to identify problem areas prior to implementation. This pre-test will focus on the main study concepts, question reading and order, and question clarity, helping to ensure that the survey is as easy to complete as possible. Additionally, NORC has minimized the number of items in the SAQ in order to reduce burden to respondents.
Communication and Quality of Study Materials. A mail study can be characterized by the degree and quality of contact with the study materials (questionnaire). In numerous examples, quality print materials have generated a higher response rate than other modes. All print materials for the Medicare beneficiary survey will be professionally designed and printed. Should beneficiaries request telephone survey administration, NORC researchers are highly-trained, experienced, and skilled at achieving high response rates. In addition, prior to receiving a questionnaire, respondents receive a professionally drafted letter signed by NORC and the health plan outlining the importance of the study and requesting their participation.
Overcoming Barriers to Participation. Improving response rate from Medicare beneficiaries begins with in-depth understanding of the barriers to their participation. The survey is intentionally written at a 4th grade reading level using a readable font and formatting style based on the Consumer Assessment Health Plans Survey (CAHPS) for Medicare beneficiaries administered by CMS. Furthermore, the survey has been designed with particular attention to the amount of time and effort needed by Medicare beneficiaries to complete the survey. The survey is user-friendly, with a maximum of 31 questions. Additionally, the questionnaire will be pilot tested with 10 beneficiaries, and survey questions will be amended to reflect suggested improvements from these respondents.
Response rate will also be enhanced through the use of telephone prompting. NORC interviewers are skilled at adapting to the varied situations presented in each beneficiary’s situation. Specifically, beneficiaries will have the option to complete the questionnaire at home and return by mail, over the phone, or return by fax or email. In addition, beneficiaries will have the option of handing the survey to a caregiver to fill out on their behalf. If the beneficiary elects to have the caregiver complete the survey, the caregiver may complete this by mail, over the phone, or return by fax or email.
Salience of Survey Content. The survey was designed to be not only brief, but of high salience to the sampled beneficiaries. Surveys that are salient to the respondent group coupled with timely advance materials (such as pre-notification letters) will maximize response for the survey. In summary, although no response rate can be guaranteed, we estimate a survey response rate of approximately 80%. This estimate is based on NORC’s extensive experience conducting surveys similar to this one in methodology and with this population, as well as the procedures and best practices developed by NORC’s highly experienced survey operations department. It is our experience that the mixed mode approach (mail, email, phone) implied in this design will maximize opportunities to meet the 80% target.
In addition to maximizing participation in the survey, efforts will also be made to ensure the survey data that are collected are representative of the study population of interest. While some level of nonresponse is acceptable, the consequences of nonresponse on data quality are complex.
To examine nonresponse as a potential source of bias, NORC will conduct a nonresponse analysis. The analysis will focus on those known factors in the sample file, including, but not limited to:
Variation in participation in the pilot among survey responders and nonresponders
Variation in beneficiary characteristics including the health status, age, and gender
Upon completing the analysis, NORC will report its finding and recommendations to CMS. Our recommendations will include the possibility of weighting to adjust for nonresponse.
4. Methods for Testing Procedures
The questionnaire will be pilot tested with nine Medicare Managed Care and/or Part D Drug plan beneficiaries who have used the PHR more than once. The beneficiaries will be asked to complete the questionnaire and then respond to debriefing questions regarding comprehension of question, recall burden, and difficulties with response options. Debriefing questions will be administered in written survey format. The survey questions will be revised based on the respondents’ feedback.
5. Statistical Consultants
The following individuals contributed to the questionnaire and study design.
Kennon Copeland
Vice President
The National Opinion Research Center (NORC) at the University of Chicago
1155
East 60th Street
Chicago, IL 60637
Adil Moiduddin, MPP
Senior Research Scientist
The National Opinion Research Center (NORC) at the University of Chicago
4350 East-West Highway, Suite 807
Bethesda, MD 20910
Daniel S. Gaylin, MPA
Executive Vice President of Health Research
The National Opinion Research Center (NORC) at the University of Chicago
4350 East-West Highway, Suite 801
Bethesda, MD 20910
The government project officer for this study is:
Steve Bernstein
Health Information Technology Project Officer
Agency for Healthcare Quality and Research (AHRQ)
540 Gaither Road
Rockville, MD 20850
1 Dillman, Don A. 1978. Mail and Telephone Surveys: The Total Design Method. New York: Wiley.
| File Type | application/msword |
| Author | Muckle-Alison |
| Last Modified By | CMS |
| File Modified | 2009-04-10 |
| File Created | 2009-04-10 |
© 2026 OMB.report | Privacy Policy