Discussion of Changes to Estimated Burden
1989supp06 - Appendix2 - Burden Change.doc
NPDES Permit Regulations and Effluent Limitation Guidelines for Concentrated Animal Feeding Operations (Final Rule)
Discussion of Changes to Estimated Burden
OMB: 2040-0250
Appendix to EPA ICR 1989.06:
Supporting Statement for the Information Collection Request for NPDES and ELG Regulatory Revisions for Concentrated Animal Feeding Operations (Final Rule)
Discussion of Changes to Estimation Procedure and Resulting Effects on Burden Calculations
F
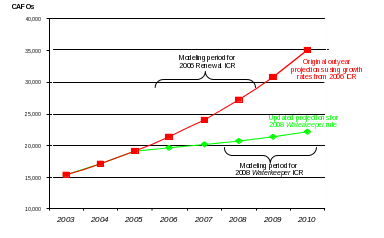
Figure 1 or
the original industry size projections
performed for EPA’s renewal of the CAFO ICR in 2006, the Agency
estimated labor burden impacts for the three-year time period
spanning 2006-2008 (EPA ICR 1989.04). For this analysis, EPA assumed
steady increases in the number of the largest facilities (i.e., those
most likely to meet EPA’s definition of a Large CAFO) in the
major animal agriculture industries based on the changes in actual
numbers of facilities and animal production as reported in USDA’s
agriculture census for 20021.
As shown in Figure 1, long-term projections using these growth
patterns yielded an estimate of roughly 27,000 CAFOs by the end of
2008. For the ICR supporting the Waterkeeper rule revisions
in 2008, EPA shifted the ICR modeling period out to the three-year
period spanning 2008-2010. Using the same growth rates as used in
the 2006 ICR yielded a projection of 35,000 CAFOs by the year 2010.
This estimate diverges widely from EPA’s own internal reporting
on actual facilities in the CAFO NPDES universe, which as of 2008
showed a universe size holding roughly steady at 19,000 CAFOs.
To develop a burden impacts analysis for the Waterkeeper final rule that reflected EPA’s most current knowledge of actual industry size, the Agency started by re-examining growth rates for each individual animal sector. EPA observed that rapid expansion in the swine industry in prior years significantly had affected the growth forecast for the total CAFO industry, especially when extrapolated to out to the year 2010. More specifically, the swine industry had documented annual growth in the number of large swine operations as high as 20 percent in one of the previous reporting years for the USDA data. This large annual rate of sector expansion, combined with the fact that swine operations constitute nearly 20 percent of total CAFOs, resulted in the unlikely projection shown in Figure 1 of 35,000 total CAFOs by 2010.
To derive updated industry size projections for the Waterkeeper final rule ICR estimates, EPA analysts used market forecasts and historical changes in the total number of farms since 1992 to develop more tailored annual growth rates for each animal sector that accounted more fully for the cycles of expansion and downsizing inherent in the animal agriculture industry. EPA confirmed that the resulting projected increases in the numbers of the largest facilities were commensurate with the most recent reported marketings2 for each animal species. These new overall growth rates resulted in a projection of approximately 22,000 total CAFOs by the year 2010, and EPA then used improved estimate of projected industry respondents to adjust its burden impacts analysis accordingly.
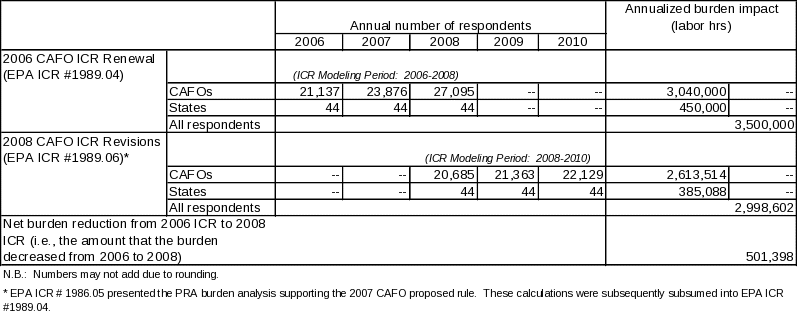
As shown in Table 1, EPA had originally estimated the number of CAFO respondents in 2008 at 27,095 for the 2006 CAFO ICR renewal. For purposes of comparison, Table 1 also shows that the new universe projections for Waterkeeper ICR using the more tailored growth rates resulted in an estimate of 20,685 CAFO respondents by 2008—a nearly 25 percent reduction in the baseline estimate of industry respondents.
Table 1

As Table 1 also shows, EPA’s burden estimate for the CAFO regulations decreased in total by 501,398 labor hours from the 2006 CAFO ICR renewal to the 2008 Waterkeeper ICR. This reduction was driven by two factors: The smaller number of respondents submitting permits due the revised regulations as well as the smaller estimate of total industry size. For EPA’s ICR supporting the 2008 Waterkeeper rule revisions, EPA estimated that roughly 75 percent of the total CAFO universe would incur PRA burden due to discharges and the resulting need for a permit.3 In the ICR supporting statement, EPA documented how the resulting reduction in permitting would yield a combined burden reduction for CAFO respondents and permitting authorities of 25,514 annual labor hours.4
Table 2 in turn shows the contributions of the regulatory revisions and the industry baseline adjustments, respectively, to the recalculation of the PRA labor burden estimate for the CAFO regulations. Once the burden change due specifically to the regulatory revisions is accounted for (25,514 hours), the portion of the total burden reduction of 501,398 hours that remains is 475,884 hours. This difference represents the portion of the total labor burden reduction that is attributable to EPA’s updated CAFO industry size projections.
Table 2

1 USDA Census of Agriculture. 2002 U.S. Summary and State Reports. 2002.
2 USDA Hog and Pig Report. March 30, 2007; USDA Cattle on Feed Report. April 20, 2007; USDA-ERS Livestock, Dairy, and Poultry Outlook. June 19, 2007.
3 EPA ICR No. 1986.06, Supporting Statement. Table 4-2 on p. 12 shows estimates for 2008 of 20,685 total CAFOs, out of which as many as 15,285 CAFOs (~75 percent) could discharge.
4 Ibid. Table 6-18.
| File Type | application/msword |
| File Title | Update to Paperwork Reduction Act (PRA) Analysis for |
| Author | nbonnely |
| Last Modified By | Spencer W. Clark |
| File Modified | 2009-06-09 |
| File Created | 2009-06-09 |
© 2026 OMB.report | Privacy Policy