CCD Fiscal Survey
Common Core of Data Survey System
CCD 09-11 NPEFS Supp Statement Part C
CCD Fiscal Survey
OMB: 1850-0067
Part C. CCD National Public Education Finance Survey
F.1. Discussion of Items
The NPEFS is the CCD’s annual collection of state-level data about revenues and expenditures for public elementary and secondary education. It is a web-based survey that respondents (SEA CCD Fiscal Coordinators) complete following the account classifications in NCES’s handbook, Financial Accounting for Local and State School Systems: 2003 Edition. Crosswalk software is provided to any state whose chart of accounts differs from these standards. Respondents are also asked to reply to questions in a Data Plan. These responses help us to understand and process the data, and are published in the file documentation on the web.
Data from the NPEFS are used to describe revenues and expenditures for public education, create the state per-pupil expenditure (SPPE) statistic that is used in determining allocations for Title I and other Federal programs, and to compare revenues and expenditures across states and over time.
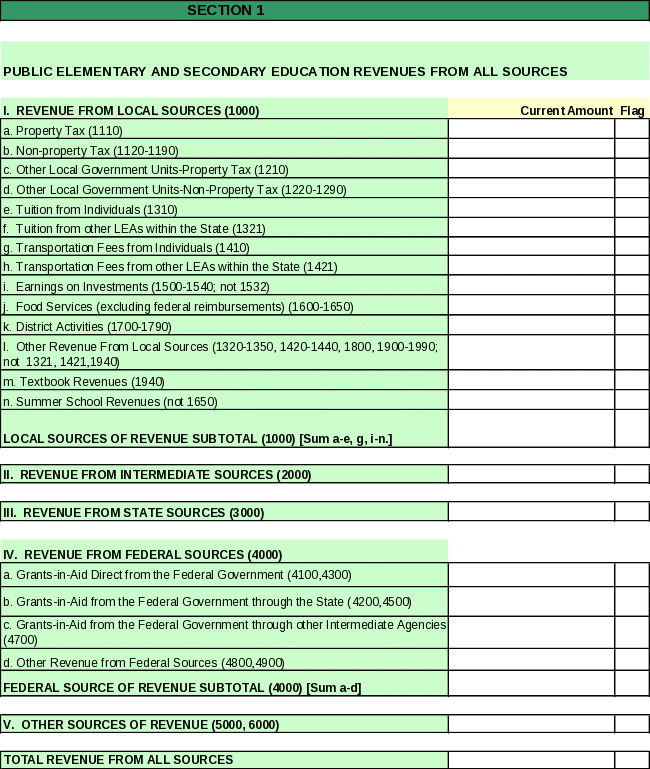
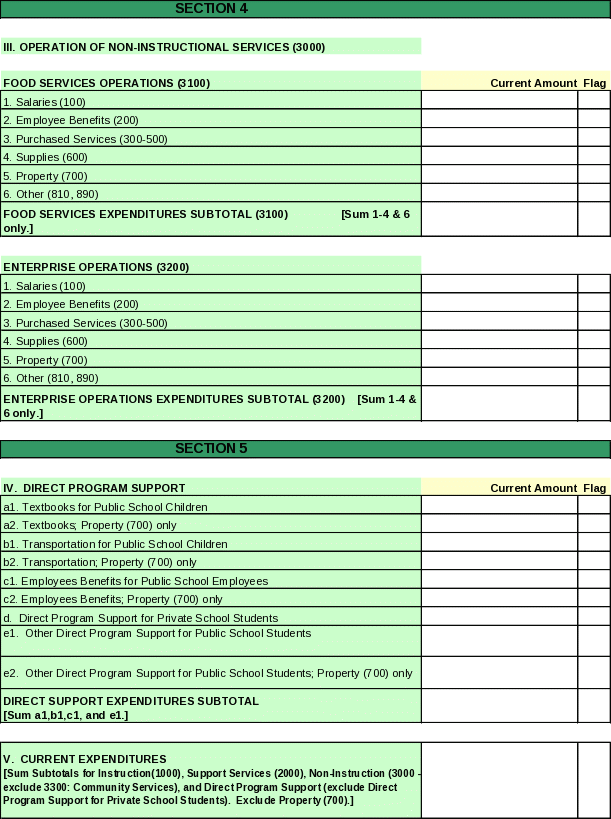
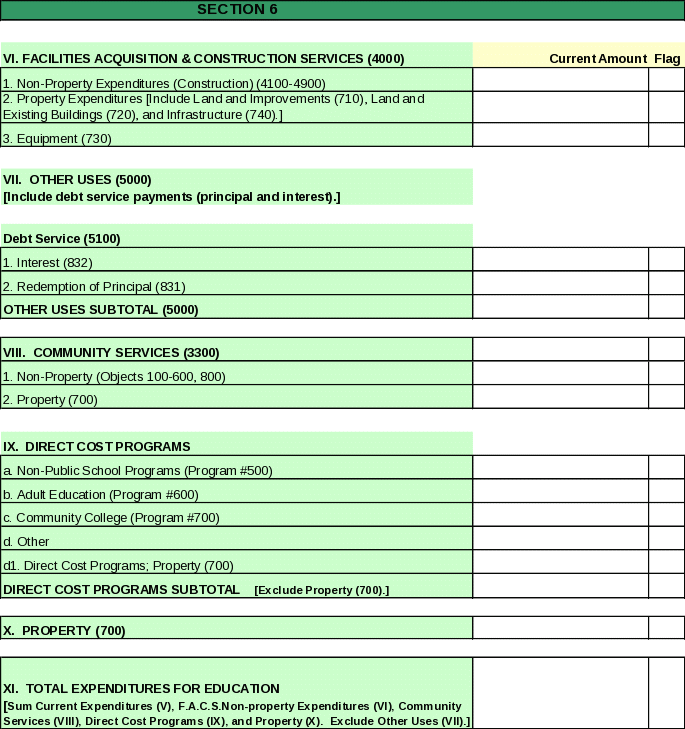
NPEFS Contents. The NPEFS is intended to present all revenues and expenditures within a state for public elementary and secondary education. The survey’s contents are discussed very generally; more detail is given in the survey form at the end of this document.
Contact Information. The survey asks for the name of the state, the person completing the survey, and his or her telephone number. It also requires certification by an authorized official. This is required because the data are used in Title I allocations.
Revenues. Revenue is an increase in net worth that does not have to be repaid. Total revenue is the sum of revenue from four major sources: local, intermediate, state, and federal. (Not all states have an intermediate revenue source between the state and local levels.) Other sources of revenue (e.g., interest from bonds, sale of school property) are reported but not used in calculating total revenue. Revenues are reported in Revenue sections I through V of the NPEFS.
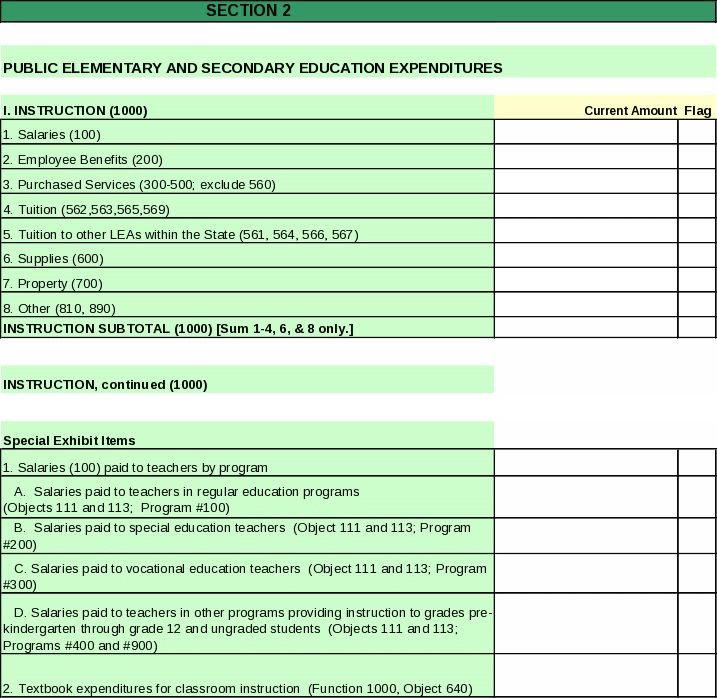
Expenditures. Expenditure is a decrease in net worth. On the NPEFS, it is reported by function and object. These are reported in Expenditure sections I through XI of the NPEFS.
Function describes the activity for which a service or material object was acquired. The five broad functions in the NPEFS are:
Instruction—activities dealing directly with the interaction between teachers and students;
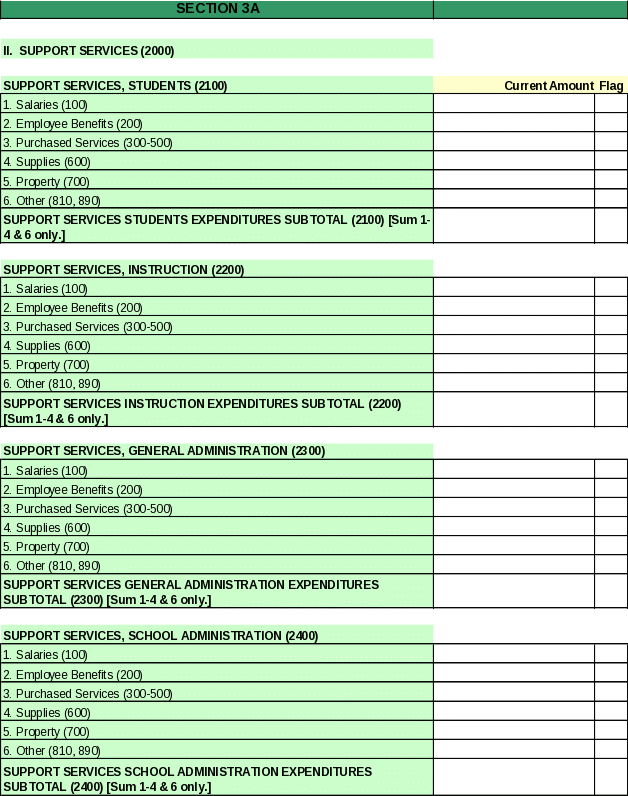
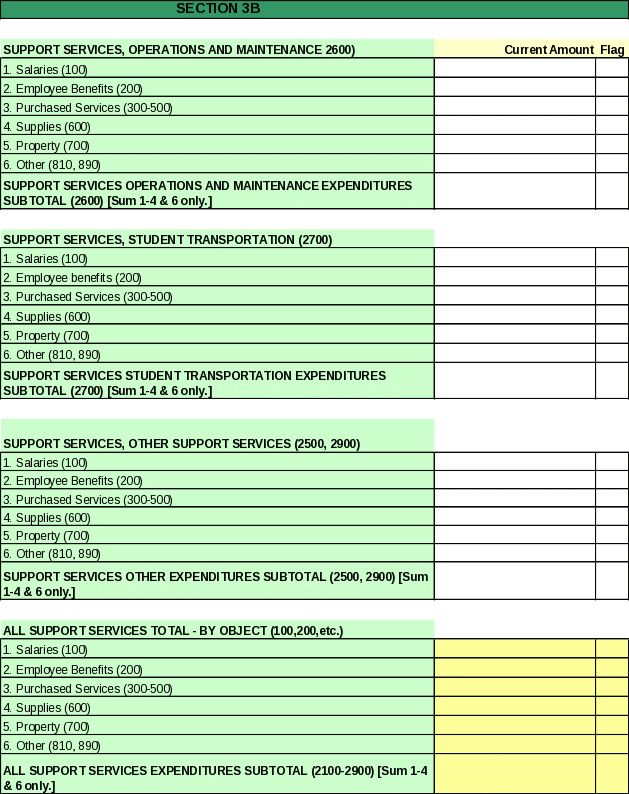
Support Services—administrative, technical and logistical services that facilitate instruction (e.g., guidance counselors);
Operation of Non-instructional Services—activities providing non-instructional services to students or the community (e.g., food services, community swimming pool);
Facilities Acquisition and Construction—acquiring land and buildings, constructing, remodeling, installing major service systems (e.g., central heating/air conditioning);
Debt Service—servicing long-term debt, payments of principal and interest.
Object describes the service or commodity that is obtained through an expenditure. There are seven major categories in the NPEFS.
Personal Services—Salaries;
Personal Services—Employee Benefits;
Purchased Services: Professional and Technical Services (e.g., architect’s fee), Property Services (example, utilities, cleaning services), and Other Purchased Services (e.g., property insurance, printing costs)
Supplies (items that are consumed or worn out);
Property (e.g., land, buildings, equipment);
Debt-Related Expenditures (e.g., interest on bonds);
Other or unspecified objects.
Expenditure items on the NPEFS are combinations of function and object. For example, the Instruction function includes expenditures for salaries, benefits, purchased services, supplies, property, etc.
Totals are reported for current expenditures and total expenditures (sections V and XI, respectively). Current expenditures are those for day-to-day operation of schools. They exclude debt repayment, capital outlays such as construction, and programs outside the scope of PK–12 education. Total current expenditures include all expenditures.
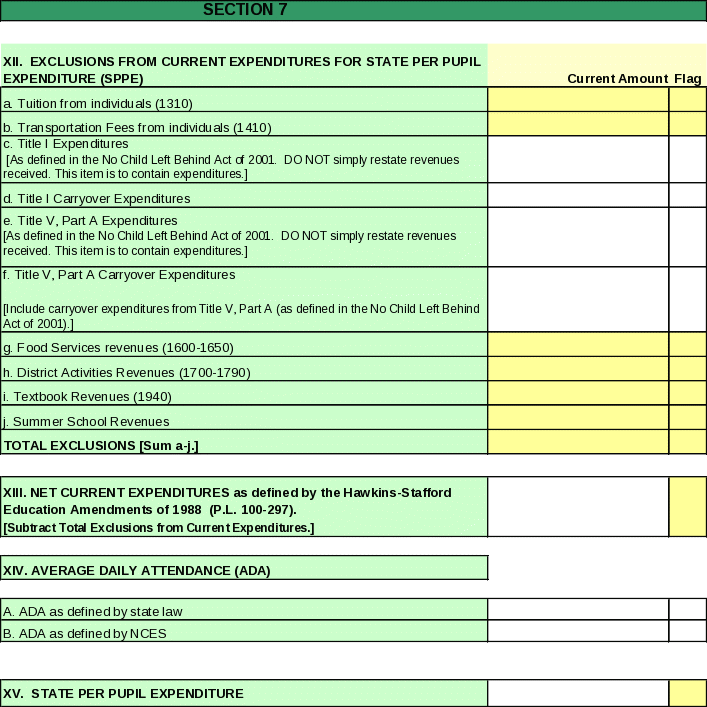
Exclusions. Section VI of the NPEFS contains the items that are to be excluded in calculating state per pupil expenditure (SPPE). These include such items as tuition or transportation fees paid by individuals, Title I carryover expenditures, and revenues from food services, student activities, summer school, and the sale of textbooks. NCES computes net current expenditure as defined by P.L. 100-297 (section XIII).
Average Daily Attendance (section XIV). This is collected for calculating SPPE for Title I and other program uses. States report average daily attendance as defined by state law; or, absent state law, as defined by NCES.
State Per Pupil Expenditure (section XIV). This is computed by NCES and used for calculating Federal entitlements under title I, Impact Aid, and other Federal programs.
NCES has been asked to add several data items to the NPEFS in order to allow an adjustment in the state per pupil expenditures (SPPE) used in allocating Title I, Impact Aid and other ED grants. The Department must be able to exclude the ARRA expenditures money from the SPPE, so that they will not affect the allocation process. States are required to track the ARRA revenues separately. These additional items will provide detail to exclude ARRA expenditures from SPPE and to determine how the funds have been spent. The resulting information will report total ARRA expenditures as well as the amount of expenditures for functions such as classroom instruction and school construction. The new data items are:
1. Current expenditures for public elementary-secondary education instruction (function 1000, objects 100-600, 810, and 890)
2. Direct Support, state payments for and on behalf of school districts, not reported above.
3 . Total current expenditures for public elementary-secondary education (functions 1000, 2000, 3100, 3200, objects 100-600, 810, and 890)
4. Current expenditures for community services, adult education and other programs outside of public elementary-secondary education (programs 500, 600, 700, 800).
5. Property expenditures (functions 1000-3200, object 700)
6. School construction expenditures (function 4000, all objects)
7 . Expenditures from ARRA for Title I and Title V, Part A reported under part XII. Exclusions from Current Expenditures for State per Pupil Expenditures.
F.2. Sample Tables
The sample tables that conclude this Part give an idea of the statistical uses of the National Public Education Finance Survey. The data are reported annually in CCD publications and publications such as the Digest of Education Statistics. The analysis consists of straightforward tabulations of totals and subtotals, percentages, and some ratios.
Table 1.—Revenues and percentage distribution of revenues for public elementary and secondary education, by source and state or jurisdiction: Fiscal year 2005 |
||||||||||||
|
|
Revenues [in thousands of dollars] |
|
Percentage distribution |
||||||||
State or jurisdiction |
|
Total |
|
Local1 |
|
State |
|
Federal |
|
Local1 |
State |
Federal |
United States2 |
|
$487,761,164 |
3 |
$214,389,438 |
3 |
$228,562,195 |
|
$44,809,532 |
|
44.0 |
46.9 |
9.2 |
|
|
|
|
|
|
|
|
|
|
|
|
|
Alabama |
|
5,861,380 |
|
1,906,607 |
|
3,253,486 |
|
701,287 |
|
32.5 |
55.5 |
12.0 |
Alaska |
|
1,679,646 |
|
418,199 |
|
957,820 |
|
303,626 |
|
24.9 |
57.0 |
18.1 |
Arizona |
|
8,151,688 |
3 |
3,301,561 |
3 |
3,898,118 |
|
952,009 |
|
40.5 |
47.8 |
11.7 |
Arkansas |
|
4,034,796 |
|
1,235,669 |
|
2,349,685 |
|
449,442 |
|
30.6 |
58.2 |
11.1 |
California |
|
59,481,350 |
|
17,588,882 |
|
35,234,574 |
|
6,657,894 |
|
29.6 |
59.2 |
11.2 |
|
|
|
|
|
|
|
|
|
|
|
|
|
Colorado |
|
6,911,807 |
|
3,475,507 |
|
2,954,905 |
|
481,395 |
|
50.3 |
42.8 |
7.0 |
Connecticut |
|
8,015,309 |
|
4,527,506 |
|
3,062,150 |
|
425,653 |
|
56.5 |
38.2 |
5.3 |
Delaware |
|
1,376,724 |
|
395,278 |
|
851,355 |
|
130,091 |
|
28.7 |
61.8 |
9.4 |
District of Columbia4 |
|
1,285,489 |
|
1,126,022 |
|
† |
|
159,467 |
|
87.6 |
† |
12.4 |
Florida |
|
22,633,476 |
|
10,720,541 |
|
9,533,209 |
|
2,379,726 |
|
47.4 |
42.1 |
10.5 |
|
|
|
|
|
|
|
|
|
|
|
|
|
Georgia |
|
14,726,455 |
|
6,848,011 |
|
6,466,311 |
|
1,412,133 |
|
46.5 |
43.9 |
9.6 |
Hawaii4 |
|
2,274,165 |
|
50,578 |
|
1,986,614 |
|
236,974 |
|
2.2 |
87.4 |
10.4 |
Idaho |
|
1,816,509 |
|
576,766 |
|
1,043,927 |
|
195,816 |
|
31.8 |
57.5 |
10.8 |
Illinois |
|
21,281,907 |
|
12,683,909 |
|
6,758,417 |
|
1,839,581 |
|
59.6 |
31.8 |
8.6 |
Indiana |
|
11,278,665 |
|
5,214,024 |
|
5,326,048 |
|
738,593 |
|
46.2 |
47.2 |
6.5 |
|
|
|
|
|
|
|
|
|
|
|
|
|
Iowa |
|
4,481,531 |
|
2,055,162 |
|
2,051,947 |
|
374,422 |
|
45.9 |
45.8 |
8.4 |
Kansas |
|
4,468,190 |
|
1,582,904 |
|
2,431,195 |
|
454,091 |
|
35.4 |
54.4 |
10.2 |
Kentucky |
|
5,379,257 |
|
1,671,516 |
|
3,049,129 |
|
658,612 |
|
31.1 |
56.7 |
12.2 |
Louisiana |
|
6,057,201 |
|
2,337,820 |
|
2,878,017 |
|
841,364 |
|
38.6 |
47.5 |
13.9 |
Maine |
|
2,308,518 |
|
1,135,119 |
|
946,282 |
|
227,117 |
|
49.2 |
41.0 |
9.8 |
|
|
|
|
|
|
|
|
|
|
|
|
|
Maryland |
|
9,886,032 |
|
5,496,485 |
|
3,729,271 |
|
660,276 |
|
55.6 |
37.7 |
6.7 |
Massachusetts |
|
12,735,802 |
|
6,525,322 |
|
5,442,172 |
|
768,309 |
|
51.2 |
42.7 |
6.0 |
Michigan |
|
18,365,247 |
|
5,776,655 |
|
11,043,486 |
|
1,545,106 |
|
31.5 |
60.1 |
8.4 |
Minnesota |
|
8,687,246 |
|
2,069,248 |
|
6,050,153 |
|
567,845 |
|
23.8 |
69.6 |
6.5 |
Mississippi |
|
3,642,050 |
|
1,099,730 |
|
1,965,158 |
|
577,162 |
|
30.2 |
54.0 |
15.8 |
|
|
|
|
|
|
|
|
|
|
|
|
|
Missouri |
|
8,373,954 |
|
4,768,959 |
|
2,859,179 |
|
745,815 |
|
56.9 |
34.1 |
8.9 |
Montana |
|
1,293,161 |
|
514,077 |
|
584,289 |
|
194,794 |
|
39.8 |
45.2 |
15.1 |
Nebraska |
|
2,800,202 |
|
1,633,416 |
|
877,246 |
|
289,540 |
|
58.3 |
31.3 |
10.3 |
Nevada |
|
3,393,152 |
|
2,215,988 |
|
920,244 |
|
256,921 |
|
65.3 |
27.1 |
7.6 |
New Hampshire |
|
2,242,384 |
|
1,236,214 |
|
879,428 |
|
126,743 |
|
55.1 |
39.2 |
5.7 |
|
|
|
|
|
|
|
|
|
|
|
|
|
New Jersey |
|
21,738,449 |
|
11,331,905 |
|
9,450,496 |
|
956,048 |
|
52.1 |
43.5 |
4.4 |
New Mexico |
|
3,049,760 |
|
413,289 |
|
2,133,707 |
|
502,763 |
|
13.6 |
70.0 |
16.5 |
New York |
|
43,649,605 |
|
21,682,869 |
|
18,768,008 |
|
3,198,727 |
|
49.7 |
43.0 |
7.3 |
North Carolina |
|
10,446,941 |
|
2,760,943 |
|
6,552,886 |
|
1,133,112 |
|
26.4 |
62.7 |
10.8 |
North Dakota |
|
920,566 |
|
431,813 |
|
340,259 |
|
148,495 |
|
46.9 |
37.0 |
16.1 |
|
|
|
|
|
|
|
|
|
|
|
|
|
Ohio |
|
19,912,038 |
|
9,633,419 |
|
8,752,118 |
|
1,526,501 |
|
48.4 |
44.0 |
7.7 |
Oklahoma |
|
4,621,537 |
|
1,520,859 |
|
2,466,399 |
|
634,278 |
|
32.9 |
53.4 |
13.7 |
Oregon |
|
4,999,669 |
|
2,052,095 |
|
2,439,989 |
|
507,585 |
|
41.0 |
48.8 |
10.2 |
Pennsylvania |
|
21,439,695 |
|
11,937,783 |
|
7,717,500 |
|
1,784,412 |
|
55.7 |
36.0 |
8.3 |
Rhode Island |
|
1,878,044 |
|
1,002,573 |
|
725,609 |
|
149,862 |
|
53.4 |
38.6 |
8.0 |
|
|
|
|
|
|
|
|
|
|
|
|
|
South Carolina |
|
6,267,520 |
|
2,768,595 |
|
2,837,312 |
|
661,614 |
|
44.2 |
45.3 |
10.6 |
South Dakota |
|
1,061,844 |
|
526,012 |
|
355,969 |
|
179,863 |
|
49.5 |
33.5 |
16.9 |
Tennessee |
|
6,942,997 |
|
3,153,736 |
|
2,998,090 |
|
791,171 |
|
45.4 |
43.2 |
11.4 |
Texas |
|
36,798,422 |
|
19,466,061 |
|
13,214,827 |
|
4,117,534 |
|
52.9 |
35.9 |
11.2 |
Utah |
|
3,227,340 |
|
1,126,268 |
|
1,775,126 |
|
325,946 |
|
34.9 |
55.0 |
10.1 |
|
|
|
|
|
|
|
|
|
|
|
|
|
Vermont |
|
1,283,411 |
|
97,823 |
|
1,090,538 |
|
95,050 |
|
7.6 |
85.0 |
7.4 |
Virginia |
|
11,990,159 |
|
6,292,194 |
|
4,871,156 |
|
826,809 |
|
52.5 |
40.6 |
6.9 |
Washington |
|
9,266,940 |
|
2,761,736 |
|
5,629,205 |
|
875,999 |
|
29.8 |
60.7 |
9.5 |
West Virginia |
|
2,779,795 |
|
766,318 |
|
1,684,324 |
|
329,154 |
|
27.6 |
60.6 |
11.8 |
Wisconsin |
|
9,432,162 |
|
4,036,880 |
|
4,789,269 |
|
606,013 |
|
42.8 |
50.8 |
6.4 |
Wyoming |
|
1,130,977 |
|
438,594 |
|
585,593 |
|
106,791 |
|
38.8 |
51.8 |
9.4 |
|
|
|
|
|
|
|
|
|
|
|
|
|
Other jurisdictions |
|
|
|
|
|
|
|
|
|
|
|
|
American Samoa |
86,909 |
|
1,900 |
|
16,589 |
|
68,421 |
|
2.2 |
19.1 |
78.7 |
|
Guam |
|
— |
|
— |
|
— |
|
— |
|
— |
— |
— |
Northern Mariana Islands |
63,700 |
|
799 |
|
37,210 |
|
25,691 |
|
1.3 |
58.4 |
40.3 |
|
Puerto Rico |
|
3,017,121 |
|
130 |
|
2,125,381 |
|
891,609 |
|
# |
70.4 |
29.6 |
U.S. Virgin Islands |
191,280 |
|
152,542 |
|
0 |
|
38,738 |
|
79.7 |
0.0 |
20.3 |
|
— Not available. |
||||||||||||
† Not applicable. |
||||||||||||
# Rounds to zero. |
||||||||||||
1Local revenues include intermediate revenues. |
||||||||||||
2U.S. totals include the 50 states and the District of Columbia. |
||||||||||||
3Value affected by redistribution of reported values to correct for missing data items. |
||||||||||||
4Both the District of Columbia and Hawaii have only one school district each; therefore, neither is comparable to other states. Local revenues in Hawaii consist almost entirely of student fees and charges for services, such as food services, summer school, and student activities. |
||||||||||||
NOTE: Detail may not sum to totals because of rounding. |
||||||||||||
SOURCE: U.S. Department of Education, National Center for Education Statistics, Common Core of Data (CCD), "National Public Education Financial Survey (NPEFS)," fiscal year 2005, Version 1a. |
||||||||||||
Table 2.—Current expenditures and percentage distribution of current expenditures for public elementary and secondary education, by function and state or |
|
||||||||||||||
Table 2.—jurisdiction: Fiscal year 2005 |
|||||||||||||||
|
Current expenditures1 [in thousands of dollars] |
|
|
Percentage distribution |
|||||||||||
State
or |
Total |
|
Instruction |
|
Student support services3 |
|
Administration |
|
Operations |
|
|
Instruction and instruction-related |
Student support services |
Admin- |
Operations |
United States4 |
$424,562,095 |
|
$279,960,659 |
|
$22,106,046 |
|
$46,764,972 |
|
$75,730,418 |
|
|
65.9 |
5.2 |
11.0 |
17.8 |
|
|
|
|
|
|
|
|
|
|
|
|
|
|
|
|
Alabama |
5,164,406 |
|
3,294,639 |
|
257,605 |
|
550,433 |
|
1,061,728 |
|
|
63.8 |
5.0 |
10.7 |
20.6 |
Alaska |
1,442,269 |
|
905,938 |
|
90,704 |
|
160,337 |
|
285,290 |
|
|
62.8 |
6.3 |
11.1 |
19.8 |
Arizona |
6,451,870 |
|
4,036,555 |
|
359,548 |
|
785,494 |
|
1,270,274 |
|
|
62.6 |
5.6 |
12.2 |
19.7 |
Arkansas |
3,546,999 |
|
2,362,466 |
|
160,385 |
|
395,658 |
|
628,490 |
|
|
66.6 |
4.5 |
11.2 |
17.7 |
California |
50,918,654 |
|
34,202,470 |
|
2,343,885 |
|
6,268,047 |
|
8,104,253 |
|
|
67.2 |
4.6 |
12.3 |
15.9 |
|
|
|
|
|
|
|
|
|
|
|
|
|
|
|
|
Colorado |
5,994,440 |
|
3,696,273 |
|
260,673 |
|
1,029,484 |
|
1,008,010 |
|
|
61.7 |
4.3 |
17.2 |
16.8 |
Connecticut |
7,080,396 |
|
4,739,477 |
|
409,057 |
|
704,103 |
|
1,227,758 |
|
|
66.9 |
5.8 |
9.9 |
17.3 |
Delaware |
1,299,349 |
|
788,243 |
|
61,864 |
|
176,405 |
|
272,837 |
|
|
60.7 |
4.8 |
13.6 |
21.0 |
District of Columbia6 |
1,023,952 |
|
621,744 |
|
52,689 |
|
139,016 |
|
210,504 |
|
|
60.7 |
5.1 |
13.6 |
20.6 |
Florida |
19,042,877 |
|
12,422,342 |
|
914,900 |
|
1,862,376 |
|
3,843,260 |
|
|
65.2 |
4.8 |
9.8 |
20.2 |
|
|
|
|
|
|
|
|
|
|
|
|
|
|
|
|
Georgia |
12,528,856 |
|
8,568,112 |
|
586,475 |
|
1,313,389 |
|
2,060,880 |
|
|
68.4 |
4.7 |
10.5 |
16.4 |
Hawaii6 |
1,648,086 |
|
1,077,212 |
|
181,120 |
|
167,654 |
|
222,100 |
|
|
65.4 |
11.0 |
10.2 |
13.5 |
Idaho |
1,618,215 |
|
1,068,518 |
|
90,584 |
|
160,089 |
|
299,025 |
|
|
66.0 |
5.6 |
9.9 |
18.5 |
Illinois |
18,658,428 |
|
11,950,659 |
|
1,178,623 |
|
2,224,789 |
|
3,304,357 |
|
|
64.0 |
6.3 |
11.9 |
17.7 |
Indiana |
9,108,931 |
|
5,800,754 |
|
404,748 |
|
1,064,133 |
|
1,839,296 |
|
|
63.7 |
4.4 |
11.7 |
20.2 |
|
|
|
|
|
|
|
|
|
|
|
|
|
|
|
|
Iowa |
3,808,200 |
|
2,512,112 |
|
221,575 |
|
425,324 |
|
649,189 |
|
|
66.0 |
5.8 |
11.2 |
17.0 |
Kansas |
3,718,153 |
|
2,375,938 |
|
214,352 |
|
440,102 |
|
687,761 |
|
|
63.9 |
5.8 |
11.8 |
18.5 |
Kentucky |
4,812,591 |
|
3,158,984 |
|
190,807 |
|
482,179 |
|
980,621 |
|
|
65.6 |
4.0 |
10.0 |
20.4 |
Louisiana |
5,554,766 |
|
3,619,891 |
|
242,499 |
|
570,091 |
|
1,122,285 |
|
|
65.2 |
4.4 |
10.3 |
20.2 |
Maine |
2,056,266 |
|
1,440,219 |
|
71,837 |
|
187,366 |
|
356,844 |
|
|
70.0 |
3.5 |
9.1 |
17.4 |
|
|
|
|
|
|
|
|
|
|
|
|
|
|
|
|
Maryland |
8,682,586 |
|
5,819,946 |
|
372,285 |
|
881,009 |
|
1,609,347 |
|
|
67.0 |
4.3 |
10.1 |
18.5 |
Massachusetts |
11,357,857 |
|
7,773,472 |
|
695,371 |
|
1,031,206 |
|
1,857,807 |
|
|
68.4 |
6.1 |
9.1 |
16.4 |
Michigan |
16,353,921 |
|
10,097,420 |
|
1,176,858 |
|
2,123,254 |
|
2,956,390 |
|
|
61.7 |
7.2 |
13.0 |
18.1 |
Minnesota |
7,310,284 |
|
5,083,615 |
|
202,668 |
|
724,630 |
|
1,299,371 |
|
|
69.5 |
2.8 |
9.9 |
17.8 |
Mississippi |
3,243,888 |
|
2,095,539 |
|
155,281 |
|
349,193 |
|
643,875 |
|
|
64.6 |
4.8 |
10.8 |
19.8 |
|
|
|
|
|
|
|
|
|
|
|
|
|
|
|
|
Missouri |
7,115,207 |
5 |
4,646,302 |
5 |
341,734 |
|
760,012 |
|
1,367,158 |
|
|
65.3 |
4.8 |
10.7 |
19.2 |
Montana |
1,193,182 |
|
773,891 |
|
63,976 |
|
132,001 |
|
223,313 |
|
|
64.9 |
5.4 |
11.1 |
18.7 |
Nebraska |
2,512,914 |
|
1,679,381 |
|
105,770 |
|
266,623 |
|
461,140 |
|
|
66.8 |
4.2 |
10.6 |
18.4 |
Nevada |
2,722,264 |
|
1,804,602 |
|
102,148 |
|
355,783 |
|
459,731 |
|
|
66.3 |
3.8 |
13.1 |
16.9 |
New Hampshire |
2,021,144 |
|
1,371,613 |
|
136,131 |
|
197,005 |
|
316,396 |
|
|
67.9 |
6.7 |
9.7 |
15.7 |
|
|
|
|
|
|
|
|
|
|
|
|
|
|
|
|
New Jersey |
19,669,576 |
|
12,298,586 |
|
1,765,683 |
|
1,940,819 |
|
3,664,488 |
|
|
62.5 |
9.0 |
9.9 |
18.6 |
New Mexico |
2,554,638 |
|
1,548,816 |
|
252,900 |
|
282,543 |
|
470,380 |
|
|
60.6 |
9.9 |
11.1 |
18.4 |
New York |
38,866,853 |
|
27,783,425 |
|
1,296,215 |
|
3,477,384 |
|
6,309,829 |
|
|
71.5 |
3.3 |
8.9 |
16.2 |
North Carolina |
9,567,000 |
|
6,258,405 |
|
519,334 |
|
1,126,028 |
|
1,663,233 |
|
|
65.4 |
5.4 |
11.8 |
17.4 |
North Dakota |
786,870 |
|
488,539 |
|
32,582 |
|
94,779 |
|
170,969 |
|
|
62.1 |
4.1 |
12.0 |
21.7 |
|
|
|
|
|
|
|
|
|
|
|
|
|
|
|
|
Ohio |
17,167,866 |
|
10,911,563 |
|
1,027,655 |
|
2,333,799 |
|
2,894,848 |
|
|
63.6 |
6.0 |
13.6 |
16.9 |
Oklahoma |
4,161,024 |
|
2,530,263 |
|
272,724 |
|
467,736 |
|
890,301 |
|
|
60.8 |
6.6 |
11.2 |
21.4 |
Oregon |
4,458,028 |
|
2,791,001 |
|
305,938 |
|
629,500 |
|
731,590 |
|
|
62.6 |
6.9 |
14.1 |
16.4 |
Pennsylvania |
18,711,100 |
|
12,261,431 |
|
899,572 |
|
2,036,194 |
|
3,513,903 |
|
|
65.5 |
4.8 |
10.9 |
18.8 |
Rhode Island |
1,825,900 |
|
1,220,392 |
|
185,055 |
|
159,283 |
|
261,170 |
|
|
66.8 |
10.1 |
8.7 |
14.3 |
|
|
|
|
|
|
|
|
|
|
|
|
|
|
|
|
South Carolina |
5,312,739 |
|
3,497,602 |
|
366,397 |
|
517,064 |
|
931,676 |
|
|
65.8 |
6.9 |
9.7 |
17.5 |
South Dakota |
916,563 |
|
573,805 |
|
50,768 |
|
113,788 |
|
178,201 |
|
|
62.6 |
5.5 |
12.4 |
19.4 |
Tennessee |
6,446,691 |
5 |
4,520,120 |
5 |
215,183 |
|
588,292 |
|
1,123,096 |
|
|
70.1 |
3.3 |
9.1 |
17.4 |
Texas |
31,919,107 |
|
20,834,306 |
|
1,558,221 |
|
3,445,678 |
|
6,080,903 |
|
|
65.3 |
4.9 |
10.8 |
19.1 |
Utah |
2,627,022 |
|
1,790,045 |
|
96,842 |
|
250,461 |
|
489,674 |
|
|
68.1 |
3.7 |
9.5 |
18.6 |
|
|
|
|
|
|
|
|
|
|
|
|
|
|
|
|
Vermont |
1,177,478 |
|
796,236 |
|
85,113 |
|
133,150 |
|
162,980 |
|
|
67.6 |
7.2 |
11.3 |
13.8 |
Virginia |
10,705,162 |
|
7,246,422 |
|
508,516 |
|
958,018 |
|
1,992,206 |
|
|
67.7 |
4.8 |
8.9 |
18.6 |
Washington |
7,870,979 |
5 |
5,043,563 |
5 |
494,930 |
|
896,629 |
|
1,435,857 |
|
|
64.1 |
6.3 |
11.4 |
18.2 |
West Virginia |
2,527,767 |
|
1,616,037 |
|
88,866 |
|
244,826 |
|
578,038 |
|
|
63.9 |
3.5 |
9.7 |
22.9 |
Wisconsin |
8,435,359 |
|
5,604,793 |
|
386,464 |
|
1,044,702 |
|
1,399,400 |
|
|
66.4 |
4.6 |
12.4 |
16.6 |
Wyoming |
863,423 |
|
556,980 |
|
50,936 |
|
97,119 |
|
158,388 |
|
|
64.5 |
5.9 |
11.2 |
18.3 |
|
|
|
|
|
|
|
|
|
|
|
|
|
|
|
|
Other jurisdictions |
|
|
|
|
|
|
|
|
|
|
|
|
|
|
|
American Samoa |
58,163 |
|
33,830 |
|
2,476 |
|
4,259 |
|
17,597 |
|
|
58.2 |
4.3 |
7.3 |
30.3 |
Guam |
— |
|
— |
|
— |
|
— |
|
— |
|
|
— |
— |
— |
— |
Northern Mariana Islands |
58,400 |
|
49,229 |
|
1,053 |
|
4,427 |
|
3,691 |
|
|
84.3 |
1.8 |
7.6 |
6.3 |
Puerto Rico |
2,865,945 |
|
2,152,924 |
|
59,328 |
|
113,457 |
|
540,235 |
|
|
75.1 |
2.1 |
4.0 |
18.9 |
U.S. Virgin Islands |
137,793 |
|
94,849 |
|
7,989 |
|
17,134 |
|
17,822 |
|
|
68.8 |
5.8 |
12.4 |
12.9 |
— Not available. |
|
|
|
||||||||||||
1Include instruction, instruction-related, support services, and other elementary/secondary current expenditures, but exclude expenditures on capital outlay, other |
|||||||||||||||
programs, and interest on long-term debt. |
|
|
|
|
|
|
|
|
|
|
|
|
|
|
|
2Include salaries and benefits for teachers, teaching assistants, librarians and library aides, in-service teacher trainers, curriculum development, student |
|
||||||||||||||
assessment, technology, and supplies and purchased services related to these activities. |
|
|
|
|
|
|
|
|
|||||||
3Include attendance and social work, guidance, health, psychological services, speech pathology, audiology, and other student support services. |
|
|
|||||||||||||
4U.S. totals include the 50 states and the District of Columbia. |
|
|
|
|
|
|
|
|
|
|
|
|
|||
5Value affected by redistribution of reported values to correct for missing data items. |
|
|
|
|
|
|
|
|
|||||||
6Both the District of Columbia and Hawaii have only one school district each; therefore, neither is comparable to other states. |
|||||||||||||||
NOTE: Detail may not sum to totals because of rounding. |
|||||||||||||||
SOURCE: U.S. Department of Education, National Center for Education Statistics, Common Core of Data (CCD), "National Public Education Financial Survey (NPEFS)," fiscal year 2005, Version 1a. |
|||||||||||||||
F.3. Survey Form
This Part included a printout of the NPEFS web form because the survey form includes definitions of the items and is more usable for this survey than the record layout would be. Refer to PDF files of National Public Education Finance Survey, labeled OMB CCD, Part F3.

SECTION 8 |
XVI. Expenditures from the American Recovery and Reinvestment Act of 2009 [Include expenditures for the fiscal year from funds received (either directly or through other agencies) from the ARRA funds.]
|
Current Amount |
Flag |
1. Current expenditures for public elementary-secondary education instruction [Include function 1000, objects 100-600, 810, and 890] |
|
|
2. Direct Support, state payments for and on behalf of school districts, not reported above |
|
|
3. Total current expenditures for public elementary-secondary education [Include functions 1000, 2000, 3100, 3200, objects 100-600, 810, and 890] |
|
|
4. Current expenditures for community services, adult education and other programs outside of public elementary-secondary education [Include programs 500, 600, 700, 800]. |
|
|
5. Property expenditures [Include functions 1000-3200, object 700]. |
|
|
6. School construction expenditures [Include function 4000, all objects]. |
|
|
7. Expenditures from ARRA for Title I and Title V, Part A reported under part XII. Exclusions from Current Expenditures for State per Pupil Expenditures.
|
|
|
| File Type | application/msword |
| File Title | Part F |
| Author | barbara.spinner |
| Last Modified By | #Administrator |
| File Modified | 2009-10-07 |
| File Created | 2009-10-07 |
© 2026 OMB.report | Privacy Policy