Appendixes with A-1 FT results
Att_ECLS-K (4226) Appendix A.1 FT Science results.doc
Early Childhood Longitudinal Study Kindergarten Class of 2010-2011
Appendixes with A-1 FT results
OMB: 1850-0750
TO: Alberto Sorongon, Karen Tourangeau, Christine Nord, WESTAT
FROM: Michelle Najarian, Judy Pollack, ETS
DATE: January 10, 2010
SUBJECT: Recommended Rounds for Assessing Science in the ECLS-K:11
The purpose of this memo is to provide recommendations for assessing science in the fall kindergarten, spring kindergarten, fall first grade, spring first grade, and/or spring second grade rounds of the ECLS-K:11. The background of why this early analysis was done and the types of analyses will be discussed, followed by the analysis results, recommendation, and next steps.
Background
During the field test assessment development, questions arose from NCES regarding the appropriateness of a science assessment in the grades prior to third grade, when the ECLS-K children were first assessed in science only. A general knowledge assessment was administered in kindergarten and first grade in the original ECLS-K study, incorporating a mix of items from both the social studies and science domains. The move from a general knowledge to a science-only assessment in third grade in the ECLS-K resulted in a disconnect in longitudinal measurement in science, thus, the initial recommendation for the ECLS-K:11 was to assess children in science from the base year in order to have data across all rounds. NCES questioned measurement of science at the earliest grade levels, but state-standards reviewed during the framework design indicated that assessment at those grade levels was appropriate, based on the commonality of state standards. It was agreed that the field test would proceed as planned, assessing children beginning in kindergarten, and that the field test results would inform a decision whether or not to assess in the national administration.
Analysis
We used two approaches in the initial analysis of the field test item data for science: classical item analysis and Item Response Theory (IRT), both providing information on item difficulty and the relationship of individual items to the construct as a whole. (DIF was not used here since performance by subgroups was not needed in determining the appropriate grade level to assess.)
Classical item analysis includes the percent correct (P+) for each item, the correlation of performance on each item to performance on the test as a whole (r-biserial), omit rates, and distracter analysis (number and overall test performance for children choosing each response option for multiple choice items, or for children answering right/wrong for open ended items), as well as the internal consistency (alpha coefficient) for the set of items. Strengths of item analysis include the possibility of identifying weak distracters (i.e., options chosen by very few test takers), multiple keys (more than one correct or nearly correct answer), or items omitted by unusually high numbers of children. It also makes it possible to observe whether a response option designated as incorrect may be chosen by test takers who scored as high or higher, on average, on the test as a whole than did the group choosing the intended correct answer. This situation would result in a low or negative r-biserial, that could be an indicator of confusing or ambiguous language or presentation that may be causing children to misunderstand the intent of the question, or a different and equally correct interpretation not anticipated by the item writer.
A limitation of classical item analysis is that statistics are distorted by treatment of omits, whether they are included or excluded from the denominator of the percent correct. Including omits implicitly makes the assumption that ALL children who omitted an item would have gotten it wrong if they had attempted it, while excluding omits from P+ is equivalent to assuming that the same proportion of children who omitted would have given a correct answer. Neither assumption is likely to be true. Even if there are negligible numbers of omits, percent correct does not tell the whole story of item difficulty: all other things being equal, a multiple choice item will tend to have a higher percent correct than a comparable open ended item because of the possibility of guessing. R-biserials provide a convenient measure of the strength of the relationship of each item to the total construct, but they too are affected by omits. The P+ and r-biserial reported in classical item analysis contribute to an overall evaluation of a test item, but may be attenuated for items that perform well at one level of ability but not another.
Even with its limitations, however, classical item analysis provides an overview of the item quality and overall assessment consistency as well as details. It provides a look at the functioning of each individual response option, as opposed to IRT, which only considers whether the correct option was chosen. And when coupled with IRT analysis, which accounts for omits and the possibility of guessing, and shows the ability levels at which an item performs well, the result is a comprehensive assortment of statistics for item and assessment evaluation.
PARSCALE is the IRT program used for calibrating test takers’ ability levels on a common scale regardless of the assortment of items administered. The graphs (item characteristic curves) generated in conjunction with PARSCALE are a visual representation of the fit of the IRT model to the data. The IRT difficulty parameter ("b") for each item is on the same scale as the ability estimate (theta) for each child, allowing for matching a set of test items to the range of ability of sampled children. The IRT ("a") parameter, "discrimination" is analogous to the r-biserial of classical item analysis. IRT output includes a graph visually illustrating performance on the item for children at different points across the range of ability.
We evaluated item quality and potential for use in the early grade test forms by reviewing all of the available information for each item, including:
Difficulty: Matching the difficulty of the test questions to the expected range of ability that will be found in the fall 2010 and subsequent administrations; avoiding floor and ceiling effects.
Test Specifications: Matching as closely as possible the target percentages of content categories.
Psychometric Characteristics: Selecting items that do a good job of discriminating among achievement levels.
Linking: Having sufficient overlap of items shared among forms and across grade levels so that a stable scale can be established for measuring status and gain, as well as having an adequate number of items carried over from the ECLS-K to permit cross-cohort comparisons.
Assessor Feedback: Considering observations made by the field staff on the item functioning.
Measurement of Gain: Evaluating whether performance improved in subsequent years.
For example, an item with P+ = .25 (a quarter of children answering correctly) and IRT b=2.0 would appear to be a hard item, potentially suitable for a higher grade or a hard-level test form. But a low r-biserial (below about 0.30) or a relatively flat IRT "a" parameter (below 0.50 or so), suggest a weak relationship between the item and the test as a whole. In other words, while the item is hard, it is not useful in differentiating different levels of science skills because it is about equally difficult for low-ability and high-ability students.
Pooling Data and Samples
In order to measure each child's status accurately, it is important that each child receive a set of test items that is appropriate to his or her skill level. Selection of potential items brings together two sets of information: the difficulty parameters for each of the items in the pool, and the range of ability expected in the each round. Calibration of these two pieces of information on the same scale, so that they may be used in conjunction with each other, was accomplished by means of Item Response Theory (IRT) analysis. (In-depth discussions of the application of IRT to longitudinal studies may be found in the ECLS-K psychometric reports.)
IRT calibration was carried out by pooling the following datasets together:
ECLS-K:11 fall kindergarten field test (approximately 450 cases)
ECLS-K:11 fall first grade field test (approximately 400 cases)
ECLS-K:11 fall second grade field test (approximately 300 cases)
ECLS-K:11 fall third grade field test (approximately 170 cases)
ECLS-K fall kindergarten national - items selected from general knowledge assessment (approximately 18,000 cases)
ECLS-K spring kindergarten national - items selected from general knowledge assessment (approximately 19,000 cases)
ECLS-K fall first grade national - items selected from general knowledge assessment (data collected only for a subsample of about 5,000)
ECLS-K spring first grade national - items selected from general knowledge assessment (approximately 16,000 cases)
ECLS-K spring third grade national (approximately 14,000 cases)
The overlapping items shared by two or more datasets serve as an anchor, so that parameters for items and samples from different assessments are all on a common scale. Data from the ECLS-K:11 field test supplies a link between the newly-developed field test items and the ECLS-K kindergarten/first grade and third-grade assessments, enabling them to be put on the common scale necessary for direct comparisons. The large samples from the ECLS-K data collections also serve to stabilize parameter estimates that would be unreliable if only the small sample of the fall 2009 field test was available.
Pooling the datasets together also provides estimated values for the mean ability levels for each dataset on the same scale. Although the datasets are pooled together, the samples are treated separately to preserve the ability ranges of each dataset. Mean ability levels for each of the datasets above were calculated from the pooled sample. Therefore an estimated ability range for the target administrations (fall and spring kindergarten, fall and spring first grade, and spring second grade) can be determined (see Results below).
Results
As discussed above, the items were reviewed based on all of the available information. Upon review, it became apparent that assessing children in science in fall kindergarten was not necessarily appropriate for the K:11, as illustrated by the item characteristic curves for a majority of the items. For items administered at the other grade levels, the majority functioned well and thus provides an adequate pool from which to build test forms at these levels, as well as justification to assess at these levels in the national administration.
The following discussion of the results utilizes item characteristic curves that show the IRT results for some sample items. On the graphs, the horizontal axis corresponds to the estimated ability level, Theta, of students in the sample. The vertical axis, Probability, is the proportion of test takers answering correctly at each ability level. The colored triangles and squares show the actual percent correct (P+) for the field test participants in different grades, while the smooth S-shaped curve shows the estimated percent correct at each ability level derived from the IRT model. The A, B, and C parameters that define the shape of the curve (left-to-right location; steepness; asymptotes) are computed by the Parscale program as the best fit to the actual item response data.
To first illustrate a sample of items that functioned well, Figures 1-3 show examples of items that are appropriate for kindergarten and first grades (1); first-, second-, and third-grades (2); and second- and third-grades (3).
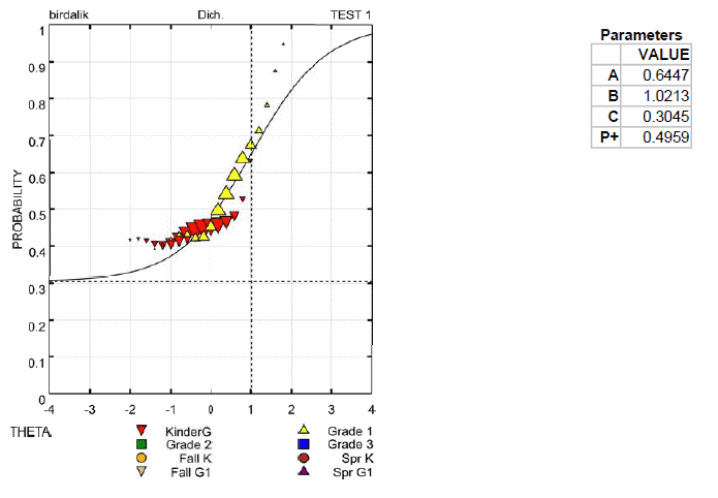
In Figure 1, the IRT-estimated continuous S-shaped curve whose shape is defined by the A, B, and C parameters closely tracks the actual proportion correct for field test kindergarten children (red triangles) and first graders (yellow triangles) across most of the ability range. For example, for children with theta (ability level) of 0 on the horizontal axis, the model predicts that about 75% will answer correctly, and that corresponds well to the actual performance of both the kindergarten and first grade children. For ability levels above 1.0, nearly all children would be expected to answer this item correctly, so it would not be a useful item on a test form to be administered to children whose ability would be likely to be above 1.0.1
In Figure 2, for field test first graders (yellow triangles), second graders (green squares), and third graders (blue squares), higher estimated ability corresponded closely to increases in percent correct on this item. But the majority of kindergarten children were able to do no better than guessing at the correct answer, and in the range of theta = -2 to theta = 0 there was no upward trend indicating that higher ability students were more likely to answer correctly than those of lower ability. Only for theta greater than 0 were kindergarten children starting to do better on this item, and even at this higher range, they were less likely to answer correctly than children of the same ability in higher grades. This is shown by the red triangles in the range above theta = 0 being below the curve fit to the grade 1, 2, and 3 data.
In Figure 3, almost no kindergarteners answered this item correctly: all of the red triangles are close to 0 on the probability axis. All of the yellow triangles below theta=1 are also close to 0 probability of a correct answer. The item relied heavily on understanding somewhat complex text. Third graders were more likely than predicted (that is, on the basis of their overall ability estimate) to understand and answer correctly, as shown by the blue boxes falling above the IRT-estimated curve.
At the recommended grade levels, each of these items shows data and model curves with steep slopes (“a” parameters at or greater than 1.0) and measured ability levels increasing with increased grade level (i.e., children at higher grade levels with lower thetas have the same probability of a correct response as children at lower grade levels with higher thetas). Review of the classical item analysis results (r-biserials, distracters, etc.) confirmed that these items were all functioning well in the assessment. And these figures show just a sample of the difficulty levels (“b” parameters) available for the field-tested items.
At the kindergarten level, however, more often than not, items showed inconsistent behavior in relation to what was expected and to the other grade levels. Figures 4-7 illustrate a few examples of issues found in many of the items assessed in kindergarten.
For example, in some cases the item was just too difficult for kindergarten. In Figure 4, kindergarten children (red triangles) at all ability levels until the very highest were able to do no better than guessing on this item. The word “spiral” probably was just not familiar to them. First graders above theta = 0 had a response pattern with increasing probability of a correct answer tracking increase in estimated overall ability.
Another set of items showed that the kindergarten data was not consistent with data on the same item for first-graders . Figure 5 shows that for children in different grades who were estimated to have the same overall ability level, first graders were much more likely to give a correct answer than were kindergarteners. For example, at theta = -.3771 (the vertical dashed line in the graph), about 50% of kindergarteners, but almost 80% of first graders of this ability level got the item right. While both grades showed a trend toward better performance at higher ability levels, the inconsistency in P+ would make this item useless for measuring gain.
Similar behavior was seen with the item characteristic curve illustrated in Figure 6. This item performed well for grades 1, 2, and 3, with increases in estimated ability corresponding to a higher proportion of correct answers. This was not true for kindergarteners. At all ability levels, about 55 to 60% of children answered correctly, meaning that this item would not be useful in estimating ability for kindergarteners. It is interesting that below theta = 0 or so, the percent correct for kindergarteners is higher than that for the other grades. This could simply be because the correct response (“star”) was a word that was familiar to kindergarteners while the other options (galaxy, moon, and planet) were not. It does not necessarily indicate that more kindergarteners at the low ability levels knew that the sun is a star.
In Figure 7, the kindergarten children are guessing across the ability range, and this is negatively impacting the model by reducing the slope. If the kindergarten data was removed (i.e., the item was not administered in kindergarten), the model slope would be steeper and the model fit to the data (in first grade only) would be improved.
The pattern of performance illustrated in Figures 4-7 was consistent across many of the items assessed in kindergarten.
Recommendation
Based on the field test analysis findings, assessing children in fall kindergarten does not seem worthwhile. Although some items did function well in kindergarten, the number of items was quite limited, and not enough to justify recommending a fall kindergarten assessment. Moreover, the items that did have acceptable performance were predominantly Life Science items, with only a few successful Physical Science and almost no Earth Science items. This would make it impossible to select a set of items for a full-scale kindergarten science assessment consistent with the test framework. For the other grade levels, there were an adequate number of items in each category that functioned well, thus, we recommend developing the proposed 2-stage assessments for first-, second-, and third-grades.
With this recommendation, however, we would only begin collecting science data on a sub-sample of the ECLS-K:11 in fall first grade. Therefore, we are also recommending a limited, approximately 15-20-item single-stage test in spring kindergarten. This smaller assessment will permit measurement on the entire sample, on a limited set of items, appropriate for spring kindergarten, and will calibrate with subsequent rounds of science data collection, thus providing an early data point in science.
Next Steps
Upon receiving approval for these recommendations (or after subsequent revisions), we will proceed with selecting items for the spring kindergarten shortened assessment, as well as the two-stage assessments for first-, second-, and third grades. Delivery of the item selections will include a descriptive memo describing the analysis methods used, target ability and difficulty ranges, item overlap, and consistency with the framework.
Figure 1: Item SK1F120 - Item appropriate for kindergarten and first grade
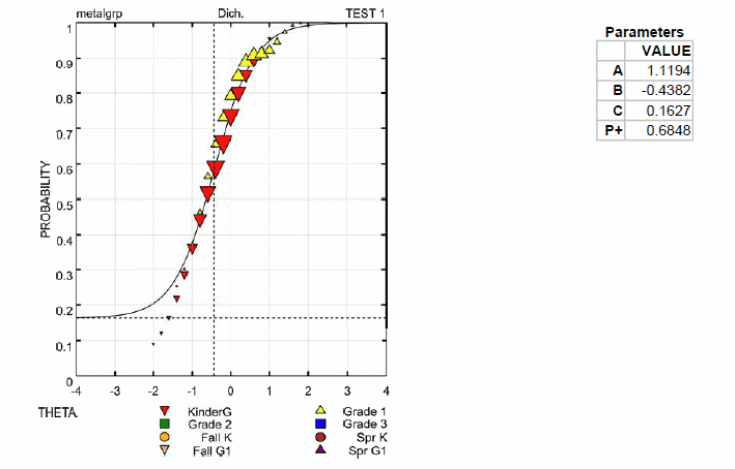
Figure 2: Item SK1F143 - Item more appropriate for first-, second-, and third-grades; difficult for kindergarten
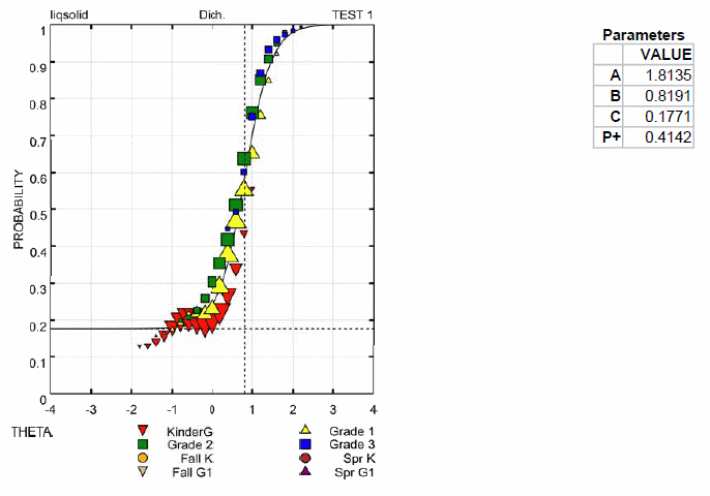
Figure 3: Item SK1F225 – Item more appropriate for second- and third-grades; too difficult for kindergarten and first grade

Figure 4: Item SK1F205 – Item too difficult for kindergarten
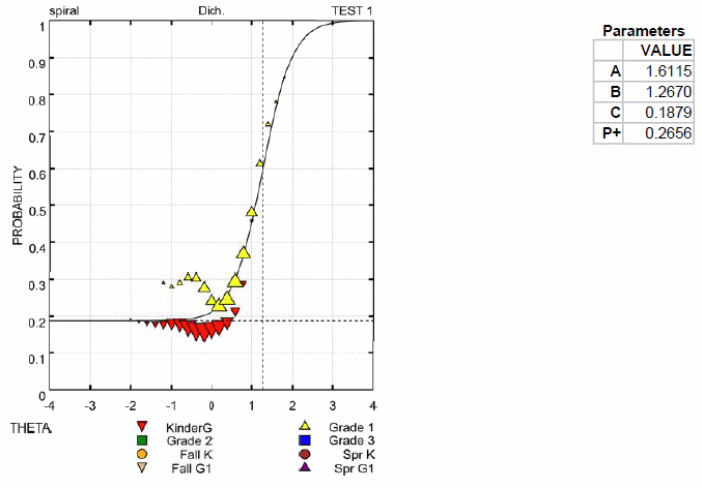
Figure 5: Item SK1F107 – Item data not common functioning in kindergarten and first grade
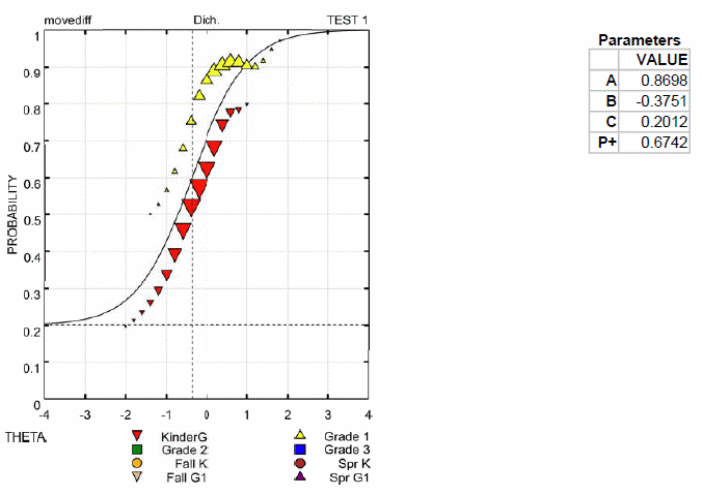
Figure 6: Item SK1F252 – Item data common functioning for first-, second-, and third-grades but not for kindergarten
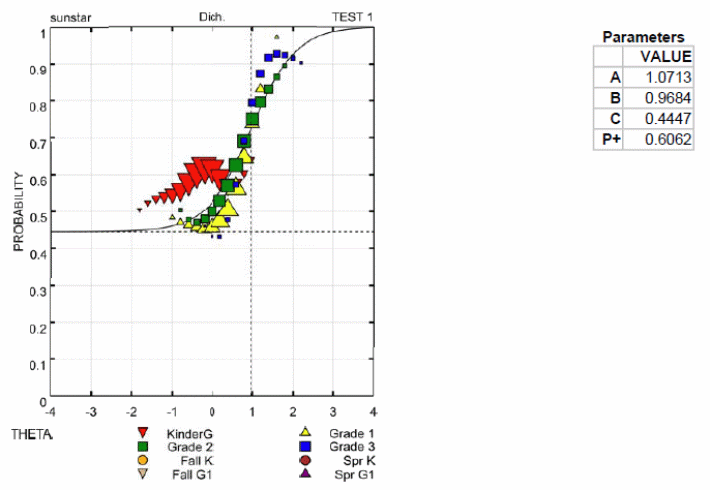
Figure 7: Item SK1F122 – Item non-discriminating at the kindergarten level and removal of such would improve model fit for first grade at the higher ability levels
1 The mean ability levels for the ECLS-K:11 fall field test samples for kindergarten, first-, second-, and third-grades were -0.34, 0.29, 0.51, and 1.03, respectively.
| File Type | application/msword |
| File Title | TO: |
| Author | Michelle A Najarian |
| Last Modified By | #Administrator |
| File Modified | 2010-02-11 |
| File Created | 2010-02-11 |
© 2026 OMB.report | Privacy Policy