IPEDS Resolution Memo of Finance Data Quality Study - no links
IPEDS Resolution memo of Finance Data Quality study_no links.doc
Integrated Postsecondary Education Data System
IPEDS Resolution Memo of Finance Data Quality Study - no links.doc
OMB: 1850-0582
interoffice memorandum
The following memorandum outlines the background and rationale for the finance data quality study, summarizes the methodology, outlines the problems found in the study, presents unadjusted statistics that prove useful in understanding data quality issues within the study sample, and offers conclusions and recommendations for methods of improving aspects of the IPEDS Finance collection.
Background and rationale
A number of changes to IPEDS Finance surveys impelled an assessment of the quality of the data. These changes include the migration of the IPEDS collection system entirely to the web, enabling multiple related institutions to report as single units, and modifying the finance collection to reflect developments in financial accounting standards.
Although the financial data contained in financial statements is expected to be consistent with the data reported in IPEDS, discrepancies may occur for a number of reasons. Simple clerical errors and incorrect interpretation of instructions are common to all survey responses. However, other sources of discrepancies cannot be attributed to human error, such as inconsistencies in definitions, different levels of aggregation, and different time period of reporting. NCES has developed procedures to minimize these discrepancies, such as the implementation of edit checks in the web survey to catch transcription errors, careful attention to clarifying survey instructions, and specially crafted definitions to achieve standard terminology. In addition, other reporting problems unique to higher education finance have been addressed by NCES, such as inconsistent units of analysis and multiple accounting standards.
Inconsistent units of analysis
Whether reporting under FASB or GASB standards, the inconsistent units of analysis for audits may be problematic due to the possibility that multiple institutions are covered under a single audit. For example, a state university system may be audited as a whole, maintaining a single set of financial records for the complete system; or several beauty schools may be owned by one entity and audited together as one company. These individual institutions operate under separate Program Participation Agreements with the Department of Education, requiring individual Finance survey data submissions. Separate revenue, expense, and scholarship data reporting have not traditionally been a problem for these types of institutions, but reporting assets, liabilities and equity (or net assets) can make completion of the Finance survey difficult. In some instances, duplicate data were submitted for each school within a system or corporate entity on the Finance survey, and as a result, artificially inflating national, state, or system totals.
To correct this potential problem, NCES enabled institutions to report, beginning with the 2004 data collection, jointly audited data. For these jointly audited institutions, one institution (such as the system office) designates itself to report for the group of institutions (such as the main campus). If jointly audited institutions operate under a single Program Participation Agreement (PPA), the system may report consolidated data. Jointly audited institutions that operate under separate PPA are allowed to report the Statement of Net Assets (or Balance Sheet) together as a system, but each individual institution must report revenues, expenses, and student aid data.
Multiple accounting standards
Because public and private postsecondary institutions use different accounting standards, the IPEDS finance uses different collection forms suggested by two different generally accepted accounting principles: 1) the Governmental Accounting Standards Board (GASB) and 2) the Financial Accounting Standards Board (FASB). Used by local and state government, GASB is the reporting standard followed by most public institutions. FASB, on the other hand, is used by publicly owned firms, and therefore the standard used by private not-for-profit and private for-profit postsecondary institutions.
Because of the changes in accounting standards, different forms were designed for public, private not-for-profit, and private for-profit institutions. Until the 1997-98 collection, all institutions had used the same survey form. However, two new survey forms, one for private not-for-profit institutions and one for private for-profit institutions, were implemented in 1997-98 as a result of changes adopted by the FASB. Similarly, following changes adopted by the GASB, a new survey form for public institutions was phased into the collection over a three year period from 2002 to 2004.
While similarities exist between financial reporting under both GASB and FASB, there are differences between the accounting standards that obscure comparisons of similar institutions across reporting standards. For example, FASB does not consider operation and maintenance of plant as a separate functional expenditure, but rather allocates these expenses to the other functions such as instruction, research, public service, and academic support. However, GASB standards treat operation and maintenance of plant as a distinct functional category for reporting expenses. As a result of these different standards, an otherwise comparable institution reporting under FASB standards would have higher expenses in functions such as instruction expenses than an institution reporting by GASB standards.
Over the years, NCES has worked to improve the quality of information input into the IPEDS finance survey by addressing the causes of information inaccuracy. The purpose of this study is to assess the consistency between IPEDS data and institution financial statements.
Methodology of the Data Quality Study
In addition to reporting to IPEDS, Title IV postsecondary institutions are required by federal law to submit their financial statements to the Office of Federal Student Aid either through eZ-Audit and, in many cases, to the Federal Audit Clearinghouse in response to OMB Circular A-133 (Single Audit). An institution enters general and specific information about its compliance audits and financial statements on the appropriate eZ-Audit web pages.
Because institutions are instructed in IPEDS to report finances based on their statements, the statements provide a standard against which IPEDS data can be evaluated. With both the financial statement and IPEDS finance data available for Title IV institutions, this analysis was designed to compare selected variables of a sample of institutions in order to assess the quality of the data, to locate areas of misreporting, and to identify systemic reasons for misreported data. Official financial statements from fiscal year 2004 for sampled institutions were obtained from eZ-Audit and through the Federal Audit Clearinghouse.
Selection of variables
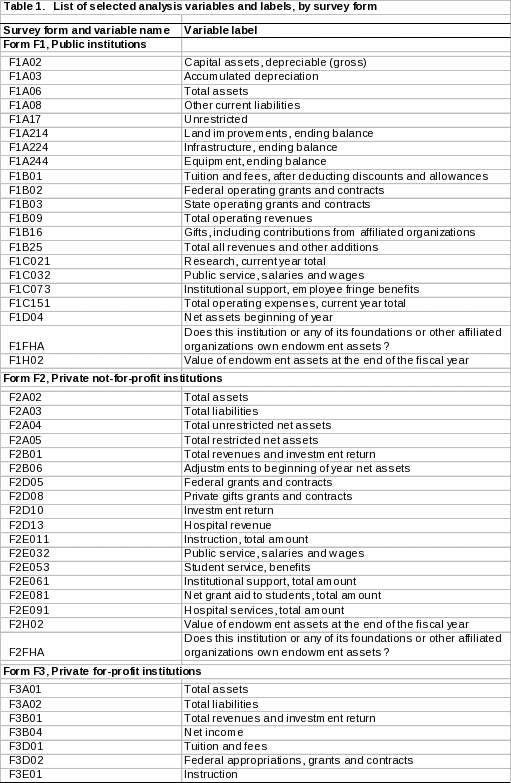
Excluding identification variables, the 2003-04 IPEDS finance surveys contain a combined total of 407 unique financial variables, with the form for public institutions (Form 1A) containing 179, the form for private not-for-profit institutions (Form 2) containing 183, and the form for private for-profit institutions (Form 3) containing 35 variables. In order to assess the quality of data across the different reporting standards, a subset of variables were chosen for analysis based on professional judgment.
Because the varying number of variables by form, a subset of variables was chosen from each form on a proportional basis using professional judgment. The selected variables contain a control group and a challenge group. The control group consists of variables that generally appear on most financial statements with similar titles, variables understood consistently across all types of reporting standards, and variables unlikely to be impacted by joint audits. Conversely, the challenge group consists of variables that may require calculation from multiple line items on the financial statement, variables found only in the footnotes of financial statements, or variables that would not apply to all institutions.
Table 1 contains a list of selected variable for analysis.
Sampling institutions
The target population of the IPEDS finance data quality study is defined as Title IV postsecondary institutions reporting finance data in fiscal year 2003-04. In order to sample Title IV institutions, the sampling frame was built by using the 2003-04 IPEDS Finance collection. The following conditions define an institution as being in scope for sampling:
the institution participates in Title IV federal financial aid programs;
the institution is public, private not-for-profit, or private for-profit;
the institution is neither a parent or child institution of another institution for the Finance component;
the institution is not an administrative unit;
the institution’s survey was completed, with final lock applied, before close of data collection;
the institution’s programs are known to be four or more years, at least 2 but more than 4 years, or less than 2 years; and
the institution has total revenues greater than zero1.
Of 6,916 institutions in the 2003-04 IPEDS collection, a total of 5,086 institutions (73.5 percent) were determined to be in scope and included on the frame. Total revenues added to $317,549,856,171, with a maximum of $6,518,195,000 and a minimum of $8,410.
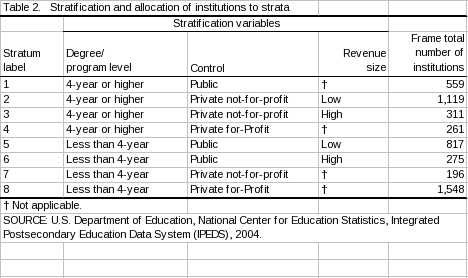
As shown in table 2, a stratified sample of 600 Title IV IPEDS institutions was selected for data validation. The institutions were stratified into one of eight domains based on their 2004 level, control, and revenue size criteria.
General Analytic Approach
Once the sample had been drawn from the frame and financial statement collected from eZ-audit, analysts compared the selected set of variables on the institution’s financial statement against the institution’s IPEDS response to decide whether or not the two sources of financial information matched. Comparisons of variables were considered a match if it met one of the following criteria:
the absolute value of the difference between IPEDS and the financial statement does not exceed $50;
the IPEDS value can be easily calculated from the financial statement with the absolute value of the difference between IPEDS and the financial statement not exceeding $50; or
the IPEDS and financial statement match within rounding criteria cited on the audited financial statement. For example, if an institution’s financial statement said that all dollar figures were rounded to the nearest $1,000, the IPEDS variable for that institution is expected to be similarly rounded and matching.
Guided by these criteria, auditors recorded matched and unmatched values, and evaluated the discrepancies to determine a cause and code the discrepancy accordingly. Reasons for discrepancies consisted of the following:
rounding to thousands;
rounding off decimals;
data entry error;
financial statement missing disclosures or statements;
category not reported separately;
incorrect inclusion of items;
incorrect exclusion of items;
incorrect inclusion and exclusion of items; and
unable to determine reason for exception.
Table 3 illustrates an institution comparison between IPEDS and the financial statement source.
Table 3. Example comparison between IPEDS and financial statement values of a GASB institution |
||||||
IPEDS variable |
IPEDS values |
Source values |
Differences |
Valid |
Comment(s) |
Code |
UNITID |
xxxx60 |
xxxx60 |
|
y |
|
|
F1A02 |
$52,238,072 |
$51,694,465 |
-$543,607 |
n |
Institution included capital assets not being depreciated. |
6 |
F1A03 |
30,818,809 |
30,818,809 |
|
y |
|
|
F1A06 |
42,263,335 |
42,263,335 |
0 |
y |
|
|
F1A08 |
5,243,448 |
5,243,448 |
0 |
y |
|
|
F1A17 |
10,520,073 |
10,520,073 |
0 |
y |
|
|
F1A214 |
543,607 |
9,863,844 |
9,320,237 |
n |
Institution did not include land improvements of $9,320,237. |
7 |
F1A224 |
9,320,237 |
0 |
-9,320,237 |
n |
Infrastructures were not reported on the f/s. Institution improperly included the balance of land improvements $9,320,237 on this line in the IPEDS database. |
6 |
F1A244 |
7,350,041 |
7,350,041 |
0 |
y |
|
|
F1B01 |
2,556,419 |
2,556,419 |
0 |
y |
|
|
F1B02 |
10,966,634 |
10,966,634 |
0 |
y |
|
|
F1B03 |
624,479 |
624,479 |
0 |
y |
|
|
F1B09 |
16,068,548 |
16,068,548 |
0 |
y |
|
|
F1B16 |
0 |
0 |
0 |
y |
|
|
F1B25 |
38,336,575 |
38,336,575 |
0 |
y |
|
|
F1C021 |
0 |
0 |
0 |
y |
|
|
F1C032 |
34,323 |
182,799 |
148,476 |
n |
Financial statement line item Public Services shows a balance of $182,799. Financial statement does not show a break-down for this line item. |
5 |
F1C073 |
633,186 |
4,628,658 |
3,995,472 |
n |
Financial statement line item Institutional support shows a balance of $4,628,658. Financial statement does not show a break-down for this line item. |
5 |
F1C151 |
36,956,986 |
36,956,986 |
0 |
y |
|
|
F1D04 |
24,876,605 |
24,876,605 |
0 |
y |
|
|
F1FHA |
1 |
1 |
0 |
y |
|
|
F1H02 |
574,606 |
574,606 |
0 |
y |
|
|
Analysis of data discrepancies
The comparisons were analyzed, tabulated, and presented by the two following units of analysis: 1) the institution, and 2) the data pair. By analyzing the institution as the unit of analysis, the summary involved assessing how many institutions had matching values for each variable, which were reported by institution characteristics, specifically by sampling domain and control of postsecondary institution.
Problems in the report
At the end of the contract (ED04C00018/0002), the deliverables consisted of a written summary report, SPSS datasets, supporting syntax, and summary Excel worksheets for each institution. Upon receipt, the publication was not ready for submission to NCES internal review, so the publication was assigned to ESSI for releasing the study as a methodological report.
Upon review of the document, ESSI outlined actions necessary to bring the report into compliance with IES statistical and publication standards. These steps included, but were not limited to, the following:
adding background material relevant to IPEDS Finance, such as general information on IPEDS collections, the differences between FASB and GASB accounting standards, and changes to the finance surveys over time;
adding explanatory information regarding the methodology of the study;
clarifying inconsistent use of terminology;
redesigning tables for clarity and for compliance with IES standards; and
adding findings, conclusions, and recommendations from the study.
During their attempts to verify estimates and findings in the report, ESSI raised additional concerns about the methodology and implementation of the study, which included the following:
the exclusion of institutions from the analysis due to missing financial statements created a nonresponse and potential nonresponse bias issue;
any attempts to measure and, if necessary, adjust for nonresponse bias required a single dataset containing all sampled institutions;
the SPSS datafiles were not delivered in a unified file, but in separate files; and
no file was provided for private for-profit institutions.
Therefore ESSI built a new unified SAS datafile based on the individual Excel worksheets of institutions. In order to be consistent with the original intent of analysis, new files were built from the Excel worksheets that included all observations regardless of institutional control. As quality control, ESSI used comparisons between the newly built files and the SPSS files to assure proper construction of a dataset. However, these quality control checks uncovered new discrepancies with the original Excel and SPSS files, such as, but not limited to, the following:
discrepant values between the Excel worksheet and the SPSS dataset;
observations with incorrect UNITID,
duplicate UNITID with conflicting financial values, and
inconsistent accounting codes for nonmatching data elements between IPEDS and the financial statements; and
inconsistent treatment of missing values and zeros.
Nonresponse and potential nonresponse bias
As stated above, the exclusion of 199 institutions (33 percent of the sample) created a nonresponse problem and introduced potential nonresponse bias. During the development of the study, it was expected that analysts would be able to obtain all financial statements for sampled institutions, but the eZ-Audit and Federal Audit Clearinghouse were not as exhaustive as expected. Analysts were able to obtain copies of the relevant financial statements directly from institutions, although not for all sampled institutions. Table 4 shows the final disposition of the sampled institutions across sampling stratum.
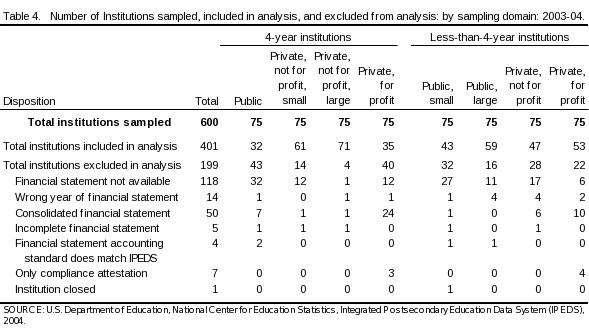
Even after institutions were contacted directly for more information, appropriate financial statements were only available for 401 institutions (67 percent of the sample). Of the 199 omitted institutions, 118 institutions (19.7 percent of the sample) were unavailable, 14 institutions provided the wrong fiscal year, and 50 institutions provided a consolidated financial statement; making comparison with IPEDS problematic at best and impossible in case of missing information. As a result, these 199 institutions were excluded from the analysis.
With 33 percent of the sample either missing financial statements or having incompatible financial statements, new analytical problems arose due to low response rates and potential non-response bias. NCES Statistical Standards state that a response rate less than 85 percent must be evaluated for the potential magnitude of nonresponse bias (Standard 4-4). Arguably, the inability of an institution to submit financial statements in accordance with department regulations may also correspond to an inability to report quality IPEDS data. If the omitted population were more likely to submit poorer quality data, this would suggest that any analysis done on the remaining 401 institutions would overestimate the quality of the IPEDS finance data, particularly when analyzing results by institutional control.
Termination of the data quality study
While many of these instances of error could be verified and corrected, the accrual of inconsistencies undermined the quality of the study. Due to the increasing number of issues, ESSI recommended backtracking to the beginning of the study to ensure proper data analysis and coding. However, documentation explaining analytical procedures and decisions were sparse, and the original authors of the report were no longer available to answer questions. In addition, enough time had elapsed since the sampling (fiscal year 2003-04) that the public (F1a) and private not-for-profit (F2) surveys had been redesigned upon recommendation of a technical review panel in January 2007. Any conclusions based on the study to assess the quality of IPEDS Finance would be difficult to disentangle from suspect quality of the report. Therefore, NCES decided to stop work on a publication of the Finance Data Quality study, but would attempt to extract any useful information from the process and the analysis for internal use to improve the instructions.
Unadjusted Findings
Despite the shortcomings in the study, useful information can be extracted. Because the following statistics are only representative of the sample, the reader should be cautiously slow to infer any findings to the population.
Nevertheless, table 5 displays the findings of the data quality study by sampling domain. Of 5,086 institutions in the Title IV target population, 600 institutions were sampled and 401 institutions were analyzed.
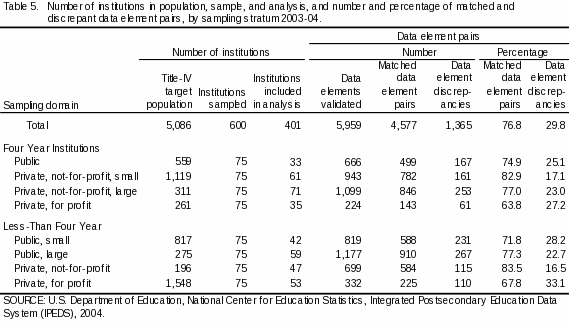
Of the 401 institutions that formed the basis of the study, analysts compared 5,959 data elements between IPEDS and the corresponding financial statement. Overall, 4,577 data elements were found to match (76.8 percent) and 1,365 (29.8 percent) were found to be discrepant. When separated by the eight domains used in sample stratification, the percent of data elements found to match ranged from 63.8 percent in 4-year, private for-profit institutions to 83.5 percent in less-than-4-year, private not-for-profit institutions.
However, discrepancy between IPEDS and the financial statements should not be equated with error. As part of the study, analysts attempted to find reasons for any discrepancies.
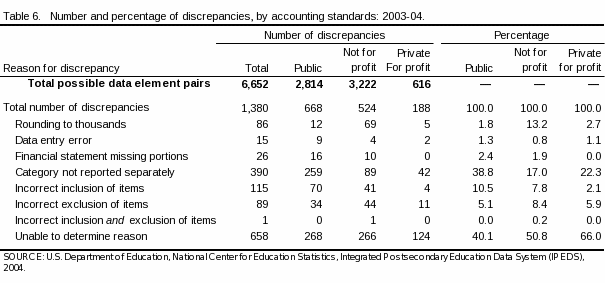
Table 6 displays the reasons for discrepancies across institutional control, some of which are not a result of error such as the corresponding category not reported separately in the financial statements. 28 percent of discrepancies resulted from the lack of the financial statements reporting the category separately, likely explained by respondents using internal documentation to report financial activity to IPEDS. When analyzing these results by institutional control, public institutions constituted a larger percentage of discrepant data elements due the lack of financial statements reporting the category separately (39 percent) compared to private institutions (17 percent in private not-for-profits and 22 percent in private for-profits). In this case, the inability to match the data item back to the financial statement does not reveal error, only the lack of detailed reporting in financial statements.
However, more than half of the discrepant data element pairs can be attributed to error in reporting. While analysts were unable to determine the cause for discrepancies for 48 percent of all nonmatching data elements, 15 percent could be attributed to the incorrect exclusion or inclusion of items in the correct category. Six percent were due to improper rounding, and 1 percent were due to data entry errors.
Conclusions and recommendations
Even though these statistics are only representative of the sample, the following section discusses possible explanations for problems found during the validation, and provides recommendations for reducing their impact.
Improved survey instructions
As indicated in the survey instructions, responses to IPEDS should be derived from the institution’s financial statements and supplemented by underlying institutional records. Some items required by IPEDS are not always reported in financial statements, but must be pulled from underlying records. For example, IPEDS collects data on expenses by functional categories, such as instruction, research, institutional support, etc. However, these functional categories are not required in financial statements, although NACUBO strongly recommends including this information in the notes. As a result, a respondent unfamiliar with IPEDS Finance may not be fully aware that this information can often be found in the supporting notes or underlying documents.
Another frequent cause of discrepancy was the improper inclusion of amounts from the audited financial statements in the corresponding IPEDS field. Similarly, institutions inappropriately excluded financial statement amounts from IPEDS when calculating totals in IPEDS.
Therefore, NCES should consider overhauling the instructions to reflect the following:
IPEDS respondents may not be the same person or office that prepared the GPFS, particularly in small institutions;
respondents vary widely in knowledge and experience with financial terms and concepts, and with the IPEDS Finance surveys;
attention is needed for data elements commonly omitted in GPFS, and survey instructions should assist in pointing respondents to possible locations of information; and
upcoming changes to the public and private not-for-profit institutions will require changes to the instructions;
In addition to improving the instructions, NCES should consider ways to better educate the wide range of respondents across public and private institutions. NCES has a number of resources in place to disseminate information and provide training to respondents. These include, but are not limited to, the following:
Operators at the NCES Helpesk should continually trained on the Finance surveys to serve as the front line in instructing and assisting respondents through the surveys in real-time;
AIR webinars should be updated and tailored to differing levels of financial understanding to reach respondents with no experience, annually refresh respondents who only work with GPFS during the IPEDS Finance collection, and inform experienced financial staff on upcoming changes to the survey forms; and
AIR Finance trainers should be utilized for their combined years of experience and ability to conduct regional trainings on IPEDS finance surveys, as well as to provide feedback to NCES with complex accounting changes in GASB and FASB.
Quality control measures
In addition to improving the instructions for respondents, current quality control measures should be reviewed for improvement and new measures should be considered. Currently, three layers of quality control checks exists at different stages during survey collection: internal edits within the survey, migration checks by the Helpdesk, and contextual checks following migration that compare institution’s responses to similar institutions.
Internal edits. Edits within the survey differ in levels of importance that range from noncritical to fatal, which produce flags and blocks on closing the survey if not properly resolved. These edits include checks to ensure the sum of the detail equals the reported total, comparisons to prior-year responses, and checks that force respondents to provide written justification for anomalous entries. These edits are provided in narrative format within the collection system and on the IPEDS website. NCES should consider the following:
Examine and review the edits for improvement in light of findings on discrepancies by variable and institutional control; and
Edits should be clearly elucidated so respondents can be clearly aware of their presence and importance.
Migration checks. In addition to the internal survey edits, the Helpdesk checks all institutional responses during migration for pre-assigned checks. For all completed institutions, these checks include reviewing the edit reports and reviewing the caveat boxes. For approximately 5-10% of completed responses, the Helpdesk conducts a full review where seasoned Helpdesk operators open the Finance survey and review all pages to look for “anything unusual”. If something appears unusual that is not caught by the edits, Project Staff are notified for further investigation and possible changes to the edits. NCES should consider the following:
Examine and review the migration checks for improvement in light of findings on discrepancies by variable and institutional control; and
Develop checklists for Helpdesk reviewers to quickly check for suspicious responses based on the findings from this study and historical knowledge of the finance surveys.
Contextual checks. Following migration, analysts at RTI run additional contextual checks on the migrated data file to compare institution’s responses to similar groups of institutions to flag outliers. The QC reports are submitted for review to the IPEDS Finance survey director, who may directly contact institutions if deemed necessary. NCES should consider reviewing these procedures in order to improve automated and manual quality control measures.
Survey burden: eZ-audit and IPEDS
While the exclusion of missing financial statements potentially introduced bias into the final estimates, the process of collecting financial statements from FSA was informative despite criticisms of federal survey duplication. Respondents, TRP members, and others have questioned the necessity of IPEDS Finance given statutory regulations that require that institutions to submit financial statements to eZ-Audit and the Federal Audit Clearinghouse, as well as IPEDS. Critical of the increasing survey burden on institutions, proponents of a single finance collection argue that NCES should collect and compile financial information from the statements rather than surveying individual institutions through IPEDS.
However, the findings from this study highlight several problems and challenges of this proposal. First, the study has shown the limitations of the eZ-Audit database, which suffers from nonresponse. Even after contacting institutions, 118 institutions (20 percent) were completely missing financial statements, while another 14 institutions had provided the wrong fiscal year. Furthermore, eZ-audit does not require identical reporting through consistent definitions and levels of analysis, as required in a single survey like IPEDS. Even trained auditors were unable to compare 50 institutions (8 percent) because institutions had submitted consolidated financial statements to eZ-audit. In summary, the data collection process highlighted the technical and bureaucratic challenges of producing a unified dataset from eZ-audit due the incomparable nature of financial statements and the failure for all institutions to report.
1 The condition that total revenue must be greater than 0 was added, because four institutions meeting the other conditions were either not in any of the finance files (n=3) or had 0 in most fields (n=1).
| File Type | application/msword |
| File Title | Resolution memo of Finance Data Quality study |
| Author | American Institutes for Research |
| Last Modified By | katrina.ingalls |
| File Modified | 2008-07-08 |
| File Created | 2008-07-08 |
© 2026 OMB.report | Privacy Policy
