Response to clarifying questions
resp_questions_rostker_20100913.doc
Exhaust Emissions of Light-duty Vehicles in Metropolitan Detroit (New Collection)
Response to clarifying questions
OMB: 2060-0645
1. How will the EPA evaluate whether the non-response bias plan is successful?
The concept, as described in Part B, 5(b)(iv) is to classify and average the remote-sensing for respondent vehicles and the entire remote-sensing pool, taken to represent the vehicle population. If non-response is more or less a random process, or if it is unrelated to emission levels, we would expect trends for both groups to track quite closely. This conclusion is based on the tendency for means of remote-sensing data to be well behaved, despite variablility in measurements for individual vehicles.
The situation I simulated is one in which the response rate drops markedly with increasing emission levels. As mentioned, this represents a worst case for us in that it assumes that at least some owners of high-emitting vehicles are aware of the fact and show a low propensity to participate. Another possibility is that since high-emitting vehicles are relatively rare, even “random” response patterns could induce incidental bias. In practice, it might be difficult to distinguish the two scenarios. In either case, however, we would expect that remote-sensing averages for the respondent (sample) and “population” would diverge for vehicles on the high end of the range (see figures 12(a) and 13(a). If we obtained results similar to these we would interpret them as evidence that non-response or was probably a source of bias, with the magnitude and direction of bias suggested by the observed differences between the remote-sensing trends.
On the other hand, if we observed reasonably good agreement between averages for respondents and non-respondents, we would interpret it as evidence that non-response (or other factors) were not causing substantial bias in PEMS emissions results.
In either case, we would think of the non-response analysis as “successful,” in that developing the ability to confirm or rule out bias at some level of confidence would be a great improvement over the situation to date in which the possibility of bias can be neither proven nor ruled out.
2. Why does the EPA plan to track PEMS data for three months?
To clarify, we don’t plan to track emissions (PEMS) for this length of time. The plan is to perform emissions measurements over two days, as described in Part B, pages 30-31. The PEMS would be installed on day 1 (Step 8) and removed on day 2 (step 10).
The longer three-month measurement period applies to measurement of activity (PAMS, steps 11-13). This period is long enough characterize vehicles’ activity patterns, including routine commuting, differences between weekday and weekend behavior, and periodic events such as business trips, holidays, vacations, etc. In practical terms this period represents the maximum that we consider feasible in terms of cost and logistics. The PAMS unit is very small, and its presence does not interfere with the vehicle owners’ normal activities.
3. How is the EPA capturing acceleration characteristics on the on-ramp data?
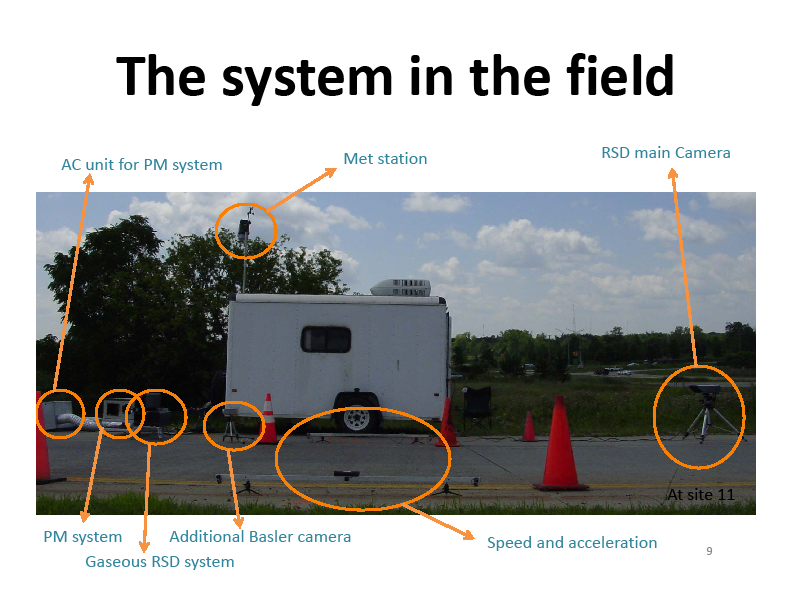
The remote-sensing measurements were performed by researchers from Michigan Technological University under contract to one of our research partners. Vehicle speed and acceleration are measured with a set of two red diode lasers mounted on a 5 ft. aluminum rod. The rod is installed on the opposite side of the road from the remote sensing trailer by means of two small tripods and powered by batteries. On the trailer side, an identical aluminum rod hosts two detectors connected to the main acquisition system. When a vehicle passes by the system, the tires interrupt the beams; and the time between blocks of the two beams provides a means to calculate both speed and acceleration for each vehicle. See the two rods in the picture below

4. Can we see the last round of PEMS/ infrared studies? How does this study fit into the long-range research plan?
We’re not quite clear which data you’re referring to in that we don’t have a “last round” in the sense of PEMS/RSD data coupled in the sense that we’re proposing for this project . I’assume you’re referring to a particular dataset mentioned in part B?
5. How does EPA plan to manually document the license plates of the 30,000 vehicles?
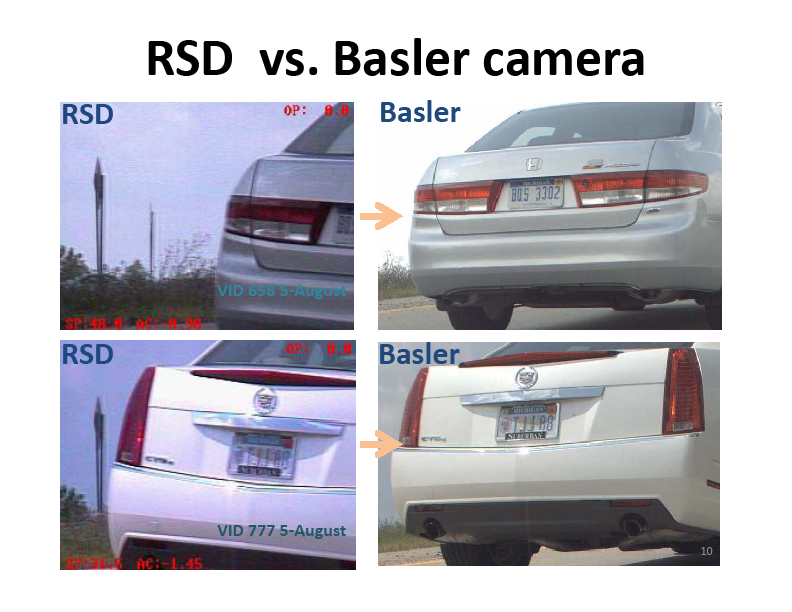
The plate reading and transcription is also performed by researchers and students from MTU. At the time of measurement, the license plate is captured by one or more synchronized digital cameras connected to the system. In this case, two cameras were used for a large fraction of the campaign. One is integrated into the remote-sensing instrument itself. The second is an additional camera that captures a second image from a different wider angle and at higher pixel resolution.
The license plates are entered manually into data files by a group of students who visually review the images. During the process, several measures are taken to prevent fatigue and reduce tendencies to error. To facilitate entry, the students use a software interface specifically designed for this purpose. Given the tedious nature of the task, individual students are allowed to perform entry for a limited amount of time (in the order of 2-3 hours in a given day), on alternate days. This detailed and repetitive task is thus kept manageable by spreading the work over a group of 8-10 students over a period of three to four weeks. As an additional quality-assurance measure, a sample of ~5% of readings will receive a blind redundant reading to assess the repeatability of this approach."

6. Is 30,000 a total number of vehicles that drive past the infrared device or a select portion of these (such as the nth number)?
The 30,000 figure is not a total number of vehicles but rather a target number of valid measurements, where “valid” is defined as follows. A “valid” record includes valid measurements of the gaseous pollutants from the remote-sensing system, valid speed and acceleration measurements, plus the ability to capture the license plate. The total number does not reflect the total number of vehicles who passed the sensor, but can include multiple readings on individual vehicles.
7. Can we see a side-by-side listing of what PEMS and infrared devices capture, such as MPH, CO2, etc…?
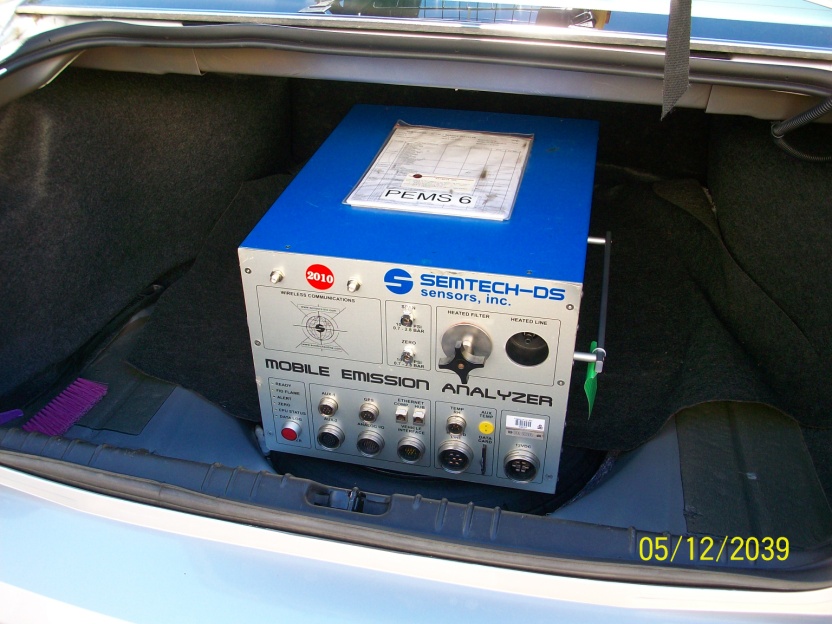
The two systems capture much of the same information, but using different techniques, applied at different time scales and levels of detail. Generally, the remote-sensing system captures “point” or “snapshot” measures, using completely non-intrusive techniques, as a vehicle (and its exhaust plume), pass by the sensor. The portable emissions measurement system (PEMS) captures time series at frequencies of about one second over the period measured, which can range for hours to days. Obviously, the PEMS must be installed on a vehicle to acquire data.
In terms of emissions, the remote sensor does not capture the emissions as mass, but rather as the ratio of the concentration of HC, CO or NO to that of CO2 in the exhaust plume. Mathematically, the raw results can be translated to terms of the mass of emission per mass of CO2 (e.g., g CO/kg CO2), or mass of emission per mass or volume of fuel burned (e.g., g CO/kg fuel, g CO/gal fuel). For the nitrogen species, the remote sensor only detects NO.
The PEMS instruments measure emissions concentrations in the exhaust stream at the end of the tailpipe. Combined with exhaust flow volume (cu ft/min), the concentrations can be converted to mass emissions and expressed in a variety of ways, including mass/time (g/sec), mass/fuel (g/kg), mass/distance (g/km) or mass/power (g/kW-hr).
See table below.
Parameter |
Method |
Comment |
|
|
Remote-sensing |
PEMS |
|
CO2 |
|
X |
Remote sensing measures other exhaust constituents in relation to CO2, as mentioned above. |
CO |
X |
X |
|
HC |
X |
X |
The range of hydrocarbon speces measured by remote sensing is narrower than for PEMS; absolute measurements between the two techniques are not directly comparable |
NO |
X |
X |
|
NO2 |
|
X |
|
NOx (=NO+NO2) |
|
X |
|
Particulate |
|
X |
|
Vehicle speed (mph) |
X |
X |
|
Vehicle acceleration (mph/sec) |
X |
X |
|
Engine speed (rev/min) |
|
X |
|
Exhaust flow volume (cu. ft/min) |
|
X |
|

| File Type | application/msword |
| File Title | We’ve run into some questions about the submission called “Exhaust |
| Author | James Warila |
| Last Modified By | James Warila |
| File Modified | 2010-09-13 |
| File Created | 2010-09-13 |
© 2026 OMB.report | Privacy Policy