2009 Survey Documentation for the Omnibus Household Survey
Attachment VII October 2009 OHS Survey Documentation.doc
Omnibus Household Survey (OHS)
2009 Survey Documentation for the Omnibus Household Survey
OMB: 2139-0012

Bureau of Transportation Statistics
Survey Documentation for the
Bureau of Transportation Statistics
Omnibus Survey Program
(Public Use)
October 2009
Survey
Documentation for the
Bureau
of Transportation Statistics Omnibus Survey Program
OCTOber
2009
(PUBLIC
USE)
TABLE OF CONTENTS
List of Tables iii
1. Introduction and Background 1
2. Sample Design 2
2.1 Target Population 2
2.2 Sampling Frame and Selection 2
2.2.1 RDD Landline Sample 4
2.2.2 Purging for Ineligible Numbers 4
2.2.3 Address Matching 5
2.3 Sample Administration 5
2.4 Precision of Estimates 5
3. Sampling Weights and Adjustments 7
3.1 Base Sampling Weights 7
3.2 Adjustment for Unit Non-Response 7
3.3 Adjustment for Households with Multiple Telephone Numbers 8
3.4 Adjustment for Number of Eligible Household Members 9
3.5 Post-Stratification Adjustments 9
3.6 Trimming of Final Analysis Weights 12
4. Variance Estimation 13
4.1 Variance Estimation Methodology 13
4.1.1 Software 13
4.1.2 Methods 13
4.2 Degrees of Freedom and Precision 14
5. Data Collection 15
5.1 Data Collection Schedule 15
5.2 Interview Procedures 15
5.2.1 Pre-Testing 15
5.2.2 Interviewer Training 17
5.2.3 Pre-Contact Letter 18
5.2.4 Call Attempts and Callbacks 18
5.2.5 Disposition Codes 19
5.2.6 Household Screening 21
5.2.7 Interviewing Methods 21
5.3 Data Quality Control Procedures 21
5.3.1 Interviewer Performance 22
5.3.2 Other Procedures 23
5.4 Summary of Data Cleaning 23
5.5 Coding of Missing Values 23
5.6 Response Rates 24
Appendix A: Final Annotated Survey Questionnaire 28
Appendix B: Data Dictionary 51
Appendix C: SAS Format Library 80
Appendix D: Frequency Tables – National Sample 85
Appendix E: Frequency Tables – Sample of Targeted MSAs 114
References 144
List of Tables
Table 1: Census Regions and Divisions 2
Table 2: Targeted Metropolitan Statistical Areas 3
Table 3: Number of Telephone Lines per Household 8
Table 4: Number of Eligible Household Members 9
Table 5: Post-Stratification Cells – National 10
Table 6: Post-Stratification Cells – MSA 11
Table 7: Interviewer Disposition Codes 20
Table 8: Summary of Codes for Missing Values by Data File Format 24
Table 9: Final Dispositions – National Sample 25
Table 10: Final Dispositions – Sample of Targeted MSAs 26
1.Introduction and Background
The Bureau of Transportation Statistics (BTS) conducts the Omnibus Household Survey (OHS) to monitor public expectations of and satisfaction with the transportation system and to gather event, issue, and mode-specific information. OHS, which is conducted annually, serves as an information source for the U.S. Department of Transportation (DOT) modal administrators to support congressional requests and to gauge internal DOT performance. Overall, OHS supports the collection of information on a wide range of transportation-related topics.
Each round of OHS contains a set of core questions that are based on critical information needs within DOT. In addition, supplemental questions are included in each round to correspond to DOT’s five strategic goals: safety; reduced congestion; global connectivity; environmental stewardship; and security, preparedness, and response. Finally, specific questions posed by the various DOT modes are included in each survey.
This report presents the results of the October 2009 OHS. The October 2009 OHS has two components: one national sample and one sample of nine targeted metropolitan statistical areas (MSAs). The national sample survey was conducted from October 1, 2009, through November 6, 2009. The sample survey of targeted MSAs was conducted from October 1, 2009, through November 7, 2009. Data for both samples were collected from households in the United States using a random-digit-dialed telephone methodology. The final data include 1,082 cases in the national sample and 504 cases in the original sample of targeted MSAs. The final dataset for the survey of targeted MSAs has 720 cases, which include not only the 504 cases in the original sample of targeted MSAs but also 216 cases from the nine targeted MSAs in the national sample. The total number of variables in the public-use dataset is 129 for the national survey and 130 for the survey of targeted MSAs. Strategic Research Group collected the data under a subcontract with MacroSys, LLC.
The primary goal of this report is to document the background information, sampling procedures, data collection, data elements and survey variables, response rates, final weights, and standard error estimation for the October 2009 OHS.
This report contains the following information:
Background of the survey initiative;
A detailed description of how sample respondents were selected for the survey;
Information on the data collection, the number of completed interviews, and response rates;
Information on interviewer training, pre-testing, interviewing methods, household screening methods, and methods for call attempts and callbacks;
Information on the number of cases in the file;
Guidance on the use of weights for analyses;
Instructions for calculating standard error estimates;
The final survey questionnaire;
A data dictionary that provides the names of survey variables, their codes, labels, and the associated response categories; and
Frequency tables for both the national survey and the survey of targeted MSAs.
2.Sample Design
2.1Target Population
The October 2009 OHS consists of a national survey effort and a survey effort of nine targeted MSAs. The target population for the national survey is the U.S. non-institutionalized adult population (18 years of age or older). The target population for the targeted MSA survey is the non-institutionalized adult population in nine targeted MSAs.
2.2Sampling Frame and Selection
Both the national survey and the targeted MSA survey used the same questionnaire, but their samples were generated separately. To ensure that the October 2009 OHS is comparable to past OHS (November 2008 and earlier) the same methodology used for previous surveys was used for the current survey.
The samples for both the national survey and the targeted MSA survey were purchased from Survey Sampling International (SSI), a firm that provides samples for numerous government agencies and the private sector. The national sample included all 50 states and the District of Columbia. Using list-assisted random-digit-dialing (RDD) methodology, a national probability sample of telephone numbers was generated for the survey. All telephone numbers in the sampling frame – SSI’s total active blocks – were divided into 18 strata by Census division (Table 1) and metropolitan status (i.e., inside MSA versus outside MSA) at the county level. The number of sampled telephone numbers for each stratum was proportionate to the size of the sampling population within the stratum. The national sampling rate was computed by dividing the number of RDD sample elements required by the total possible telephone numbers in the sampling frame.
Table 1: Census Regions and Divisions
Region |
Division |
State |
Northeast |
New England |
CT, ME, MA, NH, RI, VT |
Middle Atlantic |
NJ, NY, PA |
|
Midwest |
E. North Central |
IN, IL, MI, OH, WS |
W. North Central |
IA, KS, MN, MO, NE, ND, SD |
|
South |
South Atlantic |
DE, DC, FL, GA, MD, NC, SC, VA, WV |
E. South Central |
AL, KY, MS, TN |
|
W. South Central |
AR, LA, OK, TX |
|
West |
Mountain |
AZ, CO, ID, NM, MT, UT, NV, WY |
Pacific |
AK, CA, HI, OR, WA |
SSI developed the sample by first imposing an implicit stratification on the telephone exchange areas by Census division and metropolitan status at the county level. Within each Census division, counties and their associated telephone exchange areas located in MSAs were sorted by the size of the MSAs. The size of an MSA was measured by its population. After the MSAs were sorted according to the population, an indicator for metropolitan status (MSC) of the counties was created and added as a variable to the sample files. For the purpose of OHS, the MSC is defined as follows:
1 = Large MSA – 1 million population or more.
2 = Medium MSA – with 500,000–999,999 population.
3 = Small MSA – with less than 500,000 population.
5 = Outside MSA.
Counties and their associated telephone exchange areas within a Census division located outside of MSAs were first sorted by state. Within each state, the counties and their associated telephone exchange areas were sorted by geographic location. The sampling interval for all strata was the inverse of the national sampling rate computed above so that the number of intervals was equivalent to the number of sample elements required. Within each sampling interval, a single random number was generated between one and the interval size; the corresponding phone number within the interval was identified and written to an output file. This implicit stratification ensured that the sample of telephone numbers was geographically representative.
In addition to the national sample, a sample of targeted MSAs was also drawn with the same probability-proportionate-to-size sampling method from the following nine MSAs with a population of one million or more and rail transit (Table 2). The sampling rate was computed by dividing the number of RDD sample elements required for the survey of targeted MSAs by the total possible telephone numbers in the corresponding sampling frame. Each of the targeted MSAs was a stratum. Prior to sampling, counties and their associated telephone exchange areas within each MSA were first sorted by state. Within each state, the counties and their associated telephone exchange areas were sorted by geographic location.
Table 2: Targeted Metropolitan Statistical Areas
MSA Code (2008 CBSA code) |
MSA Title |
12060 |
Atlanta-Sandy Springs-Marietta, GA |
14460 |
Boston-Cambridge-Quincy, MA-NH |
16980 |
Chicago-Naperville-Joliet, IL-IN-WI |
31100 |
Los Angeles-Long Beach- Santa Ana, CA |
33100 |
Miami-Fort Lauderdale-Pompano Beach, FL |
35620 |
New York-Northern New Jersey-Long Island, NY-NJ-PA |
37980 |
Philadelphia-Camden-Wilmington, PA-NJ-DE-MD |
41860 |
San Francisco-Oakland-Fremont, CA |
47900 |
Washington-Arlington-Alexandria, DC-VA-MD-WV |
A total of 18,050 telephone numbers was purchased for the October 2009 OHS. Of those numbers, 6,964 were determined to be working numbers for the national survey and 7,326 for the targeted MSA survey. For survey administration, the working numbers for both surveys were divided into five replicates, respectively. They were released by replicate over the period of data collection: the first replicates of 2,000 national and 1,000 MSA cases were released on the first day of interviewing; the second replicates of 1,953 national and 1,000 MSA cases were released on October 3; the third replicates of 1,047 national and 500 MSA cases were released on October 11; and the fourth replicates of 350 national and 330 MSA cases were released on October 19. The remaining replicates were not used. The following section describes the standard procedures for generating a RDD landline sample, which was used to generate samples for the October 2009 OHS.
2.2.1RDD Landline Sample
To generate the RDD landline sample, SSI employed a list-assisted RDD system. List-assisted refers to the use of commercial lists of directory-listed telephone numbers, such as Telcordia, to increase the likelihood of dialing household residences. This method gives unlisted telephone numbers the same chance to be selected as directory-listed numbers.
The system utilizes a database of “working blocks.” A block (also known as a 100-bank or a bank) is a set of 100 contiguous numbers identified by the first two digits of the last four digits of a telephone number. A block is defined as working if it contains one or more listed telephone households. The database consists of all residential telephone exchanges, working block information, and various geographic service parameters such as state, county, primary zip code, etc. On a national basis, this definition covers an estimated 97.7 percent of all residential telephone numbers (noting that slightly over 20 percent of U.S. households had only wireless telephones in the second half of 2008), while the listed database covers 99.96 percent of directory listed landline phones. This database is updated on a quarterly basis.
The sampling frame consists of the set of all telephone exchanges that meet the geographic criteria. This geographic definition is made using one or more of the geographic codes included in the database. Following specification of the geographic area, the system selects all exchanges and associated working banks that meet those criteria.
Based on the sampling frame defined, the system computes an interval such that the number of intervals is equivalent to the desired number of sample elements. The interval is computed by dividing the total possible telephone numbers in the sampling frame (i.e., # of working banks × 100) by the number of RDD sample elements required. Within each interval, a single random number is generated between one and the interval size; the corresponding phone number within the interval is identified and written to an output file. The result is that every potential telephone number within the defined sampling frame has a known and equal probability of selection.
2.2.2Purging for Ineligible Numbers
The SSI purging process is designed to purge about 75 percent of the non-productive numbers (non-working, businesses, and fax/modems). Since this process is completed after the sample is generated, the statistical integrity of the sample is maintained.
First, the file of generated numbers is passed against a database that is comprised of the business database and the listed household database. Business numbers are eliminated from the file of generated numbers while listed household numbers are set aside so that they can be recombined after the active Dialer Phase.
Second, disconnected numbers are purged in a post-production process that identifies non-working or unassigned numbers, as well as modem and fax numbers in RDD telephone samples. It employs a proprietary technology that recognizes almost half of these numbers, thereby improving the effective working phones rate of random digit telephone samples by an average of 10–15 percent.
2.2.3Address Matching
The Multi-Source Phone Data Product from CAS, Inc. was used for residential reverse matches (name and address). With this product, CAS collects millions of individuals’ telephone numbers and associated address information from many different sources including telephone directories, subscription databases, government agencies, associations, court records, and internet databases that are updated on a weekly basis. This compiled listing of over 215 million individuals was then used to match telephone numbers with the most current address or vice versa depending on the client’s needs.
2.3Sample Administration
The national sample and the sample of targeted MSAs were administered separately during data collection for tracking purposes so that respective goals for both samples could be attained, respectively. The goal was to reach a minimum of 1,000 completed interviews for the national sample and a minimum of 500 for the sample of targeted MSAs and to achieve a 50 percent response rate for both samples. All the procedures for the national sample were followed for the sample of targeted MSAs. Since the questionnaires were the same for both the national sample and the sample of targeted MSAs, the interviews for both groups were conducted identically, but the files for the two samples were kept separately. After the data collection, the cases from the targeted MSAs in the national sample remained a part of the national sample. They were also combined with the original sample of targeted MSAs to achieve a larger sample size for the survey of targeted MSAs. The specific means for attaining the highest response rate possible, such as callbacks and refusal conversion, were the same for both samples. This is discussed in detail in the section on Data Collection (Section 5).
2.4Precision of Estimates
The precision of estimated frequencies can be assessed by evaluating the width of the 95 percent confidence interval around the estimates. For this application, the confidence interval can be approximated for design purposes as follows:
![]()
Where:
ps is the estimated (sample) proportion;
![]() is the critical value of the normal distribution at α = 0. 05
significance level; and
is the critical value of the normal distribution at α = 0. 05
significance level; and
Var(ps) is the variance of ps.
The calculation of the end points of the confidence interval can be rewritten as follows:

or

Where:
P is the true population value of the proportion; and
n is the sample size.
Therefore, with a sample size of 1,082, ps = 50 percent and α = 0.05, the confidence interval range would be 47 ≤ P ≤ 53, approximately.1
3.Sampling Weights and Adjustments
This section discusses the development of survey weights. Two types of weights were used in the present survey: pre-population adjustment weights (to correct for unequal selection probabilities) and post-stratification (to correct for known discrepancies between the sample and the population). The final analysis weight reflects both types of adjustments, i.e., adjustment for non-response, multiple telephone lines, and persons per household as well as post-stratification adjustments. The final analysis weight is the weight that should be used for analyzing the survey data.
The final analysis weight was developed using the following steps:
Calculation of the base sampling weights;
Adjustment for unit non-response;
Adjustment for households with multiple voice telephone numbers;
Adjustment for selecting an adult within a sampled household; and
Post-stratification adjustments to the target population.
The product of the above variables represents the final analysis weight. If needed, extreme values of the final analysis weight can be reduced (or trimmed) using standard weight trimming procedures.
3.1Base Sampling Weights
The first step in weighting the sample is to calculate the sampling weight for each telephone number in the sample. The sampling weight is the inverse of the telephone number’s probability of selection:
![]()
Where N is the total number of telephone numbers in the sampling frame and n is the total number of telephone numbers in the sample. For this survey, the total number of telephone numbers in the sampling frame, N, is 282,271,600 for the national survey and 69,120,100 for the survey of targeted MSAs. The total number of telephone numbers in the sample (numbers dialed) is 5,350 for the national survey and 4,229 for the survey of targeted MSAs, which eventually included 2,830 cases in the original sample of targeted MSAs and 1,399 cases that were sampled for the national survey and were from the nine targeted MSAs.
3.2Adjustment for Unit Non-Response
For the national survey, sampled telephone numbers are classified as responding or non-responding households according to Census division and metropolitan status (inside or outside a Metropolitan Statistical Area). The non-response adjustment factor for all telephone numbers in each Census division (c) by metropolitan status (s), is calculated as follows:
![]()
Where the denominator is the CASRO response rate for Census division c and metropolitan status s. The non-response adjustment factor for a specific cell (defined by metropolitan status and Census division) is a function of the response rate, which is given by the ratio of the estimated number of telephone households to the number of completed surveys. For the survey of targeted MSAs, the cell for calculating the non-response adjustment factor is each of the nine targeted MSAs.
The non-response adjusted weight (WNR) is the product of the sampling weight (WS) and the non-response adjustment factor (ADJNR) within each stratum.
3.3Adjustment for Households with Multiple Telephone Numbers
Some households have multiple telephone lines for voice communication. Thus, these households have multiple chances of being selected into the sample, and adjustments must be made to their survey weights. The adjustment for multiple telephone lines follows:
![]()
The adjustment is limited to a maximum factor of three. In other words, the adjustment factor ADJMT will be one over two (0.50) if the household has two telephone lines, and one over three (0.33) if it has three or more.
Table 3 provides the summary statistics for the number of telephone lines in the sampled households.
Table 3: Number of Telephone Lines per Household
|
National |
MSA |
Mean |
1.04 |
1.063 |
Standard error of mean |
0.007 |
0.01 |
Minimum |
1 |
1 |
25th percentile |
1 |
1 |
Median |
1 |
1 |
75th percentile |
1 |
1 |
Maximum |
4 |
4 |
For respondents who did not provide this information, it is assumed that the household contained only one telephone line. The non-response adjusted weight (WNR) is multiplied by the adjustment factor for multiple telephone lines (multiple selection probability) (ADJMT) to create a weight that is adjusted for non-response and for multiple selection probability (WNRMT).
3.4Adjustment for Number of Eligible Household Members
The probability of selecting an individual respondent depends on the number of eligible respondents in the household. Therefore, it is important to account for the total number of eligible household members when constructing the sampling weights. The adjustment for selecting a random adult household member follows:
ADJRA = Number of Eligible Household Members
Table 4 provides the summary statistics for the number of eligible members in the sampled households.
Table 4: Number of Eligible Household Members
|
National |
MSA |
Mean |
2.325 |
2.36 |
Standard error of mean |
0.056 |
0.067 |
Minimum |
1 |
1 |
25th percentile |
2 |
2 |
Median |
2 |
2 |
75th percentile |
3 |
3 |
Maximum |
9 |
7 |
For respondents who did not provide this information, a value for ADJRA is imputed according to the distribution of the number of eligible persons in a household (from responding households) within the age, gender, and race/ethnicity cross-classification cell matching that of the respondent for which the value is being imputed.
The weight adjusted for non-response and for multiple selection probability (WNRMT) is then multiplied by ADJRA, resulting in WNRMTRA, a weight adjusted for non-response, multiple selection probability and for selecting a random, household member.
3.5Post-Stratification Adjustments
Adjusting weighted survey counts so that they agree with population counts provided by the Census Bureau can compensate for different response rates by demographic subgroups, increase the precision of survey estimates, and reduce the bias in the estimates due to the exclusion of households without telephones from sampling. The final adjustment to the survey weight is a post-stratification adjustment that allows the weights to sum to the target population (i.e., U.S. non-institutionalized persons 18 years of age or older) by age, gender, and race/ethnicity.
The outcome of post-stratification is a factor or multiplier (M) that scales WNRMTRA within each age/gender/race cell, so that the weighted marginal sums for age, gender, and race/ethnicity agree with the corresponding Census Bureau distribution for these characteristics. The method used in the post-stratification adjustment is a simple ratio adjustment applied to the sampling weight using the appropriate national population total for a given cell defined by the intersection of age, gender, and race/ethnicity.2 The general method for ratio adjusting follows:
A table of the sum of the weights for each cell denoted by each age, gender, and race/ethnicity combination is created. Each cell is denoted by S(i,j,k), where i is the indicator for age, j is the indicator for gender, and k is the indicator for race/ethnicity.
A similar table of national population controls is created, where each cell is denoted by P(i,j,k).
The ratio R(i,j,k) = P(i,j,k) / S(i,j,k) is calculated; the cell ratio R(i,j,k) is denoted as the multiplier M.
Each weight, at the record level, is multiplied by the appropriate cell ratio of R(i,j,k) to form the post-stratification adjustment.
For the national sample, cells used in the post-stratification are defined by the combination of age, gender, and race/ethnicity.3 Some race/ethnicity or, preferably, age categories may be merged if the number of completed interviews within the corresponding cells falls below 30. For this survey, many of the cells have less than 30 observations. After grouping and to remain consistent with what was done in previous surveys, a total of 16 cells are used for the national sample and 10 for the sample of targeted MSAs. For the sample of targeted MSAs, cells for post-stratification are defined only by the combination of gender and age due to the lack of information on race/ethnicity. The details are in the following two tables.
Table 5: Post-Stratification Cells – National
CELL |
DESCRIPTION |
SAMPLE SIZE |
POPULATION |
1 |
Male – Hispanic (age 18 and over) |
37 |
16,025,259 |
2 |
Male – Black, non-Hispanic (age 18 and over) |
24 |
12,295,956 |
3 |
Male – White, non-Hispanic (age 18–34) |
26 |
21,569,336 |
4 |
Male – White, non-Hispanic (age 35–44) |
35 |
13,569,404 |
5 |
Male – White, non-Hispanic (age 45–54) |
75 |
15,668,930 |
6 |
Male – White, non-Hispanic (age 55–64) |
73 |
12,513,255 |
7 |
Male – White, non-Hispanic (age 65 and over) |
123 |
13,329,864 |
8 |
Male – Other race, non-Hispanic (age 18 and over) |
54 |
6,918,128 |
9 |
Female – Hispanic (age 18 and over) |
46 |
14,825,817 |
10 |
Female – Black, non-Hispanic (age 18 and over) |
52 |
14,196,535 |
11 |
Female – White, non-Hispanic (age 18–34) |
35 |
20,862,430 |
12 |
Female – White, non-Hispanic (age 35–44) |
60 |
13,496,575 |
13 |
Female – White, non-Hispanic (age 45–54) |
86 |
15,909,704 |
14 |
Female – White, non-Hispanic (age 55–64) |
91 |
13,100,051 |
15 |
Female – White, non-Hispanic (age 65 and over) |
169 |
17,908,073 |
16 |
Female – Other race, non-Hispanic (age 18 and over) |
69 |
7,494,516 |
N/A |
Missing demographic information |
27 |
|
|
TOTAL |
1,082 |
229,683,833 |
Table 6: Post-Stratification Cells – MSA
CELL |
DESCRIPTION |
SAMPLE SIZE |
POPULATION |
1 |
Male – age 18–34 |
30 |
8,289,508 |
2 |
Male – age 35–44 |
50 |
5,471,778 |
3 |
Male – age 45–54 |
66 |
5,305,946 |
4 |
Male – age 55–64 |
53 |
3,742,602 |
5 |
Male – age 65 and over |
91 |
3,625,639 |
6 |
Female – age 18–34 |
55 |
8,072,874 |
7 |
Female – age 35–44 |
63 |
5,526,391 |
8 |
Female – age 45–54 |
100 |
5,512,983 |
9 |
Female – age 55–64 |
79 |
4,137,051 |
10 |
Female – age 65 and over |
120 |
5,083,986 |
N/A |
Missing demographic information |
13 |
|
|
TOTAL |
720 |
54,768,758 |
Those respondents who did not supply the demographic information necessary to categorize their age, gender, and/or race/ethnicity are excluded from the post-stratification process and assigned a value of one for M.
The multiplier M is then applied to WNRMTRA to create WNRMTRAPS. However, WNRMTRAPS is overstated because a portion of the sample is not included in the calculation of the post-stratification adjustment. Therefore, a deflation factor is applied to the value of WNRMTRAPS. The deflation factor DEF for the national sample is calculated as follows:
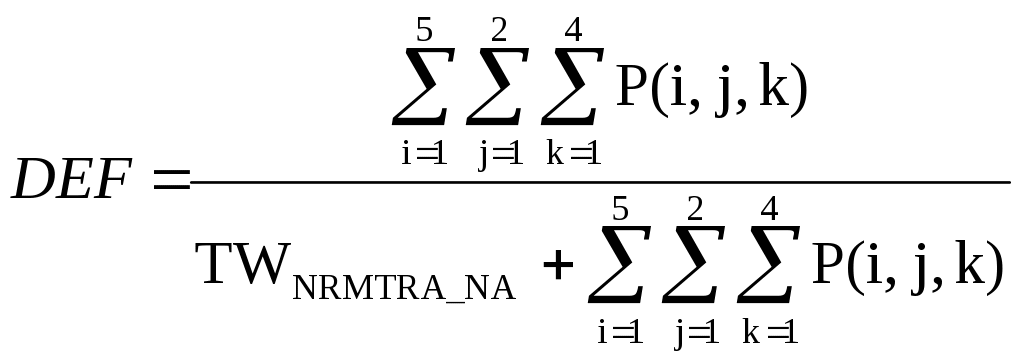
Where:
P(i, j, k) is the national population count for cell (i, j, k); and
TWNRMTRA_NA is the sum of the WNRMTRA weights for respondents with missing demographic information.
The deflation factor DEF for the sample of targeted MSAs is calculated as follows:

Where:
P(i, j) is the MSA population count for cell (i, j); and
TWNRMTRA_MSA is the sum of the WNRMTRA weights for respondents with missing demographic information.
This deflation factor denotes the proportion of the target population represented by respondents with non-missing demographic information. The final analysis weight, WFINAL, is the scaled value of WNRMTRAPS, calculated as follows:
WFINAL = DEF x WNRMTRAPS
WFINAL can be viewed as the number of population members that each respondent represents.
3.6Trimming of Final Analysis Weights
Extreme values of WFINAL are trimmed to avoid over-inflation of the sampling variance. In short, the trimming process limits the relative contribution of the variance associated with the kth unit to the overall variance of the weighted estimate by comparing the square of each weight to a threshold value determined as a multiple of the sum of the squared weights. Letting w1, w2,…wj, denote the final analysis weights for the n completed interviews, the threshold value is calculated using the following formula:

Each household having a final analysis weight that exceeds the determined threshold value is assigned a trimmed weight equal to the threshold. Next, the age/gender/race cell used in the post-stratification is identified for each household with a trimmed weight. To maintain the overall weighted sum within the cell, the trimmed portions of the original weights are reassigned to the cases whose weights are unchanged in the trimming process.
For cases having trimmed weights but missing age, gender, and/or race/ethnicity information, the trimmed portions of the original weights are assigned to all remaining cases whose weights are unchanged in the trimming process.
The entire trimming procedure is repeated on the new set of weights – a new threshold value is recalculated and the new extreme values are re-adjusted. The process is repeated until no new extreme values are found.
4.Variance Estimation
The data collected in the October 2009 OHS were obtained through a complex sample design involving stratification, and the final weights were subject to several adjustments. Any variance estimation methodology must involve some simplifying assumptions about the design and weighting, and so some simplified conceptual design structures are provided in this section.
4.1Variance Estimation Methodology
4.1.1Software
The software package SUDAAN® (Software for the Statistical Analysis of Correlated Data) Version 10.0.1 was used for computing standard errors. SUDAAN® is a statistical software package developed by the Research Triangle Institute to analyze data from complex sample surveys. SUDAAN® uses advanced statistical techniques to produce robust variance estimates under various survey design options. The software can handle stratification and numerous adjustments associated with weighting.
4.1.2 Methods
Overall, three variables, CENDIV (Census division), METRO (metropolitan status), and FNLWGT (final analysis weights), are needed for variance estimation in SUDAAN® for the analysis of the national survey data. Two variables, MSASTRAT (MSA) and FNLWGT (final analysis weights), are needed for variance estimation in SUDAAN® for the analysis of the MSA survey data. The method used in the present survey utilizes the variables CENDIV and METRO to create 18 (9 x 2) strata in the national survey data and the variable MSASTRAT to create nine strata, a single stage selection with replacement procedure, and the final analysis weights. This method provides somewhat conservative standard error estimates.
Assuming a simplified sample design structure, the following SUDAAN® statements can be used (note that the data file for the national survey must be sorted by the variables CENDIV and METRO before using it in SUDAAN®, and the data file for the MSA survey must be sorted by the variable MSASTRAT before using it in SUDAAN®):
For the national data:
PROC … DESIGN = STRWR;
NEST CENDIV METRO;
WEIGHT FNLWGT;
For the MSA data:
PROC … DESIGN = STRWR;
NEST MSASTRAT;
WEIGHT FNLWGT;
More precisely, the following code is used to produce unweighted and weighted frequency counts, percentages, and standard errors (the variable of interest here is “var1,” a categorical variable with seven levels):
For the national survey data:
PROC CROSSTAB DATA = datafile DESIGN = STRWR;
WEIGHT FNLWGT;
NEST CENDIV METRO;
SUBGROUP var1;
LEVELS 7;
TABLE var1;
PRINT nsum wsum totper setot / STYLE = nchs;
RUN;
For the MSA data:
PROC CROSSTAB DATA = datafile DESIGN = STRWR;
WEIGHT FNLWGT;
NEST MSASTRAT
SUBGROUP var1;
LEVELS 7;
TABLE var1;
PRINT nsum wsum totper setot / STYLE = nchs;
RUN;
4.2Degrees of Freedom and Precision
A rule of thumb for degrees of freedom associated with a standard error is a quantity: the number of unweighted records in the dataset minus number of strata. Degrees of freedom for the method above fluctuate depending on the number of records in each dataset. Generally, the dataset for the national sample will yield degrees of freedom of around 1,000, and the dataset for the sample of targeted MSAs will yield degrees of freedom of around 500. For practical purposes, any degrees of freedom exceeding 120 are treated as infinite. Thus, one can use a normal distribution instead of a t-distribution for the statistic.
5.Data Collection
5.1Data Collection Schedule
The survey was conducted over 37 days to enable 1,500 interviews to be completed. The survey period was initially from October 1 through October 31, 2009, but was extended by one week to November 7 to increase the response rate and number of completions.
5.2Interview Procedures
The following sections outline the key phases of the interviewing procedures utilized in the survey.
5.2.1Pre-Testing
Standard pre-testing protocols were utilized to ensure that the survey instrument was programmed correctly and to make sure each survey item was clear and easy to understand.
The pre-test instrument was reviewed by a project manager together with the pre-testing interviewers to discuss question intent and any potential challenges and issues.
A pre-test sample was created from a list of households in targeted areas.
The listed households were called, and pre-test interviews for the survey were conducted when appropriate.
The pre-test interviews were monitored by the project manager and data collection manager, and the interviewers were debriefed after an interview was conducted.
Issues that emerged during survey administration such as respondent questions and confusions and interviewer mishaps were recorded by the project manager and data collection manager.
Clients listened to interviews in interviews and provided feedback.
All calls that lasted over one minute were recorded and placed into the archive for future reference.
A Pre-Test Form was filled out by an interviewer to record any problems or issues that emerged during an interview.
Problems or issues that pre-testing interviewers were focused on included the amount of time to administer the survey, the wording and order of questions, respondent motivation, and transitions (i.e., whether changes in topics were smooth or abrupt). Questions that yielded high occurrences of the same behaviors (e.g., the respondent asked what a question meant) were carefully examined and recorded along with how long it took a respondent to answer them.
Two rounds of pre-tests were conducted for the October 2009 OHS. The first round of pre-tests consisted of 17 interviews. During these interviews, it was found that each interview took more than the 10–15 minutes that DOT specified for the interview time. As a result, Questions L1010 and L1030 were deleted from the questionnaire. The second round of pre-tests was conducted using the shortened questionnaire. This round consisted of eight interviews. The two rounds of pre-tests also led to the rephrasing of a question and correction of typos in the questionnaire.
Timing
Certain items were only asked of individuals who gave a specific response to a previous question. Thus, the length of time it took to administer the survey varied among respondents. During pre-testing, time used for each pre-test was recorded, and the average time of administering the survey was calculated. The average time for an interview was 20 minutes in the first round of pre-tests; it was reduced to 16 minutes in the second round of pre-tests as a result of shortening the questionnaire and improving the wording of the questions.
Question Wording and Order
The following situations regarding question wording and order were recorded and examined by interviewers:
Questions that had awkward wording.
Questions that asked something other than what they were intended to ask.
Questions that were difficult for the respondent to understand. (During the first round of pre-tests, it was found that respondents did not understand the meaning of “video monitor.” The question in concern was then rephrased and was tested in the second round of pre-tests.)
Questions that appeared to be out of order.
Questions that were redundant.
Questions that were not applicable for a certain set of respondents.
Behavior Coding
Interviews were monitored to determine whether an interviewer read a question correctly and whether a respondent answered a question correctly and/or asked for clarification of a question as well as to determine how much time it took the respondent to answer a question. This was to ensure that all questions were clearly understood and that each question served its intended purpose. Questions that were not clearly understood were identified for modification in order to obtain the necessary information.
Respondent Motivation
Interviewers were asked to provide the respondent’s motivations for taking the survey on the Pre-Test Form. The information helped to determine whether “encouraging” statements needed to be inserted at any point during the survey to keep the respondent’s desire to complete it at the optimal level.
Transitions
Transitions were inserted throughout the survey to indicate to the respondent that they were progressing well and to make them aware of how many more sections of the survey remained. Through pre-testing, interviewers and managers noted when they believed such statements needed to be inserted based on their administration of the survey and how well the topics followed one another.
5.2.2Interviewer Training
All interviewers were given general training in interviewing techniques and skills and in the use of Computer Assisted Survey Execution System (CASES) – a computer assisted telephone interviewing software developed by the University of California, Berkeley. They were provided an intensive training session tailored to the requirements of the October 2009 OHS. All interviewers were required to review and sign a confidentiality statement before working on the October 2009 OHS project.
The interviewer training first focused on identifying factors that can cause interviewer and respondent bias, as well as interviewing and record keeping techniques. Special attention was given to training interviewers on how to introduce themselves and the project to respondents and on how to make appointments and callbacks. They were taught correct interviewing and probing techniques, including how to read questions exactly as worded, record open-ended responses verbatim appropriately, and respond to respondents’ questions. Interviewers were also trained on how to fill out call sheets and enter correct call disposition codes both on call sheets and in the data file.
Interviewers were then trained on how to use CASES to administer telephone interviews. They worked through a CASES training survey instrument to learn how to enter responses effectively and how to manipulate the survey instrument during an interview. As a part of the general training, they role played different interviewing scenarios with a supervisor, reviewing all of the common questions and responses by respondents.
All interviewers participated in a special training session for the October 2009 OHS project. The goals and the objectives of the project were reviewed with the interviewers. BTS staff members discussed confidentiality requirements, gave their perspective on the survey, and discussed the use of the survey data. The new survey instrument was reviewed and potential problems or issues were fully discussed with interviewers. A special role playing using the questionnaire for the October 2009 OHS was conducted with interviewers acting as both interviewer and respondent in turn.
A customized interviewing manual, the 2009 OHS Training Manual, was prepared for training and was reviewed by interviewers during training. The manual provided information on the scope and potential issues that could arise during an interviewing session. The manual included the goals and objectives of the project, terms specific to the survey instrument, and information on administering the survey. Scripted responses to common questions regarding the OHS project were also included for the interviewers to use.
5.2.3Pre-Contact Letter
Five calendar days prior to the start of data collection, a BTS-approved pre-contact letter was sent to households of sampled telephone numbers with an address. The intent was for each household with an address to receive the pre-contact letter several days before they received a call for an interview.
The pre-contact letters were sent out in four batches, with an interval of a week between two mailings. The first mailing was sent on September 25, 2009, consisting of 944 respondents in the national sample and 425 respondents in the sample of targeted MSAs. The second mailing went out on October 3, 2009, consisting of 964 in the national sample and 440 in the sample of targeted MSAs. The third mailing went out on October 11, 2009, with 511 in the national sample and 209 in the sample of targeted MSAs. The fourth mailing went out on October 19, 2009, with 179 in the national sample and 140 in the sample of targeted MSAs. In total, 2,598 pre-contact letters were sent to respondents in the national sample, and 1,214 pre-contact letters to the respondents in the sample of targeted MSAs, which accounted for approximately 49 percent of the national sample and 43 percent of the sample of targeted MSAs.
An “800” number was listed in each letter with the specific times to call (Monday through Friday, 9 a.m. to 12 a.m. EST; Saturday, 10 a.m. to 2 p.m.; and Sunday, 5 p.m. to 12 a.m. EST). Should respondents call outside the listed times, they would receive a phone message asking them to leave their name and number so that someone would contact them as soon as possible to conduct the interview.
5.2.4Call Attempts and Callbacks
A standardized procedure of multiple call attempts and a three-phase message procedure were used to encourage participation. With the standardized calling procedure, a sampled telephone number was called up to as many as 30 times with calls in the day time and evening and on weekends. Standardized multiple call attempts were made in between voice messages, but a message was not left at each call attempt when encountering an answering machine (due to concern that people might avoid the call or feel “harassed” if they were away for a few days and found multiple messages on their answering machine upon returning home). Given the limited duration of fielding, a household with an answering machine was called two to three times per day during the October 2009 OHS. This number was established to strike a balance between perceived harassment and encouraging participation.
Messages were left to encourage households to at least pick up the telephone when they were called or to encourage them to call back when they were available. To avoid annoying a respondent by leaving multiple messages, a three-phase message procedure was implemented: the first message was left after reaching an answering machine two or three times; the second message was left halfway through the calling window; and the third message was left two or three days before the end of the calling window. Each message was progressively more earnest and urgent. This three-phase message procedure resulted in more call-ins from respondents after each successive message.
Toward the end of the survey, a more aggressive approach to reaching more respondents was employed in an effort to improve the final response rate. Daily multiple attempts (up to five times per day) were made to reach respondents.
5.2.5Disposition Codes
Table 7 shows a list of disposition codes and their descriptions. They were used by interviewers to determine the scope of each call.
Table 7: Interviewer Disposition Codes
Out of Scope (ineligible for study participation) |
|
22 |
No one 18 years old or older in household |
28 |
Respondent unavailable before and during the study period |
40 |
Business |
42 |
Disconnected number |
43 |
Number changed |
47 |
Computer/Fax/Pager |
48 |
Cell Phone |
Scope Undetermined |
|
11 – NQ |
No answer after 5 rings – not qualified |
12 – NQ |
Busy – not qualified |
15 – NQ |
Answering machine – not qualified |
16 – NQ |
Left first message – not qualified |
17 – NQ |
Left second message – not qualified |
18 – NQ |
Left third message – not qualified |
21 – NQ |
Too ill/hearing disabled/Mental Incapacitation – not qualified |
29 – NQ |
Respondent does not speak English or Spanish – not qualified |
30 – NQ |
General callback – not qualified |
31 – NQ |
Callback at time/date by informant – not qualified |
32 – NQ |
Callback at time/date by respondent – not qualified |
45 – NQ |
Cannot complete call – not qualified |
46 – NQ |
Privacy manager on – not qualified |
60 – NQ |
First informant refusal – not qualified |
70 – NQ |
Second informant refusal – not qualified |
80 – NQ |
First respondent refusal – not qualified |
90 – NQ |
Second respondent refusal – not qualified |
91 – NQ |
Hard refusal/Take me off of your list – not qualified |
In Scope |
|
01 |
Interview Completed |
03 |
Partial complete: willing to finish |
06 |
Partial complete: refused to finish |
06, 60, 70, 80, 90, 91 01 |
Refusal Conversion |
11 – Q |
No answer – qualified |
12 – Q |
Busy – qualified |
15 – Q |
Answering machine – qualified |
16 – Q |
Left first message – qualified |
17 – Q |
Left second message – qualified |
18 – Q |
Left third message – qualified |
21 – Q |
Too ill/hearing disabled/Mental Incapacitation – qualified |
23 – Q |
Respondent deceased prior to completion of the interview – qualified |
28 – Q |
Respondent not available during study – qualified |
29 – Q |
Respondent does not speak English or Spanish – qualified |
30 – Q |
General callback – qualified |
31 – Q |
Callback at time/date by informant – qualified |
32 – Q |
Callback at time/date by respondent – qualified |
44 – Q |
Area code changed, but not the number |
45 – Q |
Cannot complete call – qualified |
46 – Q |
Privacy manager on– qualified |
60 – Q |
First informant refusal – qualified |
70 – Q |
Second informant refusal – qualified |
80 – Q |
First respondent refusal – qualified |
90 – Q |
Second respondent refusal – qualified |
91 – Q |
Hard refusal/Take me off of your list – qualified |
Note: For our purposes, Q (qualified) indicates that a respondent was screened and was an individual that was 18+ years old who resided in an eligible household according to the parameters of the study. NQ (Not qualified) indicates that an eligible respondent was not been selected, so it was unknown whether or not they were eligible for participation in this study.
5.2.6Household Screening
A qualified respondent must be a household member 18 years of age or older. While a household member who answered the phone – the informant – might be 18 or older, the survey was not conducted with him or her to avoid potential bias. Instead, the informant was asked to identify as the qualified respondent another household member whose birthday is immediately after his or hers. A randomized selection was made when the informant did not know the birthdays of any household members. The next-birthday method of respondent selection has been proven as a relatively efficient procedure for selecting a sample that is representative of all household members. If the selected household member was not available at the time of the call, a callback was scheduled to screen and/or interview the respondent. On average, it took less than four minutes for screening respondents and for reviewing the required confidentiality statement.
5.2.7Interviewing Methods
Incentives were not offered to potential respondents in exchange for their participation in the survey. Interviews were conducted in both English and Spanish. When a potential respondent refused to be interviewed, the reason for refusal was recorded. The average length of completing an interview was about 15 minutes in addition to the time for screening and recruiting a potential respondent.
At the beginning of an interview, interviewers introduced themselves, specifying who they worked for and the purpose of the survey, and assured the potential respondent this was not a sales call. Interviewers then determined whether there was an eligible person in the household. Once contact was made with the eligible household member, the interviewers reintroduced themselves as needed and explained the purpose of the survey. The interviewers also indicated to the respondents that the survey took 15 minutes to complete, all information would remain confidential, and it was a voluntary study so respondents could refuse to answer any question.
If a potential respondent agreed to participate in the survey, the respondent was provided an opportunity to ask any questions to be answered by the interviewer, and then the interview was conducted. However, if it was not a convenient time, a callback was scheduled. When a respondent refused to participate in or complete the survey, the case was moved to a “refusal buster” who was trained to overcome refusals. The “refusal buster” called the respondent back after waiting two days. Refusal conversion efforts helped to increase the number of valid cases in the final samples. In the final data of the October 2009 OHS, over 13 percent of cases in the national sample and about 15 percent of cases in the original sample of targeted MSAs resulted from refusal conversions.
5.3Data Quality Control Procedures
Standard procedures were implemented for data quality control. Data were reviewed and examined by senior analysts for any outliers, entry errors, or missing variables. Each variable was examined to ensure that responses fell within expected parameters. Potentially invalid responses and outliers were further investigated. Variables were cross checked to each other to ensure internal consistency between responses to interrelated variables.
When inconsistencies or outliers were found, related call sheet logs and notes and the actual recordings of the interview in question were reviewed to determine if data had been incorrectly interpreted or entered by the interviewer. While the survey was still in the field, callbacks were made by supervisors to respondents for cases that could not be reconciled through a review of the logs or recordings. Once the survey interval ended, these cases were flagged and reported.
5.3.1Interviewer Performance
Interviewer performance was ensured through the implementation of standard procedures of survey interviewing, constant monitoring, and a process of verification. The implementation of standard procedures of survey interviewing provided the prerequisites for high-level interviewer performance. Each interviewing shift began with a staff meeting to review any issues that had emerged from previous calling efforts. Interviewers were then assigned a set of call sheets to cover that shift. All call dispositions (date, time, interviewer number, and result) were captured in two ways. First, the survey questionnaire was programmed in CASES to capture the results of each call and to place the information into a database for analysis. Second, call disposition results were collected electronically, and the interviewer identification number, date and time of the call, final disposition, and any comments that the interviewer determined to be relevant were entered on paper call sheets. The use of paper call sheets allowed interviewers to quickly assess each case and determine when was best to call the respondent again. Call sheets were reviewed by a supervisor before each shift who then passed out the call sheets to interviewers to call at all standard times. Analysis of the call dispositions from previous shifts helped to determine when a respondent was most likely to be available to complete the interview. At the end of each shift, a supervisor log was filled out by the head supervisor to document any events and issues that emerged during the shift. The log sheets were reviewed by the survey manager each day. The supervisor log was made available to the BTS OHS project team upon request.
Throughout the survey, a one-to-five supervisor/interviewer ratio was maintained, and each interviewer was monitored at least once each shift. Supervisors were always on the floor with the interviewers and were always available to answer questions or handle problems throughout all phases of interviewing. All interviewers were also monitored via a monitoring station in the survey unit to assure unbiased and reliable data were collected. A silent monitoring process allowed supervisors to listen to interviews live without interviewers’ knowledge. Corrective feedback was promptly provided to interviewers whenever needed, and appropriate actions were taken when necessary. At least once a week, the interviewer’s progress was evaluated through discussion with supervisors, and the interviewers were provided with written evaluations documenting both positive and inappropriate behaviors. All completed surveys were reviewed by supervisors for completeness of responses.
In addition, verification of completed interviews was conducted through callbacks to respondents. About 15 percent of all completed interviews from the previous day were selected by supervisors for verification. The respondents were asked a set of questions to ensure that the appropriate respondent was interviewed and to obtain feedback on the interviewer’s administration of the questionnaire. The verification process was completed by a supervisor alongside the interviewers, further reminding them of the importance of obtaining quality data while treating all respondents with respect.
5.3.2Other Procedures
In addition to general checking and cleaning, responses to “other specify” items were pulled out to determine if they could be back-coded into the pre-existing response codes for close-ended questions. During an interview, the interviewer must make quick decisions regarding the correct response code to use for any item. While most items were easily coded, the coding of responses to some types of questions such as race or ethnicity could be difficult to determine. For this survey, when a response was not easily placed into a pre-existing code, the verbatim response was recorded instead. A review of the verbatim responses helped determine if it could be recoded back into the initial codes. If the responses in the “other specify” category were not matched with any code, they were left unchanged and were provided to the client along with any open-ended question responses. All open-ended verbatim responses were reviewed to ensure that they were complete and understandable. In cases where the response was not complete, the interviewer was asked to call the respondent to re-ask the question.
For call-in interviews, telephones were manned by day-time interviewers and by staff who were trained to conduct interviews. Interviewers were available Monday through Friday, 9 a.m. to 12 a.m.; Saturdays, 10 a.m. to 2 p.m.; and Sundays, 5 p.m. to 12 a.m. in each time zone.
5.4Summary of Data Cleaning
The use of the survey interviewing software CASES greatly facilitates the process of data cleaning because it is designed to only allow pre-programmed codes for responses to be entered into the system. Thus, it effectively prevents invalid responses from being entered erroneously during the process of interviewing. CASES is also extremely flexible in that it allows for continuous internal data quality checks. Once interviewing was completed for the survey, all data were sent through a cleaning process that checked for data inconsistencies. All substantive and disposition result data were then extracted into an ASCII file format several times so that the quality checking process was continuous throughout the survey effort.
After the data were extracted, they were reviewed by research analysts to check for internal consistency according to the interrelationship between variables and to identify any potential error. When an error was identified during the data checking and cleaning process, original data files were reviewed for verification. Corrections were made once the error was confirmed. Detailed notes and records of all changes and corrections were kept and maintained.
5.5Coding of Missing Values
The OHS contains questions that are not asked of certain respondents based on their response(s) to other questions. In addition, there are usually some respondents who do not know the answer to or choose not to answer some questions in the survey. Each of these responses can have a different meaning to the data user. While each of these response categories is important in characterizing the results of the survey, they are often removed from certain analyses, particularly those involving percentages. To preserve the unique characteristics of these responses, three categories of responses are given special codes for easy identification. Table 8 presents the response categories and how they are represented in each data file for October 2009 OHS.
Table 8: Summary of Codes for Missing Values by Data File Format
Response Category |
Dataset Format |
||
SAS® Version 9.1 |
Microsoft Excel® |
Text Comma Delimited |
|
Appropriate skip |
-9 |
-9 |
-9 |
Refused |
-7 |
-7 |
-7 |
Don’t know |
-8 |
-8 |
-8 |
5.6Response Rates
The procedures for response rate calculation are based on the guidelines established by the Council of American Survey Research Organizations (CASRO) in defining a response rate. The response rates are the proportion of completed interviews to the total number of eligible respondents. The total number of eligible respondents is the sum of respondents in scope and the eligible portion of scope-undetermined respondents that is determined by the percentage of respondents in scope in the total number of respondents in scope and out of scope.
The final response rate for the survey is obtained
using the following formula:

A total of 1,082 interviews were completed during the survey period for the national survey and 504 interviews for the survey of targeted MSAs. The numbers of households in scope and out of scope and scope-undetermined households are shown in Table 9 for the national sample and in Table 10 for the sample of targeted MSAs. As shown below, the response rates for both the national sample and the sample of targeted MSAs were below the targeted response rate of 50 percent despite a variety of efforts made to increase responses.
For the national sample, a response rate of 44.1 percent was achieved in the following manner:
![]()
![]()
For the original sample of targted MSAs, a response rate of 43.3 percent was achieved in the following manner:
![]()
![]()
Table 9: Final Dispositions – National Sample
Summary of disposition |
||||
Telephone numbers available |
6,964 |
|||
# Telephone No. released |
5,350 |
|||
Telephone numbers not dialed |
0 |
|||
Telephone number dialed |
5,350 |
|||
CASRO Response rate (%) |
44.1% |
|||
Distribution of household cases by disposition code |
||||
Interviewer Disposition Code4 |
Final Disposition Code |
Disposition Description |
Number of Households |
|
In-Scope Numbers |
1,580 |
|||
01 |
1 |
Interview Completed |
940 |
|
03, 06 |
2 |
Partial Complete |
57 |
|
06, 60, 70, 80, 90, 91 01 |
3 |
Refusal Conversion |
142 |
|
15, 16, 17, 18 – Q |
4 |
Answering Machine/Message – Q |
0 |
|
21, 29 – Q |
5 |
Deaf/Lang/Ill/Mental Incap – Q |
36 |
|
60, 70, 80, 90 – Q |
6 |
Refusal – Q |
173 |
|
91 – Q |
7 |
Hard refusal – Q |
79 |
|
28 – Q |
8 |
R not available during study – Q |
16 |
|
23 – Q |
9 |
R deceased prior to completion of the interview – Q |
0 |
|
44 – Q |
10 |
Area code changed, but not the number – Q |
0 |
|
30, 31, 32 – Q |
31 |
Callback – Q |
137 |
|
45 – Q |
12 |
Cannot complete call – Q |
0 |
|
46 – Q |
13 |
Privacy Manager – Q |
0 |
|
Out-of-Scope Numbers |
1,868 |
|||
40 |
14 |
Business |
674 |
|
47, 48 |
15 |
Computer/Fax/Pager/Cell Phone |
751 |
|
42 |
16 |
Disconnected number |
410 |
|
43 |
17 |
Number change |
24 |
|
22 |
18 |
No one 18 years old or older in HH |
2 |
|
28 |
19 |
Respondent unavailable before and during study |
7 |
|
Scope-Undetermined Numbers |
1,902 |
|||
11 – NQ |
32 |
No answer – NQ |
367 |
|
12 – NQ |
21 |
Busy – NQ |
29 |
|
15 – NQ |
33 |
Answering Machine – NQ |
119 |
|
16, 17, 18 – NQ |
23 |
Left Message – NQ |
0 |
|
45 – NQ |
24 |
Cannot complete call – NQ |
2 |
|
46 – NQ |
25 |
Privacy Manager – NQ |
0 |
|
21, 29 – NQ |
26 |
Deaf/Lang/Ill/Mental Incap – NQ |
33 |
|
60, 70, 80, 90 – NQ |
27 |
Refusal – NQ |
136 |
|
91 – NQ |
28 |
Hard refusal – NQ |
199 |
|
03, 06 – NQ |
29 |
Partial Complete – NQ |
0 |
|
44 – NQ |
30 |
Area code changed, but not the number – NQ |
1 |
|
30, 31, 32 – NQ |
34 |
Callback – NQ |
1,016 |
|
Total |
5,350 |
|||
Table 10: Final Dispositions – Sample of Targeted MSAs
Summary of disposition |
|||
Telephone numbers available |
7,326 |
||
# Telephone No. released |
2,830 |
||
Telephone numbers not dialed |
0 |
||
Telephone number dialed |
2,830 |
||
CASRO Response rate (%) |
43.3 |
||
Distribution of household cases by disposition code |
|||
Interviewer Disposition Code5 |
Final Disposition Code |
Disposition Description |
Number of Households |
In-Scope Numbers |
755 |
||
01 |
1 |
Interview Completed |
429 |
03, 06 |
2 |
Partial Complete |
15 |
06, 60, 70, 80, 90, 91 01 |
3 |
Refusal Conversion |
75 |
15, 16, 17, 18 – Q |
4 |
Answering Machine/Message – Q |
0 |
21, 29 – Q |
5 |
Deaf/Lang/Ill/Mental Incap – Q |
25 |
60, 70, 80, 90 – Q |
6 |
Refusal – Q |
78 |
91 – Q |
7 |
Hard refusal – Q |
54 |
28 – Q |
8 |
R not available during study – Q |
3 |
23 – Q |
9 |
R deceased prior to completion of the interview – Q |
0 |
44 – Q |
10 |
Area code changed, but not the number – Q |
0 |
30, 31, 32 – Q |
31 |
Callback – Q |
76 |
45 – Q |
12 |
Cannot complete call – Q |
0 |
46 – Q |
13 |
Privacy Manager – Q |
0 |
Out-of-Scope Numbers |
1,082 |
||
40 |
14 |
Business |
393 |
47, 48 |
15 |
Computer/Fax/Pager/Cell Phone |
413 |
42 |
16 |
Disconnected number |
257 |
43 |
17 |
Number change |
12 |
22 |
18 |
No one 18 years old or older in HH |
3 |
28 |
19 |
Respondent unavailable before and during study |
4 |
Scope-Undetermined Numbers |
993 |
||
11 – NQ |
32 |
No answer – NQ |
242 |
12 – NQ |
21 |
Busy – NQ |
6 |
15 – NQ |
33 |
Answering Machine – NQ |
27 |
16, 17, 18 – NQ |
23 |
Left Message – NQ |
0 |
45 – NQ |
24 |
Cannot complete call – NQ |
5 |
46 – NQ |
25 |
Privacy Manager – NQ |
4 |
21, 29 – NQ |
26 |
Deaf/Lang/Ill/Mental Incap – NQ |
46 |
60, 70, 80, 90 – NQ |
27 |
Refusal – NQ |
83 |
91 – NQ |
28 |
Hard refusal – NQ |
131 |
03, 06 – NQ |
29 |
Partial Complete – NQ |
0 |
44 – NQ |
30 |
Area code changed, but not the number – NQ |
0 |
30, 31, 32 – NQ |
34 |
Callback – NQ |
449 |
Total |
2,830 |
||
OHS contains questions that ask respondents to supply the demographic information necessary to categorize their age, gender, and/or education. There are usually some respondents who choose not to answer some of these questions in the survey. For respondents that do not want to provide this information, the most common reasons for non-responses are:
I don’t like giving my age
I would rather not say
I don’t like to be labeled, and
that is personal information.
Common reasons for non-responses when asked questions regarding contacts they may have had with any government agencies and/or why they contacted the agencies are:
I don’t want to say because I don’t trust the government,
I don’t want to answer because I have an issue pending, and
I would rather not say.
Appendix A: Final Annotated Survey Questionnaire
2009 Omnibus Household Survey (OHS)
F = Introduction
F1000. Hello, my name is _______ and I’m calling on behalf of the United States Department of Transportation. We’re conducting a survey on transportation issues including security of the transportation system, commuting to work and congestion. Your household has been randomly selected for this study and your opinions will help to strengthen our nation’s transportation system.
F = Determining Eligible Household
F0080. Have I reached you at [telephone number]?
Yes
No – I am very sorry, I must have dialed incorrectly. Thank you, goodbye.
F1010. Are you a member of this household and at least 18 years old?
YES (Go to F1030)
NO
BUSINESS ADDRESS (Go to F1140)
F1020. May I speak to a member of this household who is at least 18 years old?
AVAILABLE (Go to F1000)
NOT AVAILABLE (MAKE APPOINTMENT)
When would be a good time to call back?
THERE ARE NONE (Go to F1140)
F1030. Is this phone number used for. . .
home use only
home and business use, or
business use only
(If 3) – I am very sorry; I’m trying to reach a residence. Thank you. Goodbye.
F = Within Household Sample Selection
F1040. Including you, how many people aged 18 or older currently live in this household?
[IF NEEDED: “Include people who usually stay in this household, but are temporarily away on business, vacation, or in the hospital. Do not include persons who are away on full-time active military duty with the armed forces, students living away from home in their own apartment, or any other family member who may be in a nursing home or other institution.”]
|___|___|# OF ADULT HH MEMBERS
INTERVIEWER: IF NEEDED, SAY “Include people who usually stay in this household, but are temporarily away on business, vacation, or in the hospital. Do not include persons who are away on full-time active military duty with the armed forces, students living away from home in their own apartment, or any other family member who may be in a nursing home or other institution.”
IF PERSON ON THE PHONE IS CHOSEN GO TO F1075 IF NOT GO TO F1050
F1075. A Federal agency may not collect information from a private citizen nor is a person required to respond to an information collection unless the collection displays a valid Office of Management and Budget number. The OMB number for this collection is 2139-0012. All responses to this information collection are voluntary. The information you provide about yourself and your household will be used for statistical purposes only. In accordance with the Confidential Information Protection provisions in Public Law 107-347, your responses will be kept confidential and will not be disclosed in identifiable form. By law, everyone working on this DOT survey is subject to a jail term, a fine, or both if he or she discloses ANY information that could identify any confidential survey response. Your participation in this study will only take about 15 minutes. If you would like to make comments on any aspect of this information collection, including the length of the survey, I would be happy to provide you with the appropriate address. Would you like the address?
INTERVIEWER: READ ADDRESS IF NECESSARY
Information Collection Clearance Officer, U.S. Department of Transportation, Research and Innovative Technology Administration, RTAD-21, Room E35-116, 1200 New Jersey Avenue, SE, Washington, DC 20590.
F1080. What is your first name?
NAME: _________________________________________________________
GENDER:
1) MALE AGE: |___|___|
2) FEMALE AGE: |___|___|
(Skip to question M1000)
IF PERSON ON THE PHONE IS NOT CHOSEN CONTINUE:
F1050. The computer has randomly determined that one of the [F1040 answer minus 1] adults other than you should be selected for the rest of the interview. To help us select this person, do you know who has the NEXT birthday among these adults?
YES
NO (Go to F1070)
F1060. Other than you then, which adult has the NEXT birthday?
(A FIRST NAME IS SUFFICIENT IF IT UNIQUELY IDENTIFIES THE HH MEMBER. IF NEEDED – “We need some way to ask for this person should we need to call back. If you prefer, just give me that person’s gender and age.”)
NAME AND AGE: __________________________________________________
OR GENDER:
MALE AGE: |___|___|
FEMALE AGE: |___|___|
(Go to F1110)
INTERVIEWER: A FIRST NAME IS SUFFICIENT IF IT UNIQUELY IDENTIFIES THE HH MEMBER. IF NEEDED SAY, “We need some way to ask for this person should we need to call back. If you prefer, just give me that person’s gender and age.”
F1070. So that the computer can choose someone to interview, please tell me the first names and ages of the [FILL # FROM F1040 MINUS 1] adults currently living in this household. Please do not include yourself.
[IF NEEDED: “Include people who usually stay in this household, but are temporarily away on business, vacation, or in the hospital. Do not include persons who are away on full-time active military duty with the armed forces, students living away from home in their own apartment, or any other family member who may be in a nursing home or other institution.”]
IF NOT OBVIOUS, ASK: “Is {NAME} male or female?”
IF R ANSWERS DK OR RF TO IDENTIFY HH MEMBERS, EXIT INTERVIEW.
FIRST NAME GENDER AGE
MALE
___________________________ 2) FEMALE |___|___|
1) MALE
___________________________ 2) FEMALE |___|___|
1) MALE
___________________________ 2) FEMALE |___|___|
F1081. This study is designed to select one household adult to answer the questions. The computer has chosen the other adult in the household to participate in the next part of the study. What is the other adult’s name?
INTERVIEWER: PROBE FOR INFORMATION THAT UNIQUELY IDENTIFIES THE HH MEMBER SELECTED.
NAME: _________________________________________________________
GENDER:
1) MALE AGE: |___|___|
2) FEMALE AGE: |___|___|
(If extended respondent = screener respondent, go to F1120. Otherwise, continue.)
F1110. (HH MEMBER) has been selected to participate in the next part of the study. May I speak to (HH MEMBER)?
AVAILABLE (Go to F1130)
NOT AVAILABLE (MAKE APPOINTMENT)
F1130. Hello, my name is _______ and I’m calling on behalf of the U. S Department of Transportation. We’re conducting a survey on transportation issues including security of the transportation system, commuting to work and congestion and would like to include your opinions and experiences. For quality purposes only, a supervisor may be monitoring this call.
A Federal agency may not collect information from a private citizen nor is a person required to respond to an information collection unless the collection displays a valid Office of Management and Budget number. The OMB number for this collection is 2139-0012. All responses to this information collection are voluntary. The information you provide about yourself and your household will be used for statistical purposes only. In accordance with the Confidential Information Protection provisions in Public Law 107-347, your responses will be kept confidential and will not be disclosed in identifiable form. By law, everyone working on this DOT survey is subject to a jail term, a fine, or both if he or she discloses ANY information that could identify any confidential survey response. Your participation in this study will only take about 15 minutes. If you would like to make comments on any aspect of this information collection, including the length of the survey, I would be happy to provide you with the appropriate address. Would you like the address?
INTERVIEWER: READ ADDRESS IF NECESSARY
Information Collection Clearance Officer, U.S. Department of Transportation, Research and Innovative Technology Administration, RTAD-21, Room E35-116, 1200 New Jersey Avenue, SE, Washington, DC 20590.
(Skip to question M1000)
FINAL QUESTION:
F1140. Those are all of the questions that I have. If you have questions about transportation issues or just want some information, you can call 1-800-853-1351 email questions to [email protected] or visit the www.bts.gov/omnibus web site for additional information. Thank you for your time today.
M=Mode Use Questions
M1000. First I’d like to ask about the types of transportation you use during a TYPICAL WEEK. We are defining a typical week beginning on Sunday ending the following Saturday.
____CONTINUE
M1010. During a typical week, on how many DAYS do you drive or ride in a car, van, SUV, pickup truck, RV or motorcycle?
ENTER NUMBER
____DAYS
M1020. During a typical week, on how many DAYS do you travel by taxi or limousine?
ENTER NUMBER
____DAYS
M1030. During a typical week, on how many DAYS do you use public transportation?
ENTER NUMBER
____DAYS
M1040. During a typical week, on how many DAYS do you ride a bicycle outdoors for any reason?
ENTER NUMBER
____DAYS
INTERVIEWER READ IF NECESSARY: “In this instance, riding a bicycle outdoors does not have to be for transportation purposes.”
L = Community Livability Questions
L1000. The next few questions are about the transportation-related characteristics of the community that you live in. First, which of these categories would you say best represents the type of community where you live?
INTERVIEWER: READ ALL CATEGORIES. MARK ONLY ONE
Urban Area in Downtown or the City Center
Urban Area NOT in the Downtown or City Center
Suburban
Rural
L1020. Next I am going to read a list of transportation options or features available in some communities. Please tell me how important each is to have in your community – “very important,” “somewhat important,” “somewhat unimportant,” or “not important” to you.
Sidewalks, paths or other safe walking routes to shopping, work, or schools?
Bike lanes or paths to shopping, work, or schools?
Reliable local bus, rail or ferry transportation that can be reached without driving?
Reliable long-distance bus or train transportation to and from major metropolitan areas?
Major roads or highways that access and serve your community?
Easy access to an airport?
Pedestrian-friendly streets or boulevards in the downtown or central business district?
Adequate parking in the downtown or central business district?
L1040. The next few questions are about activities that sometimes happen while people are driving a motor vehicle. For each statement, please tell me whether you strongly agree, somewhat agree, somewhat disagree, or strongly disagree.
Drivers of motor vehicles should be allowed to talk on a hand-held cell phone while driving…
Drivers of motor vehicles should be allowed to talk on a cell phone using a hands-free device while driving…
Drivers of motor vehicles should be allowed to text message on a cell phone, blackberry or similar device while driving…
Drivers of motor vehicles should be allowed to eat while driving…
Controls on new cars should be mounted on the steering wheel so that drivers do not have to reach across to operate the radio or other audio player…
Television and video monitors in cars should be allowed to be mounted in a way that they are visible to drivers of OTHER cars…
J = Journey to Work Items
J1000. The next questions are about traveling to and from work.
_____ CONTINUE
J1010. LAST WEEK, did you work for pay OUTSIDE YOUR HOME?
Yes (Skip to question J1030)
No
8) Don’t know (DON’T READ)
9) Refused (DON’T READ)
J1020. LAST WEEK, did you perform any volunteer work OUTSIDE YOUR HOME?
1) Yes (Skip to question J1035)
No (Skip to question T1000)
8) Don’t know (DON’T READ)
9) Refused (DON’T READ)
J1030. For the next questions, please use your main job. By main job we mean the one at which you usually work the most hours.
LAST WEEK, on how many DAYS did you travel from home to work?
_____ days ENTER NUMBER
CATI program should ensure that response is less than 8.
(Skip to question J1040)
J1035. For the next question, please use your main volunteer work place. By main volunteer work place we mean the one at which you usually work the most hours
LAST WEEK, on how many DAYS did you travel from home to your volunteer work place?
_____ days ENTER NUMBER
CATI program should ensure that response is less than 8.
(Skip to question J1045)
J1040. LAST WEEK, which of the following types of transportation did you use while traveling from home to work? Did you:
INTERVIEWER: READ LIST YES NO
drive alone in a company vehicle 1 2
drive with others in a company vehicle 1 2
drive alone in a non-company vehicle 1 2
drive with others in a non-company vehicle 1 2
drive or ride in a carpool or vanpool 1 2
ride a bus 1 2
ride a subway 1 2
ride a train 1 2
ride a ferry 1 2
ride a bicycle 1 2
walk 1 2
INTERVIEWER: Do not include short walks, e.g.,
from the house to the car/parking lot to the office.
12) Used some other mode (SPECIFY) 1 2
______________________________________________
(Skip to question J1050)
J1045. LAST WEEK, which of the following types of transportation did you use while traveling from home to your volunteer work place? Did you:
INTERVIEWER: READ LIST
YES NO
drive alone in a company vehicle 1 2
drive with others in a company vehicle 1 2
drive alone in a non-company vehicle 1 2
drive with others in a non-company vehicle 1 2
drive or rode in a carpool or vanpool 1 2
ride a bus 1 2
ride the subway 1 2
ride a train 1 2
ride a ferry 1 2
10) ride a bicycle 1 2
11) walk 1 2
INTERVIEWER: Do not include short walks, e.g.,
from the house to the car/parking lot to the office.
12) Used some other mode (SPECIFY) 1 2
______________________________________________
J1050. IF J1020 = 1, INTERVIEWER WILL READ:
Please consider “work” as your main volunteer work place.
LAST WEEK, how would you rate the level of traffic congestion on your commute to work?
INTERVIEWER: READ 1–4 ONLY
1) Very congested
2) Moderately congested
3) Slightly congested
4) Not at all congested
8) Don’t know (DON’T READ)
9) Refused (DON’T READ)
J1060. Now I’d like to ask you about your commute to work over the LAST 12 MONTHS.
Thinking about the LAST 12 MONTHS, have you done any of the following to improve your commute to work? Have you:
INTERVIEWER: READ LIST
Yes No
1) Changed your schedule or work hours to improve your commute 1 2
2) Moved to a home closer to work to improve your commute 1 2
3) Moved to a home closer to public transportation to improve your commute 1 2
4) Changed jobs or left a job to improve your commute 1 2
5) Changed office locations to improve your commute 1 2
6) Worked at home instead of your usual work site to improve your commute 1 2
7) Paid to use a toll road or toll lane to improve your commute 1 2
8) Made any other change to improve your commute? 1 2
(SPECIFY:____________________________________)
J1065. Thinking about your commute trips in the LAST 12 MONTHS, about how often would you say that you made additional stops for some other purpose during your trip to or from work? Include stops to go to the store, purchase gas, pick someone up from work or school, or perform some other non-work related business.
INTERVIEWER: READ ALL – MARK ONE
Made additional stops on at least half of all commute trips
Made additional stops on some but fewer than half of all commute
trips
Did not make any additional trips or almost none
J1070. Again, thinking about the LAST 12 MONTHS, would you say the traffic congestion on your commute to work has gotten...
INTERVIEWER: READ 1–5 ONLY
1) Much better
2) Somewhat better
3) Stayed about the same
4) Somewhat worse
5) Much worse
8) Don’t know (DON’T READ)
9) Refused (DON’T READ)
(If J1020 = 1, skip to T1000)
J1080. Is at least part of the work that you do in your main job something you could do at home?
Yes
No (Skip to T1000)
8) Don’t know (DON’T READ)
9) Refused (DON’T READ)
J1090. Does your main employer allow workers to sometimes work at home instead of coming into the work place?
1) Yes
2) No (Skip to T1000)
8) Don’t know (DON’T READ)
9) Refused (DON’T READ)
J1100. LAST WEEK, did you work at home instead of traveling to your usual workplace of your main job? This does not include taking work home at night or over the weekend, working at home while sick, or self-employed persons who work at home.
1) Yes
2) No (Skip to T1000)
8) Don’t know (DON’T READ)
9) Refused (DON’T READ)
J1110. LAST WEEK, on how many days did you work at home instead of going to your usual workplace of your main job?
(CATI programmed to accept less than 8.)
_______ Days
IF THE RESPONDENT GIVES ANY 1 “Yes” RESPONSES to J1040 and J1110 HAS “7” as a RESPONSE, THEN INTERVIEWER SAYS: You stated that you commuted to the workplace of your main job last week, and you worked from home for your main job for 7 days last week. Please tell me why you commuted and worked from home during the same day(s).
TYPE COMMENT _____________________________
J1120. What is your primary reason for working at home instead of traveling to your usual work place of your main job?
INTERVIEWER: DO NOT READ LIST.
Convenience
(INTERVIEWER PROBE: Why is
working at home more convenient?–
ENTER RESPONSE AS A NOTE
Saves the company money
Saves me money
Saves me time
To avoid congestion
Allows me to take care of family members/be home when kids come
home
I don’t live in the same area as the company I work for
I work for multiple businesses
I get more work done at home
For health reasons – disability reasons
Lack of transportation
12) Any other reason: (SPECIFY:___________________________ _)
98) Don’t know
99) Refused
T = TSA Items
T1000. The next few questions are about commercial air travel.
_____ CONTINUE
T1010 During the LAST 12 MONTHS (since October of 2008), have you flown on a commercial airline?
Yes
No (Skip to T1160)
8) Don’t know (DON’T READ)
9) Refused (DON’T READ)
T1020. During September 2009 did you fly on a commercial airline?
1) Yes
2) No (Skip to T1040)
8) Don’t know (DON’T READ)
9) Refused (DON’T READ)
T1030. How many DAYS in September 2009 did you fly on a commercial airline?
ENTER NUMBER
____days
T1040. In what month and year was your most recent commercial airline flight that departed from a U. S. airport?
_________________MONTH _____________YEAR
(Skip to question T1160 if before October 2008)
T1050. Please let me verify your last answer as [insert respondent’s last answer]
1) Yes, correct – CONTINUE
2) No, incorrect
T1060. Please think about your MOST RECENT FLIGHT that departed from a U.S.
airport.
For your most recent flight, how long did you wait in line to get to the first passenger security screening checkpoint where you walked through a metal detector and your carry-on items were x-rayed. Don’t include the time required to get through the checkpoint –ONLY the time you waited in line to get to the checkpoint. How long did you wait? Computer Assisted Telephone Interviewing (CATI) system must ensure entry for both hours and minutes – cannot have zero for both fields. CATI system to ask for verification if more than 4 hours 59 minutes. Probe why wait was so long and enter information into open-end box.
_____ hours and_____ minutes
INTERVIEWER PROBE/COMMENT: IF OVER 4 HOURS, Please consider the question reads: “how long did you wait in line to get to the first passenger security screening checkpoint where you walked through a metal detector and your carry-on items were x-rayed. Don’t include the time required to get through the checkpoint – ONLY the time you waited in line to get to the checkpoint.”
T1080. For your most recent flight, thinking about the amount of time you spent waiting in line to get to the passenger security screening checkpoint, would you say that it was
INTERVIEWER: READ 1–5 ONLY
Much shorter than expected
Shorter than expected
About what you expected
Longer than you expected
Much longer than you expected
INTERVIEWER: DO NOT READ, IF PROVIDED, RECORD
You had no expectation
8) Don’t know (DON’T READ)
9) Refused (DON’T READ)
T1070. For your most recent flight, how satisfied were you overall with your experience at the passenger security screening check point? Were you
INTERVIEWER: READ 1–4 ONLY
Very satisfied
Satisfied
Dissatisfied
Very dissatisfied
8) Don’t know (DON’T READ)
9) Refused (DON’T READ)
T1090. For your most recent flight, how satisfied were you with the time it took to screen you and your carry-on items? This is the length of time between placing your carry-on items on the x-ray table and exiting the security screening area in the direction of the boarding gates. This does not include the time you spent waiting in line to get to the passenger security screening checkpoint.
INTERVIEWER: READ 1–4 ONLY
1) Very satisfied
2) Satisfied
3) Dissatisfied
4) Very dissatisfied
8) Don’t know (DON’T READ)
9) Refused (DON’T READ)
T1100. For your most recent flight, were you selected for additional screening at the passenger security screening checkpoint such as body wand screening and/or a body pat-down?
INTERVIEWER: READ IF NEEDED: A body wand search is when a hand held electronic device in the shape of a slender stick is held very close and moved over the front, back and sides of your body. A body pat down is when the front, back and sides of your body are lightly hand patted for the purpose of detecting something concealed under your clothing.
1) Yes
2) No (Skip to T1110)
8) Don’t know (DON’T READ)
9) Refused (DON’T READ)
T1102. Now I’d like you to think about why you believe you were selected for additional screening. Would you say it was for…
INTERVIEWER: READ 1–5 ONLY
1) Medical Reasons
2) Travel Documents
3) Clothing
4) Randomly Selected
5) Another Reason: Specify: ___________________
8) Don’t know (DON’T READ)
9) Refused (DON’T READ)
T1104. For your most recent flight, did you make a complaint about receiving additional passenger screening at the security checkpoint?
1) Yes
2) No (Skip to T1110)
T1106. How satisfied are you with the resolution of your complaint?
INTERVIEWER: READ 1–5 ONLY
1) Very satisfied
2) Satisfied
3) Dissatisfied
4) Very dissatisfied
5) Does not apply; there was/has been no resolution
8) Don’t know (DON’T READ)
9) Refused (DON’T READ)
T1110. For your most recent flight, would you say the passenger screening you experienced at the security checkpoint was…
INTERVIEWER: READ 1–3 ONLY
Excessive
Appropriate
Inadequate
8) Don’t know (DON’T READ)
9) Refused (DON’T READ)
T1120. For your most recent flight, how satisfied were you with the courtesy of the Transportation Security Officer at the passenger security screening checkpoint?
INTERVIEWER: READ 1–4 ONLY
Very satisfied
Satisfied
Dissatisfied
Very dissatisfied
8) Don’t know (DON’T READ)
9) Refused (DON’T READ)
T1170. What is your level of confidence in the ability of the Transportation Security Officer to keep air travel secure?
INTERVIEWER: READ 1–5 ONLY
1) No confidence
2) A small amount of confidence
3) A moderate amount of confidence
4) A great deal of confidence
5) Total confidence
8) Don’t know (DON’T READ)
9) Refused (DON’T READ)
T1124. How confident are you in the ability of the equipment used to screen passengers and carry-on bags to keep air travel secure? Would you say you have…
INTERVIEWER: READ 1–5 ONLY
1) No confidence
2) A small amount of confidence
3) A moderate amount of confidence
4) A great deal of confidence
5) Total confidence
8) Don’t know (DON’T READ)
9) Refused (DON’T READ)
INTERVIEWER: READ IF NEEDED: Examples of equipment used to screen passengers and carry-on baggage are x-ray machines and hand-held metal detectors.
T1128. How confident are you in the ability of the equipment used to screen checked bags. Would you say you have…
INTERVIEWER: READ 1–5 ONLY
1) No confidence
2) A small amount of confidence
3) A moderate amount of confidence
4) A great deal of confidence
5) Total confidence
8) Don’t know (DON’T READ)
9) Refused (DON’T READ)
INTERVIEWER: READ IF NEEDED: An example of equipment used to screen checked baggage is an x-ray machine.
T1130. How informed do you feel you are about passenger security screening procedures? Are you…
INTERVIEWER: READ 1–4 ONLY
1) Very well informed
2) Moderately well informed
3) Slightly informed
4) Not at all informed
8) Don’t know (DON’T READ)
9) Refused (DON’T READ)
T1140. Where have you received information about the airport passenger security screening process?
INTERVIEWER DO NOT READ LIST – RECORD ALL ANSWERS
1) Transportation Security Administration website/blog
2) My own travel experience
3) Airline or travel agent website
4) Placed a call or email to the airline
5) Placed a call or email to a travel agent
6) Printed material such as a brochure or pamphlet
7) Signs displayed at airport
8) Radio, television or newspaper
9) Friends, family, word of mouth
10) Some other source: Specify: __________________________
INTERVIEWER: (RECORD ANY COMMENT IN T1150 THAT COULD NOT BE CATEGORIZED AS “Other” IN QUESTION T1140) EXAMPLE : “CHANGES SO OFTEN WHY BOTHER TO CHECK” or “NO ONE CAN EVER GIVE YOU A STRAIGHT ANSWER”
T1150. Comment _________________________________________________________
T1154. How satisfied are you with your accessibility to information about airport screening procedures?
INTERVIEWER: READ 1–4 ONLY
1) Very satisfied
2) Satisfied
3) Dissatisfied
4) Very dissatisfied
8) Don’t know (DON’T READ)
9) Refused (DON’T READ
T1156. For your most recent flight, did you request an explanation of security procedures?
Yes
No (Skip to T1160)
T1158 For your most recent flight, how satisfied were you with the way security procedures were explained to you at the security screening checkpoint?
INTERVIEWER: READ 1–4 ONLY
1) Very satisfied
2) Satisfied
3) Dissatisfied
4) Very dissatisfied
8) Don’t know (DON’T READ)
9) Refused (DON’T READ)
Questions T1160, T1165 and T1180 are asked of all respondents including those that have not flown in the last 12 months.
T1160. What is your level of confidence in the ability of the flight crew to defend an aircraft and its passengers from individuals with hostile intentions?
INTERVIEWER: READ 1–5 ONLY
1) No confidence
2) A small amount of confidence
3) A moderate amount of confidence
4) A great deal of confidence
5) Total confidence
8) Don’t know (DON’T READ)
9) Refused (DON’T READ)
INTERVIEWER: READ IF NEEDED: Flight Crew refers to all employees working on an aircraft including pilot and flight attendants.
T1165. Federal Air Marshals are routinely assigned to randomly selected flights for
security purposes. What is your level of confidence in the ability of the Federal Air Marshals to defend an aircraft and its passengers from individuals with hostile intentions?
INTERVIEWER: READ 1–5 ONLY
1) No confidence
2) A small amount of confidence
3) A moderate amount of confidence
4) A great deal of confidence
5) Total confidence
8) Don’t know (DON’T READ)
9) Refused (DON’T READ)
T1180. If cell phones did not interfere with airplane communications systems, do you think that passengers should be allowed to use their cell phones during a flight?
INTERVIEWER: READ 1–5 ONLY
1) Definitely should
2) Probably should
3) Not sure
4) Probably should not
5) Definitely should not
8) Don’t know (DON’T READ)
9) Refused (DON’T READ)
INTERVIEWER: READ: During September 2009, did you use any of the following types of public transportation system either in your area of residence or while visiting somewhere else within the U.S. ?
T1200. During September 2009, did you use a subway system or elevated train?
1) Yes
2) No (Skip to T1210)
T1205. The next question refers to terrorism; not crime in general.
How secure did you feel when you used subway system or elevated train?
INTERVIEWER: READ 1–4 ONLY
Very secure
Moderately secure
Somewhat secure
Not at all secure
8) Don’t know (DON’T READ)
9) Refused (DON’T READ)
T1210. During September 2009, did you use any of the following types of public
transportation system? Water ferry or water taxi?
1) Yes
2) No (Skip to T1220)
T1215. The next question refers to terrorism; not crime in general.
How secure did you feel when you used water ferry or water taxi.
INTERVIEWER: READ 1–4 ONLY
1) Very secure
2) Moderately secure
3) Somewhat secure
4) Not at all secure
8) Don’t know (DON’T READ)
9) Refused (DON’T READ)
T1220. During September 2009, did you use any of the following types of public
transportation system? Light rail or street car?
1) Yes
2) No (Skip to T1230)
T1225. The next question refers to terrorism; not crime in general.
How secure did you feel when you used light rail or street car?
INTERVIEWER: READ 1–4 ONLY
1) Very secure
2) Moderately secure
3) Somewhat secure
4) Not at all secure
8) Don’t know (DON’T READ)
9) Refused (DON’T READ)
T1230. During September 2009, did you use any of the following types of public
transportation system? Commuter rail or long distance train?
1) Yes
2) No (Skip to T1250)
T1235. The next question refers to terrorism; not crime in general.
How secure did you feel when you used commuter rail or long distance train.
INTERVIEWER: READ 1–4 ONLY
1) Very secure
2) Moderately secure
3) Somewhat secure
4) Not at all secure
8) Don’t know (DON’T READ)
9) Refused (DON’T READ)
T1250. During September 2009, did you use any of the following types of public
transportation system? Transit Bus, commuter bus, or intercity motor coach.
INTERVIEWER: READ IF NEEDED: Transit bus refers to city buses; commuter bus refers to buses that run within a metropolitan area (usually from suburban areas to city center), stop only at specified locations rather than at every bus stop, and that bring people to work and back home (usually morning and evening rush hours); and intercity motor coaches are scheduled large comfortable buses that make trips between cities.
1) Yes
2) No (Skip to T1280)
T1255. How secure did you feel when you travelled by transit bus, commuter bus, or intercity motor coach?
INTERVIEWER: READ 1–4 ONLY
1) Very secure
2) Moderately secure
3) Somewhat secure
4) Not at all secure
8) Don’t know (DON’T READ)
9) Refused (DON’T READ)
INTERVIEWER: If the respondent did not use any of these modes (replied “NO” to each of questions T1200, T1210, T1220, T1230, and T1250), skip to question D1000.
T1280. The next question refers to terrorism; not crime in general.
What is your level of confidence that security procedures for public transit will keep you safe from individuals with hostile intentions?
INTERVIEWER: READ 1–4 ONLY
1) No confidence
2) A small amount of confidence
3) A moderate amount of confidence
4) A great deal of confidence
5) Total confidence
8) Don’t know (DON’T READ)
9) Refused (DON’T READ)
T1300. How much additional time would you be willing to spend in transit (on public transportation) for increased security measures under elevated threat conditions?
INTERVIEWER: DO NOT READ LIST
No additional time
1–5 minutes
6–10 minutes
11–15 minutes
16–20 minutes
More than 20 minutes
8) Don’t know
9) Refused
D = Demographic Questions
D1000. This final section asks for information to help us summarize the study results. No identifying information about you or your household will ever be released or published.
______ CONTINUE
D1010. How many vehicles are owned, leased, or available for regular use by the people who currently live in your household? Please be sure to include motorcycles, mopeds, and RVs?
ENTER NUMBER ______
(INTERVIEWER: IF RESPONDENT ANSWERS 10 OR MORE, RECORD AS 10)
D1020. Do you have a medical condition that makes it difficult to travel outside the home?
Yes
No
D1040. Please tell me the month and year you were born.
______________MONTH _______________YEAR
CATI system make sure the respondent is at least 18 years of age
CATI system ask for interviewer to verify if respondent is 100 or greater.
CATI system to match age with F1060 or F1070 if age is entered.
INTERVIEWER: If respondent refuses, use the question below to attempt to get their age.
If I read some age ranges, would you be willing to stop me when I get to the category that includes your age?
INTERVIEWER: READ LIST UNTIL RESPONDENT STOPS YOU.
18 to 24
25 to 34
35 to 44
45 to 54
55 to 64
65 to 74
75 or older
CATI system to match age category with F1060 or F1070 if age is entered
D1050. Are you male or female?
RECORD GENDER; ASK ONLY IF NECESSARY
1) Male
2) Female
D1060. Do you consider yourself to be Spanish, Hispanic or Latino?
Yes
(If “Yes,” INTERVIEWER MUST READ: “People who identify themselves as Spanish, Hispanic or Latino origin may be of any race.”
(INTERVIEWER: READ ONLY IF NEEDED: “Origin can be viewed as the heritage, nationality group, lineage, or country of birth of the person or the person’s parents or ancestors before their arrival in the United States.”)
No
8) Don’t know
9) Refused
D1070. What is your race? Please select one or more.
INTERVIEWER: READ 1–5 ONLY. READ PARENTHETICAL ONLY IF RESPONDENT ASKS FOR CLARIFICATION. RECORD ALL THAT APPLY
White
Black or African American
American Indian or Alaska Native (Eskimo, Aleut)
Asian (Asian Indian, Chinese, Filipino, Japanese, Korean, Vietnamese)
Native Hawaiian or Other Pacific Islander (Guamanian, Chamorro, Samoan)
INTERVIEWER: DO NOT READ LAST OPTION. ENTER ONLY IF RESPONDENT PROVIDES A DIFFERENT OPTION THAN LISTED ABOVE.
Other – SPECIFY ____________
8) Don’t know (DON’T READ)
9) Refused (DON’T READ)
D1080. What is the highest level of education you’ve completed?
INTERVIEWER: DO NOT READ LIST
1) LESS THAN HIGH SCHOOL GRADUATE
2) HIGH SCHOOL GRADUATE (OR GED)
3) SOME COLLEGE (OR TECHNICAL VOCATIONAL
SCHOOL/PROFESSIONAL BUSINESS SCHOOL)
4) TWO-YEAR COLLEGE DEGREE (A.A.: ASSOCIATE IN ARTS)
5) FOUR-YEAR COLLEGE DEGREE (B.A. OR B.S.: BACHELOR OF
ARTS/SCIENCE DEGREE)
6) GRADUATE DEGREE (MASTER’S, PH.D., LAWYER, MEDICAL
DOCTOR)
8) DON’T KNOW
9) REFUSED
D1090. Please stop me when I reach the category that includes your household’s total annual income for last calendar year, that is, 2008:
INTERVIEWER: READ LIST UNTIL RESPONDENT STOPS YOU TO SELECT A CATEGORY
Under $15,000
From $15,000 to less than $30,000
From $30,000 to less than $50,000
From $50,000 to less than $75,000
From $75,000 to less than $100,000
From $100,000 to less than $125,000
$125,000 or more
Don’t know (DON’T READ)
Refused (DON’T READ)
D1160. How many home telephone numbers do you have in your household? Please do not count numbers for cell phones, or phone lines that are used exclusively for business purposes, computers or fax machines.
1) One
2) Two
3) Three
4) Four or more
8) Don’t know
9) Refused
D1170 INTERVIEWER: READ AFTER RESPONDENT HAS GIVEN ANSWER: “So, you have ______ phone numbers that are not used exclusively for business, computers, fax machines or cell phones?”
D1180. In order to classify your household for statistical purposes, what is your ZIP code? ENTER NUMBER
___ ___ ___ ___ ___
D1190. Did your household receive an advance notice in the mail concerning this study?
Yes
No
Not sure
D1200. This concludes the study questions. On behalf of the United States Department of Transportation, I thank you for your time. Goodbye.
_____ CONTINUE
Interviewer Close Out Questions |
THESE QUESTIONS ARE ANSWERED BY THE INTERVIEWER AFTER THE RESPONDENT HANGS UP.
I0050. HOW WELL DID THE RESPONDENT SEEM TO UNDERSTAND THE QUESTIONS?
Not at all
Not very well
Well
Very well
I0100. HOW COOPERATIVE WAS THE RESPONDENT IN ANSWERING THE QUESTIONS?
Not at all cooperative
Not very cooperative
Cooperative
Very cooperative
I0150. IN WHAT LANGUAGE WAS THE INTERVIEW CONDUCTED?
English
Spanish
Both English and Spanish
Other – SPECIFY __________________
PLEASE NOTE ANYTHING ELSE YOU FEEL IS HELPFUL OR IMPORTANT ABOUT THIS INTERVIEW. CONTINUE TO ENTER TEXT OF RESPON
Appendix B: Data Dictionary
Question Code |
Variable Name |
Variable description |
Type |
Length - MSA Data Set |
Length - National Data Set |
Format |
||||||||
|
CASEID |
Case Identification Number |
Char |
6 |
6 |
|
||||||||
|
CENDIV |
Census division |
Num |
8 |
8 |
cendivf |
||||||||
|
|
1 = New England |
|
|
|
|
||||||||
|
|
2 = Middle Atlantic |
|
|
|
|
||||||||
|
|
3 = East North Central |
|
|
|
|
||||||||
|
|
4 = West North Central |
|
|
|
|
||||||||
|
|
5 = South Atlantic |
|
|
|
|
||||||||
|
|
6 = East South Central |
|
|
|
|
||||||||
|
|
7 = West South Central |
|
|
|
|
||||||||
|
|
8 = Mountain |
|
|
|
|
||||||||
|
|
9 = Pacific |
|
|
|
|
||||||||
|
CREGION |
Census region |
|
8 |
8 |
regionf |
||||||||
|
|
1 = Northeast |
|
|
|
|
||||||||
|
|
2 = Midwest |
|
|
|
|
||||||||
|
|
3 = South |
|
|
|
|
||||||||
|
|
4 = West |
|
|
|
|
||||||||
|
METRO |
Metropolitan status |
Num |
8 |
8 |
metrof |
||||||||
|
|
1 = Inside MSA |
|
|
|
|
||||||||
|
|
2 = Outside MSA |
|
|
|
|
||||||||
|
MSASTRAT |
Numeric code for nine targeted MSAs |
|
|
Not available |
|
||||||||
|
|
1 = Atlanta-Sandy Springs-Marietta, GA |
Num |
8 |
|
msaf |
||||||||
|
|
2 = Boston-Cambridge-Quincy, MA-NH |
|
|
|
|
||||||||
|
|
3 = Chicago-Naperville-Joliet, IL-IN-WI |
|
|
|
|
||||||||
|
|
4 = Los Angeles-Long Beach- Santa Ana , CA |
|
|
|
|
||||||||
Question Code |
Variable Name |
Variable label and description |
Type |
Length - MSA Data Set |
Length - National Data Set |
Format |
||||||||
|
|
5 = Miami-Fort Lauderdale-Pompano Beach, FL |
|
|
|
|
||||||||
|
|
6 = New York-Northern New Jersey-Long Island, NY-NJ-PA |
|
|
|
|
||||||||
|
|
7 = Philadelphia-Camden-Wilmington, PA-NJ-DE-MD |
|
|
|
|
||||||||
|
|
8 = San Francisco-Oakland-Fremont, CA |
|
|
|
|
||||||||
|
|
9 = Washington-Arlington-Alexandria, DC-VA-MD-WV |
|
|
|
|
||||||||
M1010 |
M1010 |
During a typical week on how many days do you drive or ride in a car, van, SUV, pickup truck, RV or motorcycle |
Num |
3 |
3 |
fornumf |
||||||||
|
|
0 = MIN VALUE |
|
|
|
|
||||||||
|
|
7 = MAX VALUE |
|
|
|
|
||||||||
|
|
-7 = Refused |
|
|
|
|
||||||||
|
|
-8 = Don't know |
|
|
|
|
||||||||
M1020 |
M1020 |
During a typical week on how many days do you travel by taxi or limousine |
Num |
3 |
3 |
fornumf |
||||||||
|
|
0 = MIN VALUE |
|
|
|
|
||||||||
|
|
7 = MAX VALUE |
|
|
|
|
||||||||
|
|
-7 = Refused |
|
|
|
|
||||||||
|
|
-8 = Don’t know |
|
|
|
|
||||||||
M1030 |
M1030 |
During a typical week on how many days do you use public transportation |
Num |
3 |
3 |
fornumf |
||||||||
|
|
0 = MIN VALUE |
|
|
|
|
||||||||
|
|
7 = MAX VALUE |
|
|
|
|
||||||||
|
|
-7 = Refused |
|
|
|
|
||||||||
|
|
-8 = Don’t know |
|
|
|
|
||||||||
M1040 |
M1040 |
During a typical week on how many days do you ride a bicycle outdoors for any reason |
Num |
3 |
3 |
fornumf |
||||||||
|
|
0 = MIN VALUE |
|
|
|
|
||||||||
|
|
7 = MAX VALUE |
|
|
|
|
||||||||
|
|
-7 = Refused |
|
|
|
|
||||||||
|
|
-8 = Don’t know |
|
|
|
|
||||||||
L1000 |
L1000 |
Which of the categories would you say best represents the type of community where you live? |
Num |
3 |
3 |
L1000f |
||||||||
|
|
1 = Urban Area in Downtown or the City Center |
|
|
|
|
||||||||
|
|
2 = Urban Area NOT in the Downtown or City Center |
|
|
|
|
||||||||
|
|
3 = Suburban |
|
|
|
|
||||||||
Question Code |
Variable Name |
Variable label and description |
Type |
Length - MSA Data Set |
Length - National Data Set |
Format |
||||||||
|
|
4 = Rural |
|
|
|
|
||||||||
|
|
-7 = Refused |
|
|
|
|
||||||||
|
|
-8 = Don’t know |
|
|
|
|
||||||||
L1020 |
L1020_A |
How important are sidewalks, paths or other safe walking routes to shopping, work, or schools? |
Num |
3 |
3 |
L1020f |
||||||||
|
|
1 = Very important |
|
|
|
|
||||||||
|
|
2 = Somewhat important |
|
|
|
|
||||||||
|
|
3 = Somewhat unimportant |
|
|
|
|
||||||||
|
|
4 = Not important |
|
|
|
|
||||||||
|
|
-7 = Refused |
|
|
|
|
||||||||
|
|
-8 = Don’t know |
|
|
|
|
||||||||
L1020 |
L1020_B |
How important are bike lanes or bike paths to shopping, work, or schools? |
Num |
3 |
3 |
L1020f |
||||||||
|
|
1 = Very important |
|
|
|
|
||||||||
|
|
2 = Somewhat important |
|
|
|
|
||||||||
|
|
3 = Somewhat unimportant |
|
|
|
|
||||||||
|
|
4 = Not important |
|
|
|
|
||||||||
|
|
-7 = Refused |
|
|
|
|
||||||||
|
|
-8 = Don’t know |
|
|
|
|
||||||||
L1020 |
L1020_C |
How important is reliable local public transportation (e.g., bus, rail or ferry) that can be reached without driving? |
Num |
3 |
3 |
L1020f |
||||||||
|
|
1 = Very important |
|
|
|
|
||||||||
|
|
2 = Somewhat important |
|
|
|
|
||||||||
|
|
3 = Somewhat unimportant |
|
|
|
|
||||||||
|
|
4 = Not important |
|
|
|
|
||||||||
|
|
-7 = Refused |
|
|
|
|
||||||||
|
|
-8 = Don’t know |
|
|
|
|
||||||||
L1020 |
L1020_D |
How important is reliable long-distance public transportation (e.g., intercity bus or train) to and from major metropolitan areas? |
Num |
3 |
3 |
L1020f |
||||||||
|
|
1 = Very important |
|
|
|
|
||||||||
|
|
2 = Somewhat important |
|
|
|
|
||||||||
|
|
3 = Somewhat unimportant |
|
|
|
|
||||||||
|
|
4 = Not important |
|
|
|
|
||||||||
|
|
-7 = Refused |
|
|
|
|
||||||||
Question Code |
Variable Name |
Variable label and description |
Type |
Length - MSA Data Set |
Length - National Data Set |
Format |
||||||||
|
|
-8 = Don’t know |
|
|
|
|
||||||||
L1020 |
L1020_E |
How important are major roads or highways that access and serve your community? |
Num |
3 |
3 |
L1020f |
||||||||
|
|
1 = Very important |
|
|
|
|
||||||||
|
|
2 = Somewhat important |
|
|
|
|
||||||||
|
|
3 = Somewhat unimportant |
|
|
|
|
||||||||
|
|
4 = Not important |
|
|
|
|
||||||||
|
|
-7 = Refused |
|
|
|
|
||||||||
|
|
-8 = Don’t know |
|
|
|
|
||||||||
L1020 |
L1020_F |
How important is easy access to an airport? |
Num |
3 |
3 |
L1020f |
||||||||
|
|
1 = Very important |
|
|
|
|
||||||||
|
|
2 = Somewhat important |
|
|
|
|
||||||||
|
|
3 = Somewhat unimportant |
|
|
|
|
||||||||
|
|
4 = Not important |
|
|
|
|
||||||||
|
|
-7 = Refused |
|
|
|
|
||||||||
|
|
-8 = Don’t know |
|
|
|
|
||||||||
L1020 |
L1020_G |
How important are pedestrian-friendly streets or boulevards in the downtown or central business district? |
Num |
3 |
3 |
L1020f |
||||||||
|
|
1 = Very important |
|
|
|
|
||||||||
|
|
2 = Somewhat important |
|
|
|
|
||||||||
|
|
3 = Somewhat unimportant |
|
|
|
|
||||||||
|
|
4 = Not important |
|
|
|
|
||||||||
|
|
-7 = Refused |
|
|
|
|
||||||||
|
|
-8 = Don’t know |
|
|
|
|
||||||||
L1020 |
L1020_H |
How important is adequate parking in the downtown or central business district? |
Num |
3 |
3 |
L1020f |
||||||||
|
|
1 = Very important |
|
|
|
|
||||||||
|
|
2 = Somewhat important |
|
|
|
|
||||||||
|
|
3 = Somewhat unimportant |
|
|
|
|
||||||||
|
|
4 = Not important |
|
|
|
|
||||||||
|
|
-7 = Refused |
|
|
|
|
||||||||
|
|
-8 = Don’t know |
|
|
|
|
||||||||
L1040 |
L1040_A |
Drivers of motor vehicles should be allowed to talk on a hand-held cell phone while driving... |
Num |
3 |
3 |
L1040f |
||||||||
Question Code |
Variable Name |
Variable label and description |
Type |
Length - MSA Data Set |
Length - National Data Set |
Format |
||||||||
|
|
1 = Strongly agree |
|
|
|
|
||||||||
|
|
2 = Somewhat agree |
|
|
|
|
||||||||
|
|
3 = Somewhat disagree |
|
|
|
|
||||||||
|
|
4 = Strongly disagree |
|
|
|
|
||||||||
|
|
-7 = Refused |
|
|
|
|
||||||||
|
|
-8 = Don’t know |
|
|
|
|
||||||||
L1040 |
L1040_B |
Drivers of motor vehicles should be allowed to talk on a cell phone using a hands-free device while driving… |
Num |
3 |
3 |
L1040f |
||||||||
|
|
1 = Strongly agree |
|
|
|
|
||||||||
|
|
2 = Somewhat agree |
|
|
|
|
||||||||
|
|
3 = Somewhat disagree |
|
|
|
|
||||||||
|
|
4 = Strongly disagree |
|
|
|
|
||||||||
|
|
-7 = Refused |
|
|
|
|
||||||||
|
|
-8 = Don’t know |
|
|
|
|
||||||||
L1040 |
L1040_C |
Drivers of motor vehicles should be allowed to text message on a cell phone, blackberry or similar device while driving… |
Num |
3 |
3 |
L1040f |
||||||||
|
|
1 = Strongly agree |
|
|
|
|
||||||||
|
|
2 = Somewhat agree |
|
|
|
|
||||||||
|
|
3 = Somewhat disagree |
|
|
|
|
||||||||
|
|
4 = Strongly disagree |
|
|
|
|
||||||||
|
|
-7 = Refused |
|
|
|
|
||||||||
|
|
-8 = Don’t know |
|
|
|
|
||||||||
L1040 |
L1040_D |
Drivers of motor vehicles should be allowed to eat while driving... |
Num |
3 |
3 |
L1040f |
||||||||
|
|
1 = Strongly agree |
|
|
|
|
||||||||
|
|
2 = Somewhat agree |
|
|
|
|
||||||||
|
|
3 = Somewhat disagree |
|
|
|
|
||||||||
|
|
4 = Strongly disagree |
|
|
|
|
||||||||
|
|
-7 = Refused |
|
|
|
|
||||||||
|
|
-8 = Don’t know |
|
|
|
|
||||||||
L1040 |
L1040_E |
Controls on new cars should be mounted on the steering wheel so that drivers do not have to reach across to operate the radio or other audio player… |
Num |
3 |
3 |
L1040f |
||||||||
|
|
1 = Strongly agree |
|
|
|
|
||||||||
|
|
2 = Somewhat agree |
|
|
|
|
||||||||
Question Code |
Variable Name |
Variable label and description |
Type |
Length - MSA Data Set |
Length - National Data Set |
Format |
||||||||
|
|
3 = Somewhat disagree |
|
|
|
|
||||||||
|
|
4 = Strongly disagree |
|
|
|
|
||||||||
|
|
-7 = Refused |
|
|
|
|
||||||||
|
|
-8 = Don’t know |
|
|
|
|
||||||||
L1040 |
L1040_F |
Video monitors in cars should be allowed to be mounted in a way that they are visible to drivers of OTHER cars… |
Num |
3 |
3 |
L1040f |
||||||||
|
|
1 = Strongly agree |
|
|
|
|
||||||||
|
|
2 = Somewhat agree |
|
|
|
|
||||||||
|
|
3 = Somewhat disagree |
|
|
|
|
||||||||
|
|
4 = Strongly disagree |
|
|
|
|
||||||||
|
|
-7 = Refused |
|
|
|
|
||||||||
|
|
-8 = Don’t know |
|
|
|
|
||||||||
J1010 |
J1010 |
Last week did you work for pay outside your home? |
Num |
3 |
3 |
yesornof |
||||||||
|
|
1 = Yes |
|
|
|
|
||||||||
|
|
2 = No |
|
|
|
|
||||||||
|
|
-7 = Refused |
|
|
|
|
||||||||
|
|
-8 = Don’t know |
|
|
|
|
||||||||
J1020 |
J1020 |
Last week did you perform any volunteer work outside your home? |
Num |
3 |
3 |
yesornof |
||||||||
|
|
1 = Yes |
|
|
|
|
||||||||
|
|
2 = No |
|
|
|
|
||||||||
|
|
-7 = Refused |
|
|
|
|
||||||||
|
|
-8 = Don’t know |
|
|
|
|
||||||||
|
|
-9 = Appropriate Skip |
|
|
|
|
||||||||
J1030 |
J1030 |
Last week on how many days did you travel from home to work |
Num |
3 |
3 |
fornumf |
||||||||
|
|
0 = MIN VALUE |
|
|
|
|
||||||||
|
|
7 = MAX VALUE |
|
|
|
|
||||||||
|
|
-7 = Refused |
|
|
|
|
||||||||
|
|
-8 = Don’t know |
|
|
|
|
||||||||
|
|
-9 = Appropriate Skip |
|
|
|
|
||||||||
J1035 |
J1035 |
Last week on how many days did you travel from home to your volunteer work place |
Num |
3 |
3 |
fornumf |
||||||||
|
|
0 = MIN VALUE |
|
|
|
|
||||||||
Question Code |
Variable Name |
Variable label and description |
Type |
Length - MSA Data Set |
Length - National Data Set |
Format |
||||||||
|
|
6 = MAX VALUE (MSA) ; 7 = MAX VALUE (National) |
|
|
|
|
||||||||
|
|
-7 = Refused |
|
|
|
|
||||||||
|
|
-8 = Don’t know |
|
|
|
|
||||||||
|
|
-9 = Appropriate Skip |
|
|
|
|
||||||||
J1040 |
J1040_A |
While travelling from home to work: Drive alone in a company vehicle |
Num |
3 |
3 |
yesornof |
||||||||
|
|
1 = Yes |
|
|
|
|
||||||||
|
|
2 = No |
|
|
|
|
||||||||
|
|
-7 = Refused |
|
|
|
|
||||||||
|
|
-8 = Don’t know |
|
|
|
|
||||||||
|
|
-9 = Appropriate Skip |
|
|
|
|
||||||||
J1040 |
J1040_B |
While travelling from home to work: Drive with others in a company vehicle |
Num |
3 |
3 |
yesornof |
||||||||
|
|
1 = Yes |
|
|
|
|
||||||||
|
|
2 = No |
|
|
|
|
||||||||
|
|
-7 = Refused |
|
|
|
|
||||||||
|
|
-8 = Don’t know |
|
|
|
|
||||||||
|
|
-9 = Appropriate Skip |
|
|
|
|
||||||||
J1040 |
J1040_C |
While travelling from home to work: Drive alone in a non-company vehicle |
Num |
3 |
3 |
yesornof |
||||||||
|
|
1 = Yes |
|
|
|
|
||||||||
|
|
2 = No |
|
|
|
|
||||||||
|
|
-7 = Refused |
|
|
|
|
||||||||
|
|
-8 = Don’t know |
|
|
|
|
||||||||
|
|
-9 = Appropriate Skip |
|
|
|
|
||||||||
J1040 |
J1040_D |
While travelling from home to work: Drive with others in a non-company vehicle |
Num |
3 |
3 |
yesornof |
||||||||
|
|
1 = Yes |
|
|
|
|
||||||||
|
|
2 = No |
|
|
|
|
||||||||
|
|
-7 = Refused |
|
|
|
|
||||||||
|
|
-8 = Don’t know |
|
|
|
|
||||||||
|
|
-9 = Appropriate Skip |
|
|
|
|
||||||||
J1040 |
J1040_E |
While travelling from home to work: Drive or ride in a carpool or vanpool |
Num |
3 |
3 |
yesornof |
||||||||
|
|
1 = Yes |
|
|
|
|
||||||||
|
|
2 = No |
|
|
|
|
||||||||
|
|
-7 = Refused |
|
|
|
|
||||||||
Question Code |
Variable Name |
Variable label and description |
Type |
Length - MSA Data Set |
Length - National Data Set |
Format |
||||||||
|
|
-8 = Don’t know |
|
|
|
|
||||||||
|
|
-9 = Appropriate Skip |
|
|
|
|
||||||||
J1040 |
J1040_F |
While travelling from home to work: Ride a bus |
Num |
3 |
3 |
yesornof |
||||||||
|
|
1 = Yes |
|
|
|
|
||||||||
|
|
2 = No |
|
|
|
|
||||||||
|
|
-7 = Refused |
|
|
|
|
||||||||
|
|
-8 = Don’t know |
|
|
|
|
||||||||
|
|
-9 = Appropriate Skip |
|
|
|
|
||||||||
J1040 |
J1040_G |
While travelling from home to work: Ride a subway |
Num |
3 |
3 |
yesornof |
||||||||
|
|
1 = Yes |
|
|
|
|
||||||||
|
|
2 = No |
|
|
|
|
||||||||
|
|
-7 = Refused |
|
|
|
|
||||||||
|
|
-8 = Don’t know |
|
|
|
|
||||||||
|
|
-9 = Appropriate Skip |
|
|
|
|
||||||||
J1040 |
J1040_H |
While travelling from home to work: Ride a train |
Num |
3 |
3 |
yesornof |
||||||||
|
|
1 = Yes |
|
|
|
|
||||||||
|
|
2 = No |
|
|
|
|
||||||||
|
|
-7 = Refused |
|
|
|
|
||||||||
|
|
-8 = Don’t know |
|
|
|
|
||||||||
|
|
-9 = Appropriate Skip |
|
|
|
|
||||||||
J1040 |
J1040_I |
While travelling from home to work: Ride a ferry |
Num |
3 |
3 |
yesornof |
||||||||
|
|
1 = Yes |
|
|
|
|
||||||||
|
|
2 = No |
|
|
|
|
||||||||
|
|
-7 = Refused |
|
|
|
|
||||||||
|
|
-8 = Don’t know |
|
|
|
|
||||||||
|
|
-9 = Appropriate Skip |
|
|
|
|
||||||||
J1040 |
J1040_J |
While travelling from home to work: Ride a bicycle |
Num |
3 |
3 |
yesornof |
||||||||
|
|
1 = Yes |
|
|
|
|
||||||||
|
|
2 = No |
|
|
|
|
||||||||
|
|
-7 = Refused |
|
|
|
|
||||||||
|
|
-8 = Don’t know |
|
|
|
|
||||||||
|
|
-9 = Appropriate Skip |
|
|
|
|
||||||||
Question Code |
Variable Name |
Variable label and description |
Type |
Length - MSA Data Set |
Length - National Data Set |
Format |
||||||||
J1040 |
J1040_K |
While travelling from home to work: Walk |
Num |
3 |
3 |
yesornof |
||||||||
|
|
1 = Yes |
|
|
|
|
||||||||
|
|
2 = No |
|
|
|
|
||||||||
|
|
-7 = Refused |
|
|
|
|
||||||||
|
|
-8 = Don’t know |
|
|
|
|
||||||||
|
|
-9 = Appropriate Skip |
|
|
|
|
||||||||
J1040 |
J1040_L |
While travelling from home to work: Used some other mode SPECIFY |
Num |
3 |
3 |
yesornof |
||||||||
|
|
1 = Yes |
|
|
|
|
||||||||
|
|
2 = No |
|
|
|
|
||||||||
|
|
-7 = Refused |
|
|
|
|
||||||||
|
|
-8 = Don’t know |
|
|
|
|
||||||||
|
|
-9 = Appropriate Skip |
|
|
|
|
||||||||
J1045 |
J1045_A |
While traveling from home to volunteer work place: Drive alone in a company vehicle |
Num |
3 |
3 |
yesornof |
||||||||
|
|
1 = Yes |
|
|
|
|
||||||||
|
|
2 = No |
|
|
|
|
||||||||
|
|
-7 = Refused |
|
|
|
|
||||||||
|
|
-8 = Don’t know |
|
|
|
|
||||||||
|
|
-9 = Appropriate Skip |
|
|
|
|
||||||||
J1045 |
J1045_B |
While traveling from home to volunteer work place: Drive with others in a company vehicle |
Num |
3 |
3 |
yesornof |
||||||||
|
|
1 = Yes |
|
|
|
|
||||||||
|
|
2 = No |
|
|
|
|
||||||||
|
|
-7 = Refused |
|
|
|
|
||||||||
|
|
-8 = Don’t know |
|
|
|
|
||||||||
|
|
-9 = Appropriate Skip |
|
|
|
|
||||||||
J1045 |
J1045_C |
While traveling from home to volunteer work place: Drive alone in a non-company vehicle |
Num |
3 |
3 |
yesornof |
||||||||
|
|
1 = Yes |
|
|
|
|
||||||||
|
|
2 = No |
|
|
|
|
||||||||
|
|
-7 = Refused |
|
|
|
|
||||||||
|
|
-8 = Don’t know |
|
|
|
|
||||||||
|
|
-9 = Appropriate Skip |
|
|
|
|
||||||||
Question Code |
Variable Name |
Variable label and description |
Type |
Length - MSA Data Set |
Length - National Data Set |
Format |
||||||||
J1045 |
J1045_D |
While traveling from home to volunteer work place: Drive with others in a non-company vehicle |
Num |
3 |
3 |
yesornof |
||||||||
|
|
1 = Yes |
|
|
|
|
||||||||
|
|
2 = No |
|
|
|
|
||||||||
|
|
-7 = Refused |
|
|
|
|
||||||||
|
|
-8 = Don’t know |
|
|
|
|
||||||||
|
|
-9 = Appropriate Skip |
|
|
|
|
||||||||
J1045 |
J1045_E |
While traveling from home to volunteer work place: Drive or rode in a carpool or vanpool |
Num |
3 |
3 |
yesornof |
||||||||
|
|
1 = Yes |
|
|
|
|
||||||||
|
|
2 = No |
|
|
|
|
||||||||
|
|
-7 = Refused |
|
|
|
|
||||||||
|
|
-8 = Don’t know |
|
|
|
|
||||||||
|
|
-9 = Appropriate Skip |
|
|
|
|
||||||||
J1045 |
J1045_F |
While traveling from home to volunteer work place: Ride a bus |
Num |
3 |
3 |
yesornof |
||||||||
|
|
1 = Yes |
|
|
|
|
||||||||
|
|
2 = No |
|
|
|
|
||||||||
|
|
-7 = Refused |
|
|
|
|
||||||||
|
|
-8 = Don’t know |
|
|
|
|
||||||||
|
|
-9 = Appropriate Skip |
|
|
|
|
||||||||
J1045 |
J1045_G |
While traveling from home to volunteer work place: Ride the subway |
Num |
3 |
3 |
yesornof |
||||||||
|
|
1 = Yes |
|
|
|
|
||||||||
|
|
2 = No |
|
|
|
|
||||||||
|
|
-7 = Refused |
|
|
|
|
||||||||
|
|
-8 = Don’t know |
|
|
|
|
||||||||
|
|
-9 = Appropriate Skip |
|
|
|
|
||||||||
J1045 |
J1045_H |
While traveling from home to volunteer work place: Ride a train |
Num |
3 |
3 |
yesornof |
||||||||
|
|
1 = Yes |
|
|
|
|
||||||||
|
|
2 = No |
|
|
|
|
||||||||
|
|
-7 = Refused |
|
|
|
|
||||||||
|
|
-8 = Don’t know |
|
|
|
|
||||||||
|
|
-9 = Appropriate Skip |
|
|
|
|
||||||||
Question Code |
Variable Name |
Variable label and description |
Type |
Length - MSA Data Set |
Length - National Data Set |
Format |
||||||||
J1045 |
J1045_I |
While traveling from home to volunteer work place: Ride a ferry |
Num |
3 |
3 |
yesornof |
||||||||
|
|
1 = Yes |
|
|
|
|
||||||||
|
|
2 = No |
|
|
|
|
||||||||
|
|
-7 = Refused |
|
|
|
|
||||||||
|
|
-8 = Don’t know |
|
|
|
|
||||||||
|
|
-9 = Appropriate Skip |
|
|
|
|
||||||||
J1045 |
J1045_J |
While traveling from home to volunteer work place: Ride a bicycle |
Num |
3 |
3 |
yesornof |
||||||||
|
|
1 = Yes |
|
|
|
|
||||||||
|
|
2 = No |
|
|
|
|
||||||||
|
|
-7 = Refused |
|
|
|
|
||||||||
|
|
-8 = Don’t know |
|
|
|
|
||||||||
|
|
-9 = Appropriate Skip |
|
|
|
|
||||||||
J1045 |
J1045_K |
While traveling from home to volunteer work place: Walk |
Num |
3 |
3 |
yesornof |
||||||||
|
|
1 = Yes |
|
|
|
|
||||||||
|
|
2 = No |
|
|
|
|
||||||||
|
|
-7 = Refused |
|
|
|
|
||||||||
|
|
-8 = Don’t know |
|
|
|
|
||||||||
|
|
-9 = Appropriate Skip |
|
|
|
|
||||||||
J1045 |
J1045_L |
While traveling from home to volunteer work place: Used some other mode SPECIFY |
Num |
3 |
3 |
yesornof |
||||||||
|
|
1 = Yes |
|
|
|
|
||||||||
|
|
2 = No |
|
|
|
|
||||||||
|
|
-7 = Refused |
|
|
|
|
||||||||
|
|
-8 = Don’t know |
|
|
|
|
||||||||
|
|
-9 = Appropriate Skip |
|
|
|
|
||||||||
J1050 |
J1050 |
Last week how would you rate the level of traffic congestion on your commute to work? |
Num |
3 |
3 |
J1050f |
||||||||
|
|
1 = Very Congested |
|
|
|
|
||||||||
|
|
2 = Moderately congested |
|
|
|
|
||||||||
|
|
3 = Slightly congested |
|
|
|
|
||||||||
|
|
4 = Not at all congested |
|
|
|
|
||||||||
|
|
-7 = Refused |
|
|
|
|
||||||||
|
|
-8 = Don’t know |
|
|
|
|
||||||||
Question Code |
Variable Name |
Variable label and description |
Type |
Length - MSA Data Set |
Length - National Data Set |
Format |
||||||||
|
|
-9 = Appropriate Skip |
|
|
|
|
||||||||
J1060 |
J1060_A |
Have you changed your schedule or work hours to improve your commute? |
Num |
3 |
3 |
yesornof |
||||||||
|
|
1 = Yes |
|
|
|
|
||||||||
|
|
2 = No |
|
|
|
|
||||||||
|
|
-7 = Refused |
|
|
|
|
||||||||
|
|
-8 = Don’t know |
|
|
|
|
||||||||
|
|
-9 = Appropriate Skip |
|
|
|
|
||||||||
J1060 |
J1060_B |
Have you moved to a home closer to work to improve your commute? |
Num |
3 |
3 |
yesornof |
||||||||
|
|
1 = Yes |
|
|
|
|
||||||||
|
|
2 = No |
|
|
|
|
||||||||
|
|
-7 = Refused |
|
|
|
|
||||||||
|
|
-8 = Don’t know |
|
|
|
|
||||||||
|
|
-9 = Appropriate Skip |
|
|
|
|
||||||||
J1060 |
J1060_C |
Have you moved to a home closer to public transportation to improve your commute |
Num |
3 |
3 |
yesornof |
||||||||
|
|
1 = Yes |
|
|
|
|
||||||||
|
|
2 = No |
|
|
|
|
||||||||
|
|
-7 = Refused |
|
|
|
|
||||||||
|
|
-8 = Don’t know |
|
|
|
|
||||||||
|
|
-9 = Appropriate Skip |
|
|
|
|
||||||||
J1060 |
J1060_D |
Have you changed jobs or left a job to improve your commute |
Num |
3 |
3 |
yesornof |
||||||||
|
|
1 = Yes |
|
|
|
|
||||||||
|
|
2 = No |
|
|
|
|
||||||||
|
|
-7 = Refused |
|
|
|
|
||||||||
|
|
-8 = Don’t know |
|
|
|
|
||||||||
|
|
-9 = Appropriate Skip |
|
|
|
|
||||||||
J1060 |
J1060_E |
Have you changed office locations to improve your commute |
Num |
3 |
3 |
yesornof |
||||||||
|
|
1 = Yes |
|
|
|
|
||||||||
|
|
2 = No |
|
|
|
|
||||||||
|
|
-7 = Refused |
|
|
|
|
||||||||
|
|
-8 = Don’t know |
|
|
|
|
||||||||
|
|
-9 = Appropriate Skip |
|
|
|
|
||||||||
J1060 |
J1060_F |
Have you worked at home instead of your usual work site to improve your commute |
Num |
3 |
3 |
yesornof |
||||||||
Question Code |
Variable Name |
Variable label and description |
Type |
Length - MSA Data Set |
Length - National Data Set |
Format |
||||||||
|
|
1 = Yes |
|
|
|
|
||||||||
|
|
2 = No |
|
|
|
|
||||||||
|
|
-7 = Refused |
|
|
|
|
||||||||
|
|
-8 = Don’t know |
|
|
|
|
||||||||
|
|
-9 = Appropriate Skip |
|
|
|
|
||||||||
J1060 |
J1060_G |
Have you paid to use a toll road or toll lane to improve your commute |
Num |
3 |
3 |
yesornof |
||||||||
|
|
1 = Yes |
|
|
|
|
||||||||
|
|
2 = No |
|
|
|
|
||||||||
|
|
-7 = Refused |
|
|
|
|
||||||||
|
|
-8 = Don’t know |
|
|
|
|
||||||||
|
|
-9 = Appropriate Skip |
|
|
|
|
||||||||
J1060 |
J1060_H |
Have you made any other change to improve your commute: SPECIFY |
Num |
3 |
3 |
yesornof |
||||||||
|
|
1 = Yes |
|
|
|
|
||||||||
|
|
2 = No |
|
|
|
|
||||||||
|
|
-7 = Refused |
|
|
|
|
||||||||
|
|
-8 = Don’t know |
|
|
|
|
||||||||
|
|
-9 = Appropriate Skip |
|
|
|
|
||||||||
J1065 |
J1065 |
How often would you say that you made additional stops for some other purpose during your trip to or from work? |
Num |
3 |
3 |
J1065f |
||||||||
|
|
1 = At least half of all commute trips |
|
|
|
|
||||||||
|
|
2 = Some but fewer than half of all commute trips |
|
|
|
|
||||||||
|
|
3 = No additional trips or almost none |
|
|
|
|
||||||||
|
|
-7 = Refused |
|
|
|
|
||||||||
|
|
-8 = Don’t know |
|
|
|
|
||||||||
|
|
-9 = Appropriate Skip |
|
|
|
|
||||||||
J1070 |
J1070 |
Thinking about the last 12 months would you say the traffic congestion on your commute to work has gotten |
Num |
3 |
3 |
J1070f |
||||||||
|
|
1 = Much better |
|
|
|
|
||||||||
|
|
2 = Somewhat better |
|
|
|
|
||||||||
|
|
3 = Stayed about the same |
|
|
|
|
||||||||
|
|
4 = Somewhat worse |
|
|
|
|
||||||||
|
|
5 = Much worse |
|
|
|
|
||||||||
Question Code |
Variable Name |
Variable label and description |
Type |
Length - MSA Data Set |
Length - National Data Set |
Format |
||||||||
|
|
-7 = Refused |
|
|
|
|
||||||||
|
|
-8 = Don’t know |
|
|
|
|
||||||||
|
|
-9 = Appropriate Skip |
|
|
|
|
||||||||
J1080 |
J1080 |
Is at least part of the work that you do in your main job something you could do at home |
Num |
3 |
3 |
yesornof |
||||||||
|
|
1 = Yes |
|
|
|
|
||||||||
|
|
2 = No |
|
|
|
|
||||||||
|
|
-7 = Refused |
|
|
|
|
||||||||
|
|
-8 = Don’t know |
|
|
|
|
||||||||
|
|
-9 = Appropriate Skip |
|
|
|
|
||||||||
J1090 |
J1090 |
Does your main employer allow workers to sometimes work at home instead of coming into the work place |
Num |
3 |
3 |
yesornof |
||||||||
|
|
1 = Yes |
|
|
|
|
||||||||
|
|
2 = No |
|
|
|
|
||||||||
|
|
-7 = Refused |
|
|
|
|
||||||||
|
|
-8 = Don’t know |
|
|
|
|
||||||||
|
|
-9 = Appropriate Skip |
|
|
|
|
||||||||
J1100 |
J1100 |
Last week did you work at home instead of traveling to your usual workplace of your main job |
Num |
3 |
3 |
yesornof |
||||||||
|
|
1 = Yes |
|
|
|
|
||||||||
|
|
2 = No |
|
|
|
|
||||||||
|
|
-7 = Refused |
|
|
|
|
||||||||
|
|
-8 = Don’t know |
|
|
|
|
||||||||
|
|
-9 = Appropriate Skip |
|
|
|
|
||||||||
J1110 |
J1110_A |
Last week on how many days did you work at home instead of going to your usual workplace of your main job |
Num |
3 |
3 |
fornumf |
||||||||
|
|
0 = MIN VALUE |
|
|
|
|
||||||||
|
|
7= MAX VALUE |
|
|
|
|
||||||||
|
|
-7 = Refused |
|
|
|
|
||||||||
|
|
-8 = Don’t know |
|
|
|
|
||||||||
|
|
-9 = Appropriate Skip |
|
|
|
|
||||||||
J1120 |
J1120_A |
What is your primary reason for working at home instead of traveling to your usual work place of your main job |
Num |
3 |
3 |
J1120f |
||||||||
Question Code |
Variable Name |
Variable label and description |
Type |
Length - MSA Data Set |
Length - National Data Set |
Format |
||||||||
|
|
1 = Convenience |
|
|
|
|
||||||||
|
|
2 = Saves the company money |
|
|
|
|
||||||||
|
|
3 = Saves me money |
|
|
|
|
||||||||
|
|
4 = Saves me time |
|
|
|
|
||||||||
|
|
5 = To avoid congestion |
|
|
|
|
||||||||
|
|
6 = Allows me to take care of family members to be home when kids come home |
|
|
|
|
||||||||
|
|
7 = I don't live in the same area as the company I work for |
|
|
|
|
||||||||
|
|
8 = I work for multiple businesses |
|
|
|
|
||||||||
|
|
9 = I get more work done at home |
|
|
|
|
||||||||
|
|
10 = For health reasons/disability reasons |
|
|
|
|
||||||||
|
|
11 = Lack of transportation |
|
|
|
|
||||||||
|
|
12 = Other specify |
|
|
|
|
||||||||
|
|
-7 = Refused |
|
|
|
|
||||||||
|
|
-8 = Don’t know |
|
|
|
|
||||||||
|
|
-9 = Appropriate Skip |
|
|
|
|
||||||||
T1010 |
T1010 |
During the last 12 months have you flown on a commercial airline |
Num |
3 |
3 |
yesornof |
||||||||
|
|
1 = Yes |
|
|
|
|
||||||||
|
|
2 = No |
|
|
|
|
||||||||
|
|
-7 = Refused |
|
|
|
|
||||||||
|
|
-8 = Don’t know |
|
|
|
|
||||||||
T1020 |
T1020 |
During September 2009 did you fly on a commercial airline |
Num |
3 |
3 |
yesornof |
||||||||
|
|
1 = Yes |
|
|
|
|
||||||||
|
|
2 = No |
|
|
|
|
||||||||
|
|
-7 = Refused |
|
|
|
|
||||||||
|
|
-8 = Don’t know |
|
|
|
|
||||||||
|
|
-9 = Appropriate Skip |
|
|
|
|
||||||||
T1030 |
T1030 |
How many days in September 2009 did you fly on a commercial airline |
Num |
3 |
3 |
fornumf |
||||||||
|
|
0 = MIN VALUE |
|
|
|
|
||||||||
|
|
20 = MAX VALUE (MSA); 15 = MAX VALUE (National) |
|
|
|
|
||||||||
|
|
-7 = Refused |
|
|
|
|
||||||||
|
|
-8 = Don’t know |
|
|
|
|
||||||||
|
|
-9 = Appropriate Skip |
|
|
|
|
||||||||
Question Code |
Variable Name |
Variable label and description |
Type |
Length - MSA Data Set |
Length - National Data Set |
Format |
||||||||
T1040 |
T1040 |
In what month and year was your most recent commercial airline flight that departed from a U.S. airport? |
Num |
8 |
8 |
T1040f |
||||||||
|
|
1 = Less than three month ago |
|
|
|
|
||||||||
|
|
2 = More than three month ago but less than a year ago |
|
|
|
|
||||||||
|
|
3 = One year ago |
|
|
|
|
||||||||
|
|
4 = More than one year ago |
|
|
|
|
||||||||
|
|
-7 = Refused |
|
|
|
|
||||||||
|
|
-8 = Don’t know |
|
|
|
|
||||||||
|
|
-9 = Appropriate Skip |
|
|
|
|
||||||||
T1060 |
T1060 |
Total time waiting for security screening in minutes |
Num |
8 |
8 |
fornumf |
||||||||
|
|
0 = MIN VALUE |
|
|
|
|
||||||||
|
|
300 = MAX VALUE (MSA); 120 = MAX VALUE (National) |
|
|
|
|
||||||||
|
|
-9 = Appropriate Skip |
|
|
|
|
||||||||
T1080 |
T1080 |
For your most recent flight was the amount of time you spent waiting in line to get to the passenger security screening checkpoint |
Num |
3 |
3 |
T1080f |
||||||||
|
|
1 = Much shorter than expected |
|
|
|
|
||||||||
|
|
2 = Shorter than expected |
|
|
|
|
||||||||
|
|
3 = About what you expected |
|
|
|
|
||||||||
|
|
4 = Longer than you expected |
|
|
|
|
||||||||
|
|
5 = Much longer than you expected |
|
|
|
|
||||||||
|
|
6 = You had no expectation |
|
|
|
|
||||||||
|
|
-7 = Refused |
|
|
|
|
||||||||
|
|
-8 = Don’t know |
|
|
|
|
||||||||
|
|
-9 = Appropriate Skip |
|
|
|
|
||||||||
T1070 |
T1070 |
For your most recent flight how satisfied were you overall with your experience at the passenger security screening checkpoint |
Num |
3 |
3 |
satisfyf |
||||||||
|
|
1 = Very satisfied |
|
|
|
|
||||||||
|
|
2 = Satisfied |
|
|
|
|
||||||||
|
|
3 = Dissatisfied |
|
|
|
|
||||||||
|
|
4 = Very dissatisfied |
|
|
|
|
||||||||
|
|
-7 = Refused |
|
|
|
|
||||||||
|
|
-8 = Don’t know |
|
|
|
|
||||||||
Question Code |
Variable Name |
Variable label and description |
Type |
Length - MSA Data Set |
Length - National Data Set |
Format |
||||||||
|
|
-9 = Appropriate Skip |
|
|
|
|
||||||||
T1090 |
T1090 |
For your most recent flight how satisfied were you with the time it took to screen you and your carry-on items |
Num |
3 |
3 |
satisfyf |
||||||||
|
|
1 = Very satisfied |
|
|
|
|
||||||||
|
|
2 = Satisfied |
|
|
|
|
||||||||
|
|
3 = Dissatisfied |
|
|
|
|
||||||||
|
|
4 = Very dissatisfied |
|
|
|
|
||||||||
|
|
-7 = Refused |
|
|
|
|
||||||||
|
|
-8 = Don’t know |
|
|
|
|
||||||||
|
|
-9 = Appropriate Skip |
|
|
|
|
||||||||
T1100 |
T1100 |
For your most recent flight were you selected for additional screening at the passenger security screening checkpoint |
Num |
3 |
3 |
yesornof |
||||||||
|
|
1 = Yes |
|
|
|
|
||||||||
|
|
2 = No |
|
|
|
|
||||||||
|
|
-7 = Refused |
|
|
|
|
||||||||
|
|
-8 = Don’t know |
|
|
|
|
||||||||
|
|
-9 = Appropriate Skip |
|
|
|
|
||||||||
T1102 |
T1102_A |
Why do you think you were selected for additional screening |
Num |
3 |
3 |
T1102f |
||||||||
|
|
1 = Medical Reasons |
|
|
|
|
||||||||
|
|
2 = Travel Documents |
|
|
|
|
||||||||
|
|
3 = Clothing |
|
|
|
|
||||||||
|
|
4 = Randomly Selected |
|
|
|
|
||||||||
|
|
5 = Another Reason – specify |
|
|
|
|
||||||||
|
|
-7 = Refused |
|
|
|
|
||||||||
|
|
-8 = Don’t know |
|
|
|
|
||||||||
|
|
-9 = Appropriate Skip |
|
|
|
|
||||||||
T1104 |
T1104 |
Did you make a complaint about receiving additional passenger screening at the security checkpoint? |
Num |
3 |
3 |
yesornof |
||||||||
|
|
1 = Yes |
|
|
|
|
||||||||
|
|
2 = No |
|
|
|
|
||||||||
|
|
-7 = Refused |
|
|
|
|
||||||||
|
|
-8 = Don’t know |
|
|
|
|
||||||||
|
|
-9 = Appropriate Skip |
|
|
|
|
||||||||
Question Code |
Variable Name |
Variable label and description |
Type |
Length - MSA Data Set |
Length - National Data Set |
Format |
||||||||
T1106 |
T1106 |
How satisfied are you with the resolution of your complaint? |
Num |
3 |
3 |
T1106f |
||||||||
|
|
1 = Very satisfied |
|
|
|
|
||||||||
|
|
2 = Satisfied |
|
|
|
|
||||||||
|
|
3 = Dissatisfied |
|
|
|
|
||||||||
|
|
4 = Very dissatisfied |
|
|
|
|
||||||||
|
|
5 = Doesn't apply. There was/has been no resolution. |
|
|
|
|
||||||||
|
|
-7 = Refused |
|
|
|
|
||||||||
|
|
-8 = Don’t know |
|
|
|
|
||||||||
|
|
-9 = Appropriate Skip |
|
|
|
|
||||||||
T1110 |
T1110 |
For your most recent flight would you say the passenger screening you experienced at the security checkpoint was |
Num |
3 |
3 |
T1110f |
||||||||
|
|
1 = Excessive |
|
|
|
|
||||||||
|
|
2 = Appropriate |
|
|
|
|
||||||||
|
|
3 = Inadequate |
|
|
|
|
||||||||
|
|
-7 = Refused |
|
|
|
|
||||||||
|
|
-8 = Don’t know |
|
|
|
|
||||||||
|
|
-9 = Appropriate Skip |
|
|
|
|
||||||||
T1120 |
T1120 |
How satisfied were you with the courtesy of the Transportation Security Officers at the passenger security screening checkpoint |
Num |
3 |
3 |
satisfyf |
||||||||
|
|
1 = Very satisfied |
|
|
|
|
||||||||
|
|
2 = Satisfied |
|
|
|
|
||||||||
|
|
3 = Dissatisfied |
|
|
|
|
||||||||
|
|
4 = Very dissatisfied |
|
|
|
|
||||||||
|
|
-7 = Refused |
|
|
|
|
||||||||
|
|
-8 = Don’t know |
|
|
|
|
||||||||
|
|
-9 = Appropriate Skip |
|
|
|
|
||||||||
T1170 |
T1170 |
What is your level of confidence in the ability of the Transportation Security Officers to keep air travel secure |
Num |
3 |
3 |
confidef |
||||||||
|
|
1 = No confidence |
|
|
|
|
||||||||
|
|
2 = A small amount of confidence |
|
|
|
|
||||||||
|
|
3 = A moderate amount of confidence |
|
|
|
|
||||||||
|
|
4 = A great deal of confidence |
|
|
|
|
||||||||
|
|
5 = Total confidence |
|
|
|
|
||||||||
Question Code |
Variable Name |
Variable label and description |
Type |
Length - MSA Data Set |
Length - National Data Set |
Format |
||||||||
|
|
-7 = Refused |
|
|
|
|
||||||||
|
|
-8 = Don’t know |
|
|
|
|
||||||||
|
|
-9 = Appropriate Skip |
|
|
|
|
||||||||
T1124 |
T1124 |
What is your level of confidence in the ability of the equipment used to screen passengers and carry-on bags to keep air travel secure? |
Num |
3 |
3 |
confidef |
||||||||
|
|
1 = No confidence |
|
|
|
|
||||||||
|
|
2 = A small amount of confidence |
|
|
|
|
||||||||
|
|
3 = A moderate amount of confidence |
|
|
|
|
||||||||
|
|
4 = A great deal of confidence |
|
|
|
|
||||||||
|
|
5 = Total confidence |
|
|
|
|
||||||||
|
|
-7 = Refused |
|
|
|
|
||||||||
|
|
-8 = Don’t know |
|
|
|
|
||||||||
|
|
-9 = Appropriate Skip |
|
|
|
|
||||||||
T1128 |
T1128 |
What is your level of confidence in the ability of the equipment used to screen checked bags. |
Num |
3 |
3 |
confidef |
||||||||
|
|
1 = No confidence |
|
|
|
|
||||||||
|
|
2 = A small amount of confidence |
|
|
|
|
||||||||
|
|
3 = A moderate amount of confidence |
|
|
|
|
||||||||
|
|
4 = A great deal of confidence |
|
|
|
|
||||||||
|
|
5 = Total confidence |
|
|
|
|
||||||||
|
|
-7 = Refused |
|
|
|
|
||||||||
|
|
-8 = Don’t know |
|
|
|
|
||||||||
|
|
-9 = Appropriate Skip |
|
|
|
|
||||||||
T1130 |
T1130 |
How informed do you feel you are about passenger security screening procedures |
Num |
3 |
3 |
T1130f |
||||||||
|
|
1 = Very well informed |
|
|
|
|
||||||||
|
|
2 = Moderately well informed |
|
|
|
|
||||||||
|
|
3 = Slightly informed |
|
|
|
|
||||||||
|
|
4 = Not at all informed |
|
|
|
|
||||||||
|
|
-7 = Refused |
|
|
|
|
||||||||
|
|
-8 = Don’t know |
|
|
|
|
||||||||
|
|
-9 = Appropriate Skip |
|
|
|
|
||||||||
Question Code |
Variable Name |
Variable label and description |
Type |
Length - MSA Data Set |
Length - National Data Set |
Format |
||||||||
T1140 |
T1140_A |
Where have you received information about the airport passenger security screening process: TSA website/blog |
Num |
3 |
3 |
yesornof |
||||||||
|
|
1 = Yes |
|
|
|
|
||||||||
|
|
2 = No |
|
|
|
|
||||||||
|
|
-7 = Refused |
|
|
|
|
||||||||
|
|
-8 = Don’t know |
|
|
|
|
||||||||
|
|
-9 = Appropriate Skip |
|
|
|
|
||||||||
T1140 |
T1140_B |
Where have you received information about the airport passenger security screening process: My own travel experience |
Num |
3 |
3 |
yesornof |
||||||||
|
|
1 = Yes |
|
|
|
|
||||||||
|
|
2 = No |
|
|
|
|
||||||||
|
|
-7 = Refused |
|
|
|
|
||||||||
|
|
-8 = Don’t know |
|
|
|
|
||||||||
|
|
-9 = Appropriate Skip |
|
|
|
|
||||||||
T1140 |
T1140_C |
Where have you received information about the airport passenger security screening process: Airline or travel agent website |
Num |
3 |
3 |
yesornof |
||||||||
|
|
1 = Yes |
|
|
|
|
||||||||
|
|
2 = No |
|
|
|
|
||||||||
|
|
-7 = Refused |
|
|
|
|
||||||||
|
|
-8 = Don’t know |
|
|
|
|
||||||||
|
|
-9 = Appropriate Skip |
|
|
|
|
||||||||
T1140 |
T1140_D |
Where have you received information about the airport passenger security screening process: Placed a call or email to the airline |
Num |
3 |
3 |
yesornof |
||||||||
|
|
1 = Yes |
|
|
|
|
||||||||
|
|
2 = No |
|
|
|
|
||||||||
|
|
-7 = Refused |
|
|
|
|
||||||||
|
|
-8 = Don’t know |
|
|
|
|
||||||||
|
|
-9 = Appropriate Skip |
|
|
|
|
||||||||
T1140 |
T1140_E |
Where have you received information about the airport passenger security screening process: Placed a call or email to a travel agent |
Num |
3 |
3 |
yesornof |
||||||||
|
|
1 = Yes |
|
|
|
|
||||||||
|
|
2 = No |
|
|
|
|
||||||||
Question Code |
Variable Name |
Variable label and description |
Type |
Length - MSA Data Set |
Length - National Data Set |
Format |
||||||||
|
|
-7 = Refused |
|
|
|
|
|
|||||||
|
|
-8 = Don’t know |
|
|
|
|
|
|||||||
|
|
-9 = Appropriate Skip |
|
|
|
|
|
|||||||
T1140 |
T1140_F |
Where have you received information about the airport passenger security screening process: Printed material brochure or pamphlet |
Num |
3 |
3 |
yesornof |
|
|||||||
|
|
1 = Yes |
|
|
|
|
|
|||||||
|
|
2 = No |
|
|
|
|
|
|||||||
|
|
-7 = Refused |
|
|
|
|
|
|||||||
|
|
-8 = Don’t know |
|
|
|
|
|
|||||||
|
|
-9 = Appropriate Skip |
|
|
|
|
|
|||||||
T1140 |
T1140_G |
Where have you received information about the airport passenger security screening process: Signs displayed at airport |
Num |
3 |
3 |
yesornof |
|
|||||||
|
|
1 = Yes |
|
|
|
|
|
|||||||
|
|
2 = No |
|
|
|
|
|
|||||||
|
|
-7 = Refused |
|
|
|
|
|
|||||||
|
|
-8 = Don’t know |
|
|
|
|
|
|||||||
|
|
-9 = Appropriate Skip |
|
|
|
|
|
|||||||
T1140 |
T1140_H |
Where have you received information about the airport passenger security screening process: Radio, television, or newspaper |
Num |
3 |
3 |
yesornof |
|
|||||||
|
|
1 = Yes |
|
|
|
|
|
|||||||
|
|
2 = No |
|
|
|
|
|
|||||||
|
|
-7 = Refused |
|
|
|
|
|
|||||||
|
|
-8 = Don’t know |
|
|
|
|
|
|||||||
|
|
-9 = Appropriate Skip |
|
|
|
|
|
|||||||
T1140 |
T1140_I |
Where have you received information about the airport passenger security screening process: Friends, family, word of mouth |
Num |
3 |
3 |
yesornof |
|
|||||||
|
|
1 = Yes |
|
|
|
|
|
|||||||
|
|
2 = No |
|
|
|
|
|
|||||||
|
|
-7 = Refused |
|
|
|
|
|
|||||||
|
|
-8 = Don’t know |
|
|
|
|
|
|||||||
|
|
-9 = Appropriate Skip |
|
|
|
|
|
|||||||
T1140 |
T1140_J |
Where have you received information about the airport passenger security screening process: Some other source |
Num |
3 |
3 |
yesornof |
|
|||||||
Question Code |
Variable Name |
Variable label and description |
Type |
Length - MSA Data Set |
Length - National Data Set |
Format |
||||||||
|
|
1 = Yes |
|
|
|
|
|
|||||||
|
|
2 = No |
|
|
|
|
|
|||||||
|
|
-7 = Refused |
|
|
|
|
|
|||||||
|
|
-8 = Don’t know |
|
|
|
|
|
|||||||
|
|
-9 = Appropriate Skip |
|
|
|
|
|
|||||||
T1154 |
T1154 |
How satisfied are you with your accessibility to information about airport screening procedures? |
Num |
3 |
3 |
satisfyf |
|
|||||||
|
|
1 = Very satisfied |
|
|
|
|
|
|||||||
|
|
2 = Satisfied |
|
|
|
|
|
|||||||
|
|
3 = Dissatisfied |
|
|
|
|
|
|||||||
|
|
4 = Very dissatisfied |
|
|
|
|
|
|||||||
|
|
-7 = Refused |
|
|
|
|
|
|||||||
|
|
-8 = Don’t know |
|
|
|
|
|
|||||||
|
|
-9 = Appropriate Skip |
|
|
|
|
|
|||||||
T1156 |
T1156 |
For your most recent flight did you request an explanation of security procedures? |
Num |
3 |
3 |
yesornof |
|
|||||||
|
|
1 = Yes |
|
|
|
|
|
|||||||
|
|
2 = No |
|
|
|
|
|
|||||||
|
|
-7 = Refused |
|
|
|
|
|
|||||||
|
|
-8 = Don’t know |
|
|
|
|
|
|||||||
|
|
-9 = Appropriate Skip |
|
|
|
|
|
|||||||
T1158 |
T1158 |
How satisfied were you with the way the security procedures were explained to you? |
Num |
3 |
3 |
satisfyf |
|
|||||||
|
|
1 = Very satisfied |
|
|
|
|
|
|||||||
|
|
2 = Satisfied |
|
|
|
|
|
|||||||
|
|
3 = Dissatisfied |
|
|
|
|
|
|||||||
|
|
4 = Very dissatisfied |
|
|
|
|
|
|||||||
|
|
-7 = Refused |
|
|
|
|
|
|||||||
|
|
-8 = Don’t know |
|
|
|
|
|
|||||||
|
|
-9 = Appropriate Skip |
|
|
|
|
|
|||||||
T1160 |
T1160 |
What is your level of confidence in the ability of the flight crew to defend an aircraft and its passengers from individuals with hostile intentions? |
Num |
3 |
3 |
confidef |
|
|||||||
|
|
1 = No confidence |
|
|
|
|
|
|||||||
|
|
2 = A small amount of confidence |
|
|
|
|
|
|||||||
Question Code |
Variable Name |
Variable label and description |
Type |
Length - MSA Data Set |
Length - National Data Set |
Format |
||||||||
|
|
3 = A moderate amount of confidence |
|
|
|
|
||||||||
|
|
4 = A great deal of confidence |
|
|
|
|
||||||||
|
|
5 = Total confidence |
|
|
|
|
||||||||
|
|
-7 = Refused |
|
|
|
|
||||||||
|
|
-8 = Don’t know |
|
|
|
|
||||||||
T1165 |
T1165 |
What is your level of confidence in the ability of the Federal Air Marshals to defend an aircraft and its passengers from individuals with hostile intentions? |
Num |
3 |
3 |
confidef |
||||||||
|
|
1 = No confidence |
|
|
|
|
||||||||
|
|
2 = A small amount of confidence |
|
|
|
|
||||||||
|
|
3 = A moderate amount of confidence |
|
|
|
|
||||||||
|
|
4 = A great deal of confidence |
|
|
|
|
||||||||
|
|
5 = Total confidence |
|
|
|
|
||||||||
|
|
-7 = Refused |
|
|
|
|
||||||||
|
|
-8 = Don’t know |
|
|
|
|
||||||||
T1180 |
T1180 |
Should passengers be allowed to use their cell phones during a flight? |
Num |
3 |
3 |
T1180f |
||||||||
|
|
1 = Definitely should |
|
|
|
|
||||||||
|
|
2 = Probably should |
|
|
|
|
||||||||
|
|
3 = Not sure |
|
|
|
|
||||||||
|
|
4 = Probably should not |
|
|
|
|
||||||||
|
|
5 = Definitely should not |
|
|
|
|
||||||||
|
|
-7 = Refused |
|
|
|
|
||||||||
|
|
-8 = Don’t know |
|
|
|
|
||||||||
T1200 |
T1200 |
During September 2009 did you use a subway system or elevated train? |
Num |
3 |
3 |
yesornof |
||||||||
|
|
1 = Yes |
|
|
|
|
||||||||
|
|
2 = No |
|
|
|
|
||||||||
|
|
-7 = Refused |
|
|
|
|
||||||||
|
|
-8 = Don’t know |
|
|
|
|
||||||||
T1205 |
T1205 |
How secure did you feel when you used the subway or elevated train? |
Num |
3 |
3 |
securef |
||||||||
|
|
1 = Very secure |
|
|
|
|
||||||||
|
|
2 = Moderately secure |
|
|
|
|
||||||||
|
|
3 = Somewhat secure |
|
|
|
|
||||||||
|
|
4 = Not at all secure |
|
|
|
|
||||||||
Question Code |
Variable Name |
Variable label and description |
Type |
Length - MSA Data Set |
Length - National Data Set |
Format |
||||||||
|
|
-7 = Refused |
|
|
|
|
||||||||
|
|
-8 = Don’t know |
|
|
|
|
||||||||
|
|
-9 = Appropriate Skip |
|
|
|
|
||||||||
T1210 |
T1210 |
During September 2009 did you use a water ferry or water taxi? |
Num |
3 |
3 |
yesornof |
||||||||
|
|
1 = Yes |
|
|
|
|
||||||||
|
|
2 = No |
|
|
|
|
||||||||
|
|
-7 = Refused |
|
|
|
|
||||||||
|
|
-8 = Don’t know |
|
|
|
|
||||||||
T1215 |
T1215 |
How secure did you feel when you used the water ferry or water taxi? |
Num |
3 |
3 |
securef |
||||||||
|
|
1 = Very secure |
|
|
|
|
||||||||
|
|
2 = Moderately secure |
|
|
|
|
||||||||
|
|
3 = Somewhat secure |
|
|
|
|
||||||||
|
|
4 = Not at all secure |
|
|
|
|
||||||||
|
|
-7 = Refused |
|
|
|
|
||||||||
|
|
-8 = Don’t know |
|
|
|
|
||||||||
|
|
-9 = Appropriate Skip |
|
|
|
|
||||||||
T1220 |
T1220 |
During September 2009 did you use a light rail or streetcar? |
Num |
3 |
3 |
yesornof |
||||||||
|
|
1 = Yes |
|
|
|
|
||||||||
|
|
2 = No |
|
|
|
|
||||||||
|
|
-7 = Refused |
|
|
|
|
||||||||
|
|
-8 = Don’t know |
|
|
|
|
||||||||
T1225 |
T1225 |
How secure did you feel when you used the light rail or streetcar? |
Num |
3 |
3 |
securef |
||||||||
|
|
1 = Very secure |
|
|
|
|
||||||||
|
|
2 = Moderately secure |
|
|
|
|
||||||||
|
|
3 = Somewhat secure |
|
|
|
|
||||||||
|
|
4 = Not at all secure |
|
|
|
|
||||||||
|
|
-7 = Refused |
|
|
|
|
||||||||
|
|
-8 = Don’t know |
|
|
|
|
||||||||
|
|
-9 = Appropriate Skip |
|
|
|
|
||||||||
T1230 |
T1230 |
During September 2009 did you use a commuter rail or long distance train? |
Num |
3 |
3 |
yesornof |
||||||||
|
|
1 = Yes |
|
|
|
|
||||||||
|
|
2 = No |
|
|
|
|
||||||||
Question Code |
Variable Name |
Variable label and description |
Type |
Length - MSA Data Set |
Length - National Data Set |
Format |
||||||||
|
|
-7 = Refused |
|
|
|
|
||||||||
|
|
-8 = Don’t know |
|
|
|
|
||||||||
T1235 |
T1235 |
How secure did you feel when you used the commuter rail or long distance train? |
Num |
3 |
3 |
securef |
||||||||
|
|
1 = Very secure |
|
|
|
|
||||||||
|
|
2 = Moderately secure |
|
|
|
|
||||||||
|
|
3 = Somewhat secure |
|
|
|
|
||||||||
|
|
4 = Not at all secure |
|
|
|
|
||||||||
|
|
-7 = Refused |
|
|
|
|
||||||||
|
|
-8 = Don’t know |
|
|
|
|
||||||||
|
|
-9 = Appropriate Skip |
|
|
|
|
||||||||
T1250 |
T1250 |
During September 2009 did you use a transit bus, commuter bus, or intercity motor coach? |
Num |
3 |
3 |
yesornof |
||||||||
|
|
1 = Yes |
|
|
|
|
||||||||
|
|
2 = No |
|
|
|
|
||||||||
|
|
-7 = Refused |
|
|
|
|
||||||||
|
|
-8 = Don’t know |
|
|
|
|
||||||||
T1255 |
T1255 |
How secure did you feel when you used the transit bus, commuter bus, or intercity motor coach? |
Num |
3 |
3 |
securef |
||||||||
|
|
1 = Very secure |
|
|
|
|
||||||||
|
|
2 = Moderately secure |
|
|
|
|
||||||||
|
|
3 = Somewhat secure |
|
|
|
|
||||||||
|
|
4 = Not at all secure |
|
|
|
|
||||||||
|
|
-7 = Refused |
|
|
|
|
||||||||
|
|
-8 = Don’t know |
|
|
|
|
||||||||
|
|
-9 = Appropriate Skip |
|
|
|
|
||||||||
T1280 |
T1280 |
What is your level of confidence that security procedures for public transit will keep you safe from individuals with hostile intentions? |
Num |
3 |
3 |
confidef |
||||||||
|
|
1 = No confidence |
|
|
|
|
||||||||
|
|
2 = A small amount of confidence |
|
|
|
|
||||||||
|
|
3 = A moderate amount of confidence |
|
|
|
|
||||||||
|
|
4 = A great deal of confidence |
|
|
|
|
||||||||
|
|
5 = Total confidence |
|
|
|
|
||||||||
|
|
-7 = Refused |
|
|
|
|
||||||||
Question Code |
Variable Name |
Variable label and description |
Type |
Length - MSA Data Set |
Length - National Data Set |
Format |
||||||||
|
|
-8 = Don’t know |
|
|
|
|
||||||||
|
|
-9 = Appropriate Skip |
|
|
|
|
||||||||
T1300 |
T1300 |
How much additional time would you be willing to spend in transit on public transportation for increased security measures under elevated threat conditions? |
Num |
3 |
3 |
T1300f |
||||||||
|
|
1 = No additional time |
|
|
|
|
||||||||
|
|
2 = 1 to 5 minutes |
|
|
|
|
||||||||
|
|
3 = 6 to 10 minutes |
|
|
|
|
||||||||
|
|
4 = 11 to 15 minutes |
|
|
|
|
||||||||
|
|
5 = 16 to 20 minutes |
|
|
|
|
||||||||
|
|
6 = More than 20 minutes |
|
|
|
|
||||||||
|
|
-7 = Refused |
|
|
|
|
||||||||
|
|
-8 = Don’t know |
|
|
|
|
||||||||
|
|
-9 = Appropriate Skip |
|
|
|
|
||||||||
D1010 |
D1010 |
How many vehicles are owned, leased, or available for regular use by the people who currently live in your household |
Num |
3 |
3 |
fornumf |
||||||||
|
|
0 = MIN VALUE |
|
|
|
|
||||||||
|
|
10 = MAX VALUE |
|
|
|
|
||||||||
|
|
-7 = Refused |
|
|
|
|
||||||||
|
|
-8 = Don’t know |
|
|
|
|
||||||||
D1020 |
D1020 |
Do you have a medical condition that makes it difficult to travel outside the home |
Num |
3 |
3 |
yesornof |
||||||||
|
|
1 = Yes |
|
|
|
|
||||||||
|
|
2 = No |
|
|
|
|
||||||||
|
|
-7 = Refused |
|
|
|
|
||||||||
|
|
-8 = Don’t know |
|
|
|
|
||||||||
D1040 |
D1040 |
Range of age |
Num |
8 |
8 |
D1040f |
||||||||
|
|
1 = 18 to 24 |
|
|
|
|
||||||||
|
|
2 = 25 to 34 |
|
|
|
|
||||||||
|
|
3 = 35 to 44 |
|
|
|
|
||||||||
|
|
4 = 45 to 54 |
|
|
|
|
||||||||
|
|
5 = 55 to 64 |
|
|
|
|
||||||||
|
|
6 = 65 to 74 |
|
|
|
|
||||||||
|
|
7 = 75 or older |
|
|
|
|
||||||||
Question Code |
Variable Name |
Variable label and description |
Type |
Length - MSA Data Set |
Length - National Data Set |
Format |
||||||||
|
|
-7 = Refused |
|
|
|
|
||||||||
|
|
-8 = Don’t know |
|
|
|
|
||||||||
D1050 |
D1050 |
Gender |
Num |
3 |
3 |
D1050f |
||||||||
|
|
1 = Male |
|
|
|
|
||||||||
|
|
2 = Female |
|
|
|
|
||||||||
|
|
-7 = Refused |
|
|
|
|
||||||||
|
|
-8 = Don’t know |
|
|
|
|
||||||||
D1060 |
D1060 |
Do you consider yourself to be Spanish Hispanic or Latino |
Num |
3 |
3 |
yesornof |
||||||||
|
|
1 = Yes |
|
|
|
|
||||||||
|
|
2 = No |
|
|
|
|
||||||||
|
|
-7 = Refused |
|
|
|
|
||||||||
|
|
-8 = Don’t know |
|
|
|
|
||||||||
D1070 |
D1070_A |
White |
Num |
3 |
3 |
yesornof |
||||||||
|
|
1 = Yes |
|
|
|
|
||||||||
|
|
2 = No |
|
|
|
|
||||||||
|
|
-7 = Refused |
|
|
|
|
||||||||
|
|
-8 = Don’t know |
|
|
|
|
||||||||
D1070 |
D1070_B |
Black or African American |
Num |
3 |
3 |
yesornof |
||||||||
|
|
1 = Yes |
|
|
|
|
||||||||
|
|
2 = No |
|
|
|
|
||||||||
|
|
-7 = Refused |
|
|
|
|
||||||||
|
|
-8 = Don’t know |
|
|
|
|
||||||||
D1070 |
D1070_C |
American Indian or Alaska Native (Eskimo, Aleut) |
Num |
3 |
3 |
yesornof |
||||||||
|
|
1 = Yes |
|
|
|
|
||||||||
|
|
2 = No |
|
|
|
|
||||||||
|
|
-7 = Refused |
|
|
|
|
||||||||
|
|
-8 = Don’t know |
|
|
|
|
||||||||
D1070 |
D1070_D |
Asian (Asian Indian, Chinese, Filipino, Japanese, Korean, Vietnamese) |
Num |
3 |
3 |
yesornof |
||||||||
|
|
1 = Yes |
|
|
|
|
||||||||
|
|
2 = No |
|
|
|
|
||||||||
|
|
-7 = Refused |
|
|
|
|
||||||||
|
|
-8 = Don’t know |
|
|
|
|
||||||||
Question Code |
Variable Name |
Variable label and description |
Type |
Length - MSA Data Set |
Length - National Data Set |
Format |
||||||||
D1070 |
D1070_E |
Native Hawaiian or Other Pacific Islander (Guamanian, Chamorro, Samoan) |
Num |
3 |
3 |
yesornof |
||||||||
|
|
1 = Yes |
|
|
|
|
||||||||
|
|
2 = No |
|
|
|
|
||||||||
|
|
-7 = Refused |
|
|
|
|
||||||||
|
|
-8 = Don’t know |
|
|
|
|
||||||||
D1070 |
D1070_F |
Other race |
Num |
3 |
3 |
yesornof |
||||||||
|
|
1 = Yes |
|
|
|
|
||||||||
|
|
2 = No |
|
|
|
|
||||||||
|
|
-7 = Refused |
|
|
|
|
||||||||
|
|
-8 = Don’t know |
|
|
|
|
||||||||
D1070 |
RACEETH |
Race/ethnicity of respondents - created variable based on D1060 and D1070_A - D1070_F |
Num |
8 |
8 |
racef |
||||||||
|
|
1 = Hispanic |
|
|
|
|
||||||||
|
|
2 = White, non-Hispanic |
|
|
|
|
||||||||
|
|
3 = Black, non-Hispanic |
|
|
|
|
||||||||
|
|
4 = Other race, non-Hispanic |
|
|
|
|
||||||||
D1080 |
D1080 |
What is the highest level of education you have completed |
Num |
3 |
3 |
D1080f |
||||||||
|
|
1 = Less than high school graduate |
|
|
|
|
||||||||
|
|
2 = High school graduate or GED |
|
|
|
|
||||||||
|
|
3 = Some college (or technical vocational school professional business school) |
|
|
|
|
||||||||
|
|
4 = Two year college degree |
|
|
|
|
||||||||
|
|
5 = Four year college degree |
|
|
|
|
||||||||
|
|
6 = Graduate degree |
|
|
|
|
||||||||
|
|
-7 = Refused |
|
|
|
|
||||||||
|
|
-8 = Don’t know |
|
|
|
|
||||||||
D1090 |
D1090 |
Please stop me when I reach the category that includes your households total annual income for last calendar year |
Num |
3 |
3 |
D1090f |
||||||||
|
|
1 = Under 15,000 |
|
|
|
|
||||||||
|
|
2 = 15,000 to less than 30,000 |
|
|
|
|
||||||||
|
|
3 = 30,000 to less than 50,000 |
|
|
|
|
||||||||
|
|
4 = 50,000 to less than 75,000 |
|
|
|
|
||||||||
|
|
5 = 75,000 to less than 100,000 |
|
|
|
|
||||||||
|
|
6 = 100,000 to less than 125,000 |
|
|
|
|
||||||||
Question Code |
Variable Name |
Variable label and description |
Type |
Length - MSA Data Set |
Length - National Data Set |
Format |
||||||||
|
|
7 = 125,000 or more |
|
|
|
|
||||||||
|
|
-7 = Refused |
|
|
|
|
||||||||
|
|
-8 = Don’t know |
|
|
|
|
||||||||
|
|
-7 = Refused |
|
|
|
|
||||||||
|
|
-8 = Don’t know |
|
|
|
|
||||||||
|
BASEWGT |
Base weight |
Num |
8 |
8 |
|
||||||||
|
FNLWGT |
Final analysis weight |
Num |
8 |
8 |
|
||||||||
Appendix C: SAS Format Library
proc format library=OHS ctnlout=ohsfmt;
value metrof
1="Inside an MSA"
2="Outside an MSA";
value regionf
1 = "Northeast"
2 = "Midwest"
3 = "South"
4 = "West";
value cendivf
1="New England"
2="Middle Atlantic"
3="East North Central"
4="West North Central"
5="South Atlantic"
6="East South Central"
7="West South Central"
8="Mountain"
9="Pacific";
value msaf
1="Atlanta-Sandy Springs-Marietta, GA"
2="Boston-Cambridge-Quincy, MA-NH"
3="Chicago-Naperville-Joliet, IL-IN-WI"
4="Los Angeles-Long Beach- Santa Ana, CA"
5="Miami-Fort Lauderdale-Pompano Beach, FL"
6="New York-Northern New Jersey-Long Island, NY-NJ-PA"
7="Philadelphia-Camden-Wilmington, PA-NJ-DE-MD"
8="San Francisco-Oakland-Fremont, CA"
9="Washington-Arlington-Alexandria, DC-VA-MD-WV";
value fornumf
-9 = "Appropriate Skip"
-8 = "Do not know"
-7 = "Refused";
value yesornof
1 = "Yes"
2 = "No"
-9 = "Appropriate Skip"
-8 = "Do not know"
-7 = "Refused";
value L1000f
1 = "Urban Area in Downtown or the City Center"
2 = "Urban Area NOT in the Downtown or City Center"
3 = "Suburban"
4 = "Rural"
-8 = "Do not know"
-7 = "Refused";
value L1020f
1 = "Very important"
2 = "Somewhat important"
3 = "Somewhat unimportant"
4 = "Not important"
-8 = "Do not know"
-7 = "Refused";
value L1040f
1 = "Strongly agree"
2 = "Somewhat agree"
3 = "Somewhat disagree"
4 = "Strongly disagree"
-8 = "Do not know"
-7 = "Refused";
value J1050f
1 = "Very congested"
2 = "Moderately congested"
3 = "Slightly congested"
4 = "Not at all congested"
-9 = "Appropriate Skip"
-8 = "Do not know"
-7 = "Refused";
value J1065f
1 = "Made additional stops on at least half of all commute trips"
2 = "Made additional stops on some but fewer than half of all com"
3 = "Did not make any additional trips or almost none"
-9 = "Appropriate Skip"
-8 = "Do not know"
-7 = "Refused";
value J1070f
1 = "Much better"
2 = "Somewhat better"
3 = "Stayed about the same"
4 = "Somewhat worse"
5 = "Much worse"
-9 = "Appropriate Skip"
-8 = "Do not know"
-7 = "Refused";
value J1120f
1 = "Convenience"
2 = "Saves the company money"
3 = "Saves me money"
4 = "Saves me time"
5 = "To avoid congestion"
6 = "Allows me to take care of family members - be home when kids"
7 = "I do not live in the same area as the company I work for"
8 = "I work for multiple businesses"
9 = "I get more work done at home"
10 = "For health reasons - disability reasons"
11 = "Lack of transportation"
12 = "Other - specify"
-9 = "Appropriate Skip";
value T1080f
1 = "Much shorter than expected"
2 = "Shorter than expected"
3 = "About what you expected"
4 = "Longer than you expected"
5 = "Much longer than you expected"
6 = "You had no expectation"
-9 = "Appropriate Skip"
-8 = "Do not know"
-7 = "Refused";
value satisfyf
1 = "Very satisfied"
2 = "Satisfied"
3 = "Dissatisfied"
4 = "Very dissatisfied"
-9 = "Appropriate Skip"
-8 = "Do not know"
-7 = "Refused";
value T1102f
1 = "Medical Reasons"
2 = "Travel Documents"
3 = "Clothing"
4 = "Randomly Selected"
5 = "Another Reason - specify"
-9 = "Appropriate Skip"
-8 = "Do not know"
-7 = "Refused";
value T1106f
1 = "Very satisfied"
2 = "Satisfied"
3 = "Dissatisfied"
4 = "Very dissatisfied"
5 = "Does not apply; there was or has been no resolution"
-9 = "Appropriate Skip"
-8 = "Do not know"
-7 = "Refused";
value T1110f
1 = "Excessive"
2 = "Appropriate"
3 = "Inadequate"
-9 = "Appropriate Skip"
-8 = "Do not know"
-7 = "Refused";
value confidef
1 = "No confidence"
2 = "A small amount of confidence"
3 = "A moderate amount of confidence"
4 = "A great deal of confidence"
5 = "Total confidence"
-9 = "Appropriate Skip"
-8 = "Do not know"
-7 = "Refused";
value T1130f
1 = "Very well informed"
2 = "Moderately well informed"
3 = "Slightly informed"
4 = "Not at all informed"
-9 = "Appropriate Skip"
-8 = "Do not know"
-7 = "Refused";
value T1180f
1 = "Definitely should"
2 = "Probably should"
3 = "Not sure"
4 = "Probably should not"
5 = "Definitely should not"
-9 = "Appropriate Skip"
-8 = "Do not know"
-7 = "Refused";
value securef
1 = "Very secure"
2 = "Moderately secure"
3 = "Somewhat secure"
4 = "Not at all secure"
-9 = "Appropriate Skip"
-8 = "Do not know"
-7 = "Refused";
value T1300f
1 = "No additional time"
2 = "1 to 5 minutes"
3 = "6 to 10 minutes"
4 = "11 to 15 minutes"
5 = "16 to 20 minutes"
6 = "More than 20 minutes"
-9 = "Appropriate Skip"
-8 = "Do not know"
-7 = "Refused";
value D1050F
1 = "Male"
2 = "Female"
-9 = "Appropriate Skip"
-8 = "Do not know"
-7 = "Refused";
value D1060f
-8 = "Don't know"
-7 = "Refused"
1 = "Yes, Hispanic"
2 = "No, not Hispanic" ;
value D1080f
1 = "Less than high school graduate"
2 = "High school graduate (or GED)"
3 = "Some college (or technical vocational school - professional"
4 = "Two-year college degree"
5 = "Four-year college degree"
6 = "Graduate degree"
-9 = "Appropriate Skip"
-8 = "Do not know"
-7 = "Refused";
value D1090f
1 = "Under $15,000"
2 = "From $15,000 to less than $30,000"
3 = "From $30,000 to less than $50,000"
4 = "From $50,000 to less than $75,000"
5 = "From $75,000 to less than $100,000"
6 = "From $100,000 to less than $125,000"
7 = "$125,000 or more"
-9 = "Appropriate Skip"
-8 = "Do not know"
-7 = "Refused";
value D1040f
1 = "18 - 24"
2 = "25 - 34"
3 = "35 - 44"
4 = "45 - 54"
5 = "55 - 64"
6 = "65 - 74"
7 = "75 or over"
-8 = "Do not know"
-7 = "Refused";
value T1040f
1 = "Less than three month ago"
2 = "More than three month ago but less than a year ago"
3 = "One year ago"
4 = "More than one year ago"
-9 = "Appropriate Skip"
-8 = "Do not know"
-7 = "Refused";
value racef
0="Total"
1 = "Hispanic"
2 = "White, nonhispanic"
3 = "Black, nonhispanic"
4 = "Other, nonhispanic";
RUN;
Appendix D: Frequency Tables – National Sample
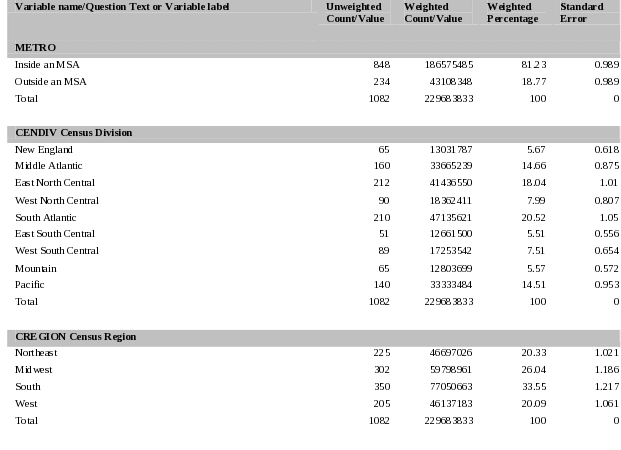
Section M – Mode Use Questions
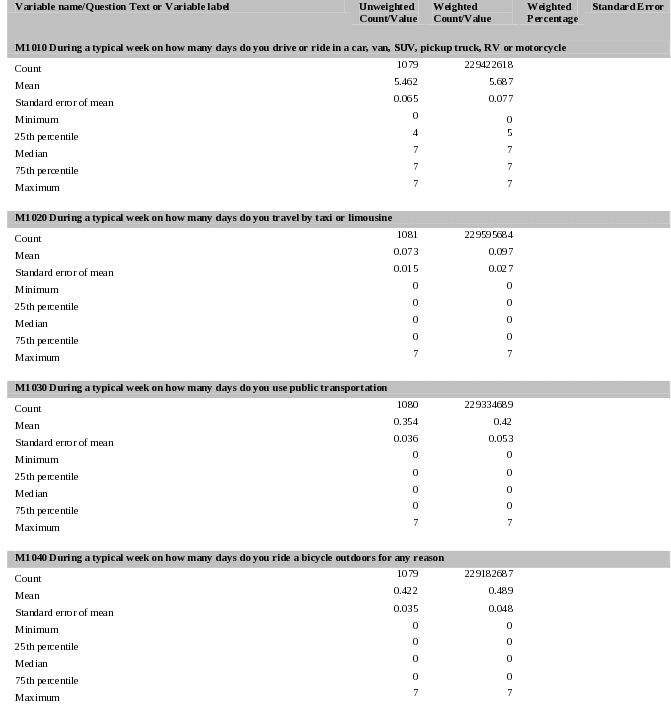
Section L – Community Livability Questions
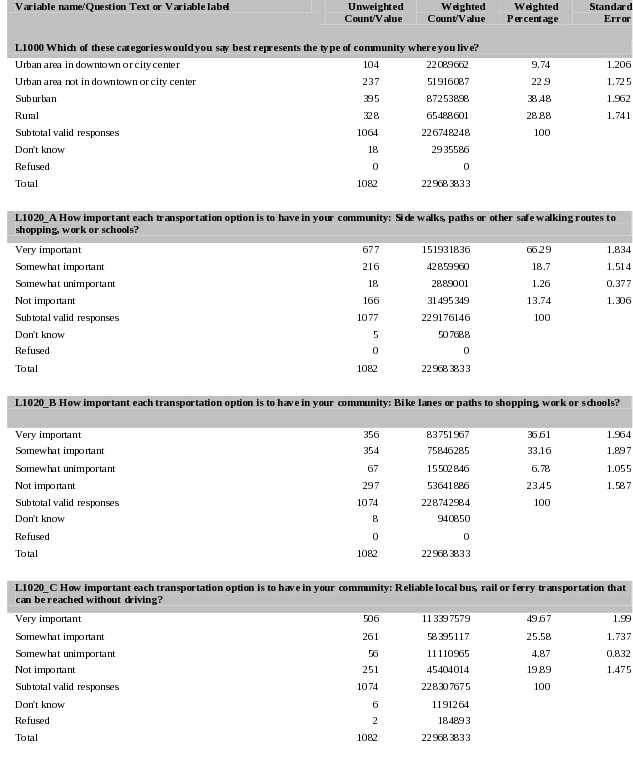
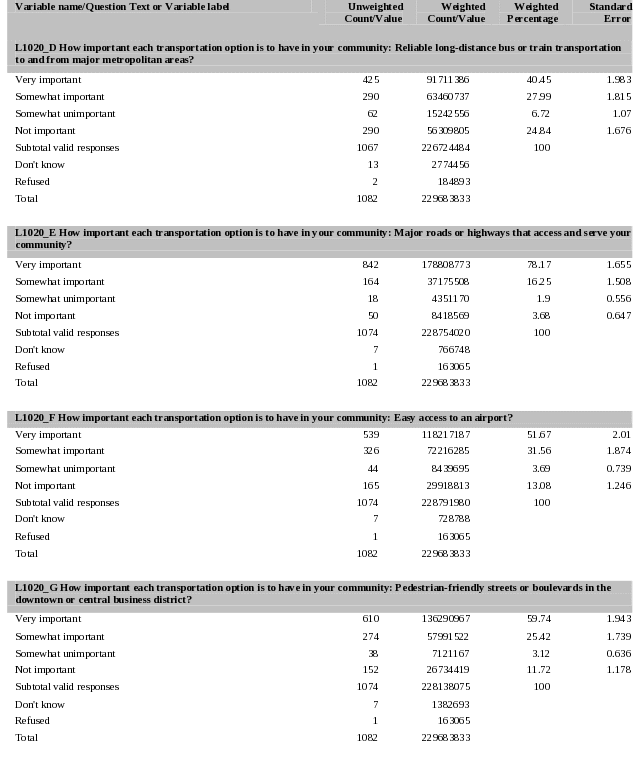
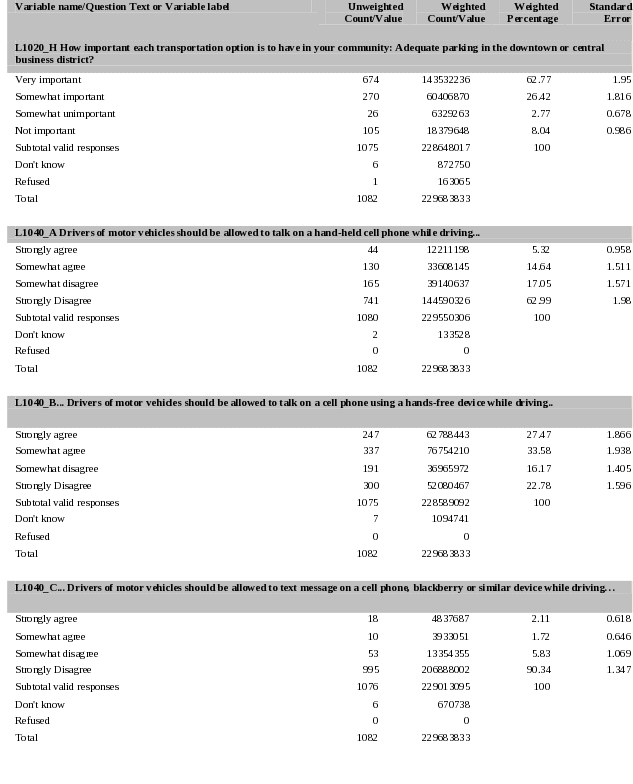
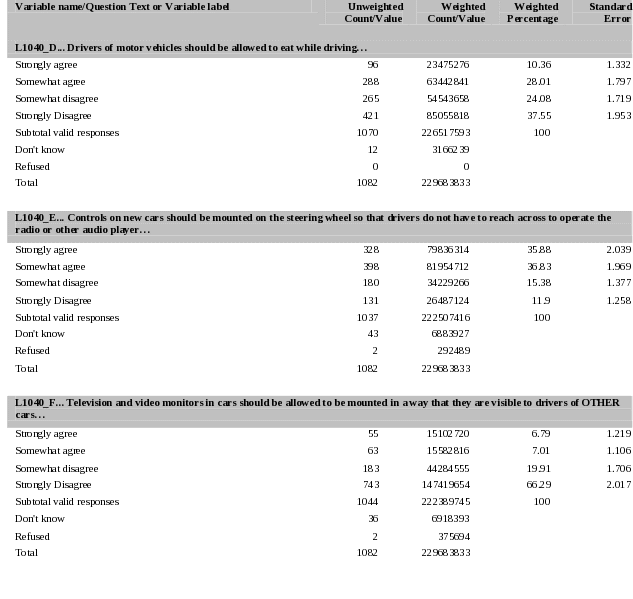
Section J – Journey to Work Items

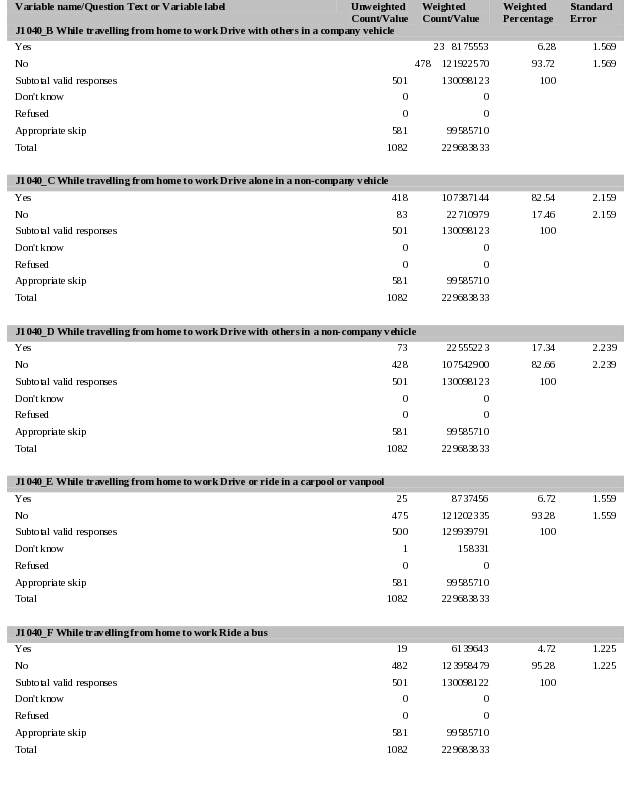

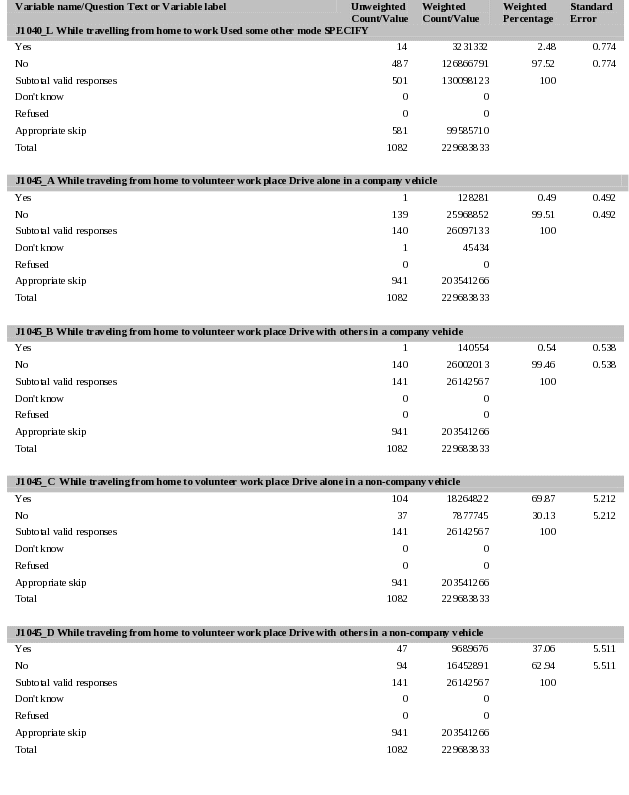
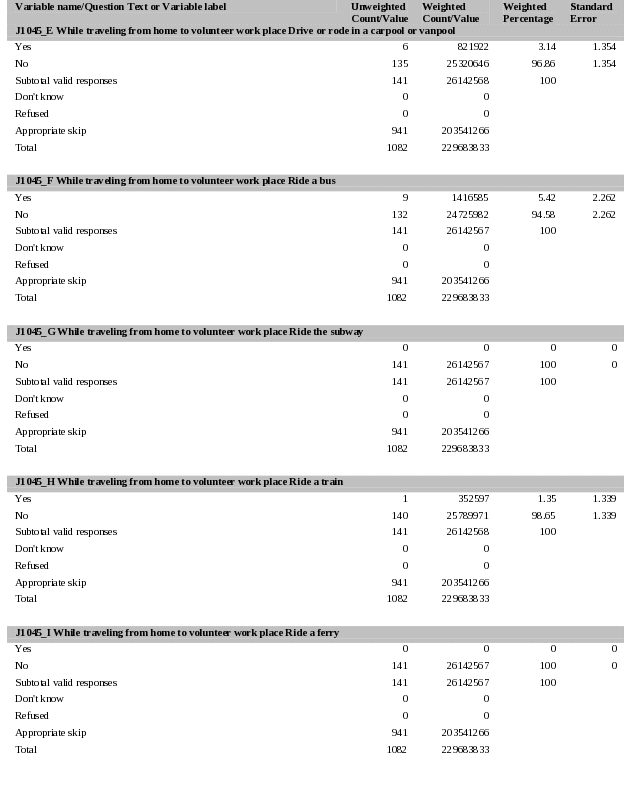
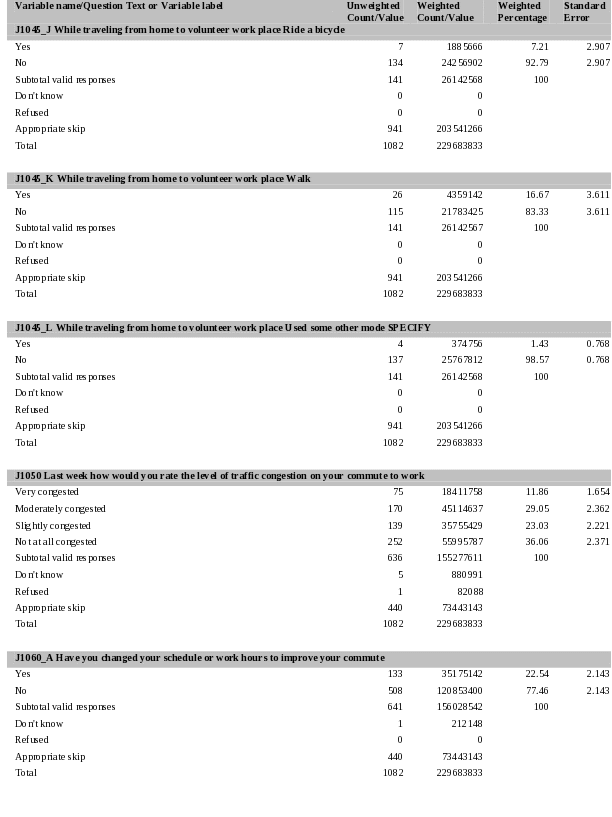
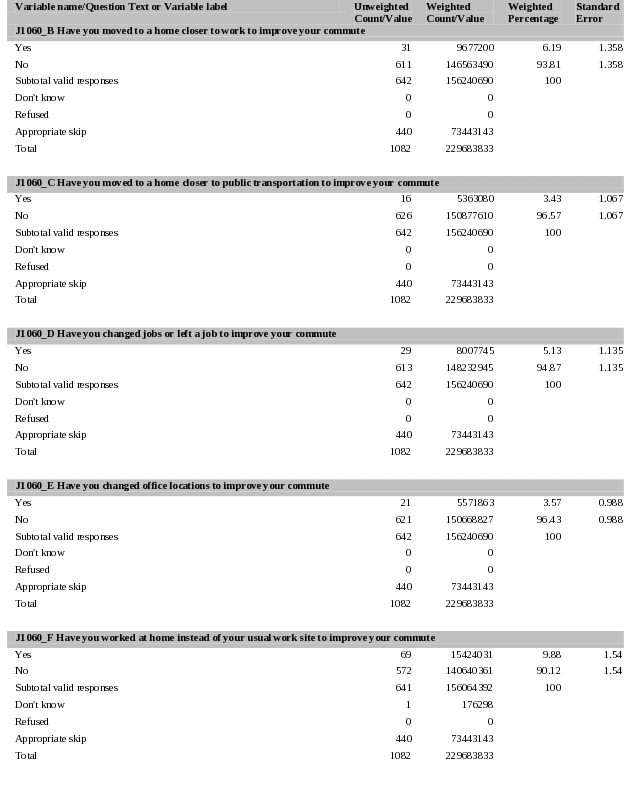

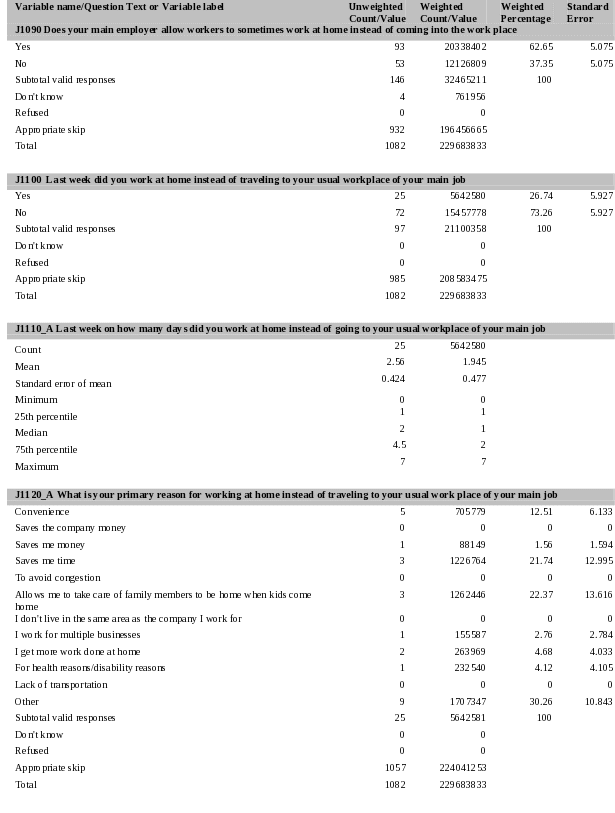
Section T – TSA Items

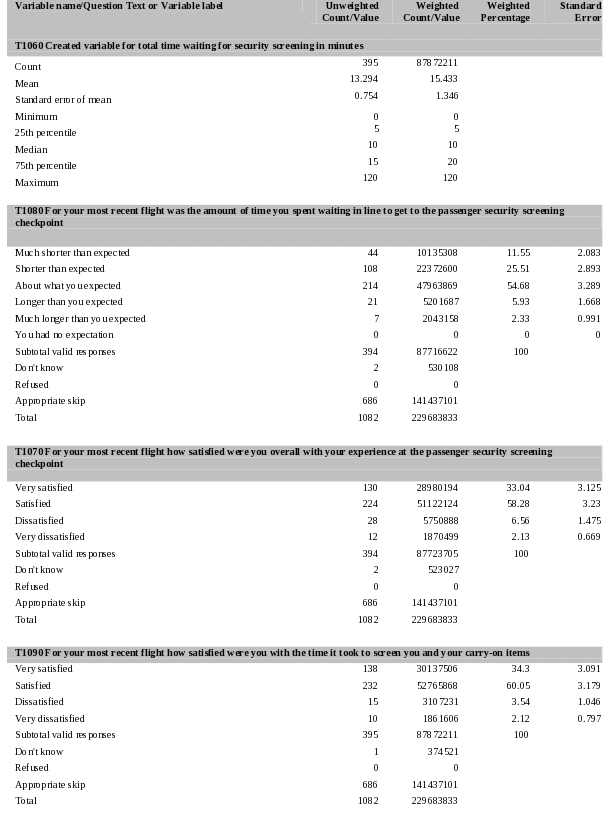
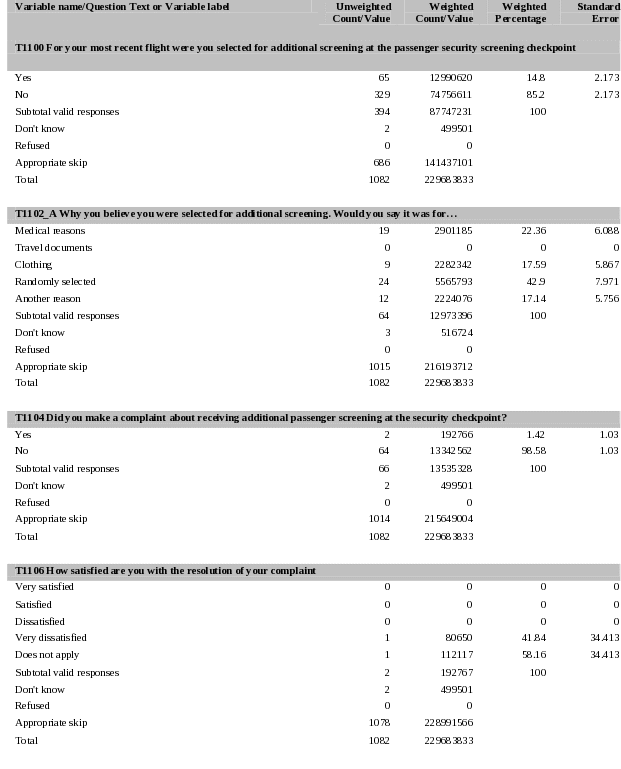
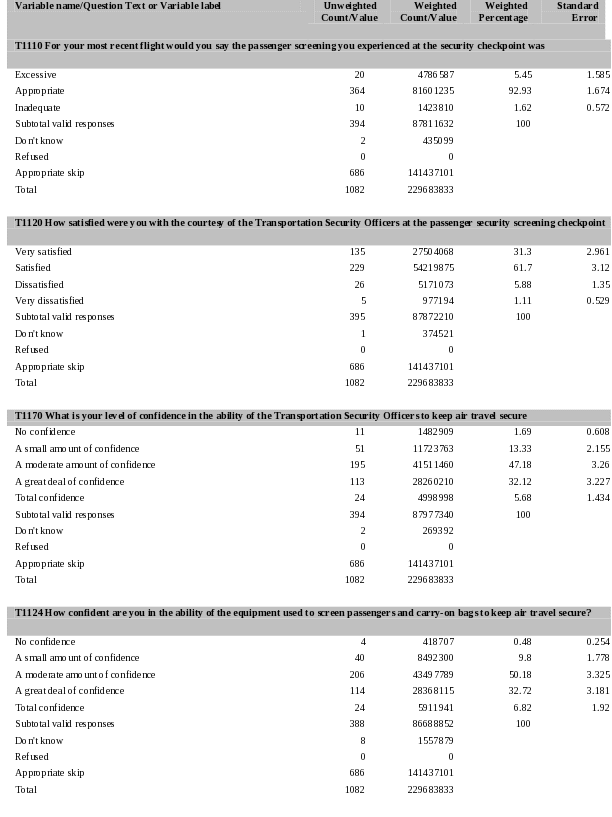
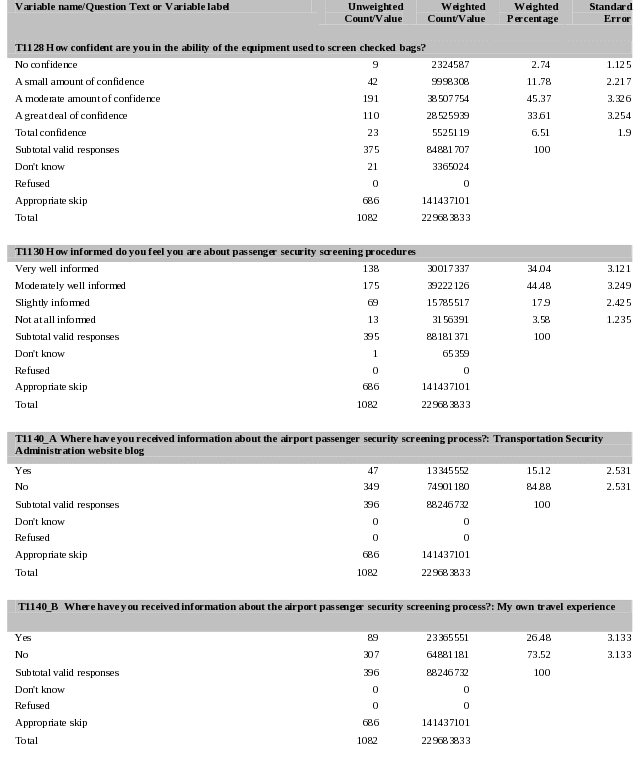
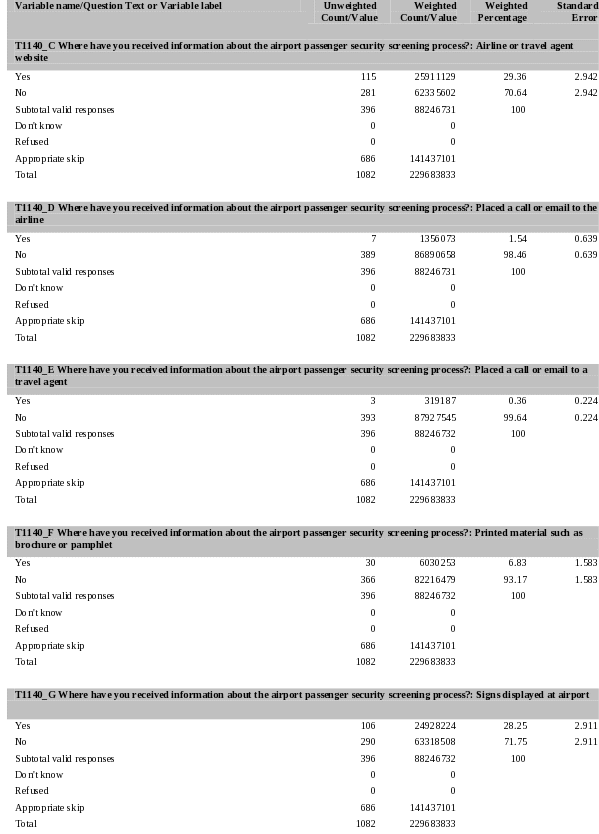
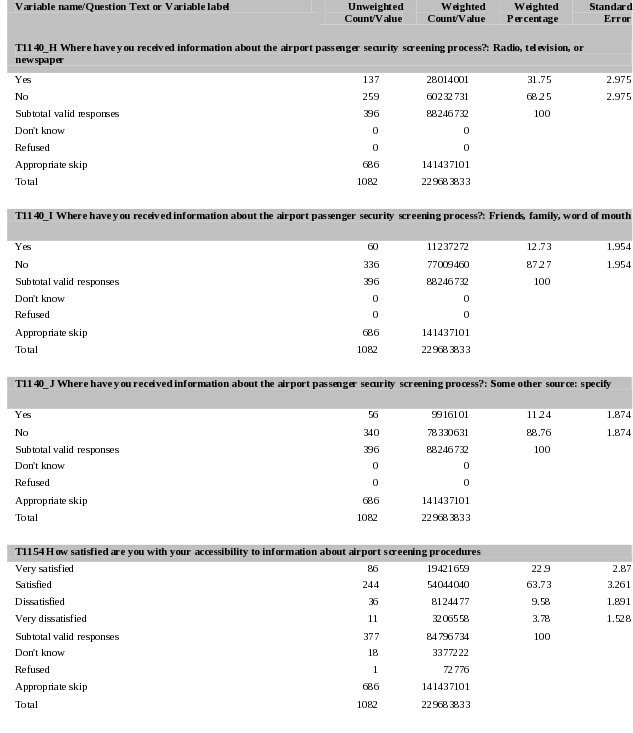

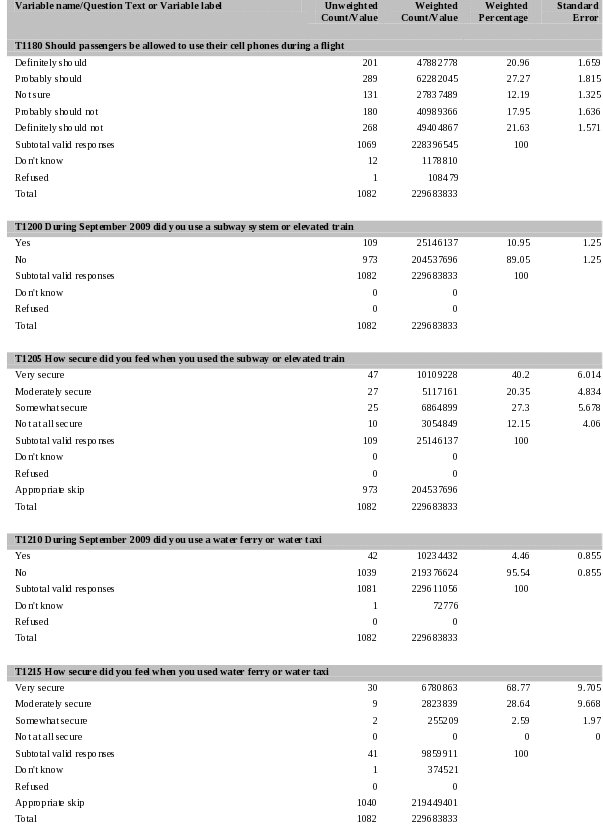
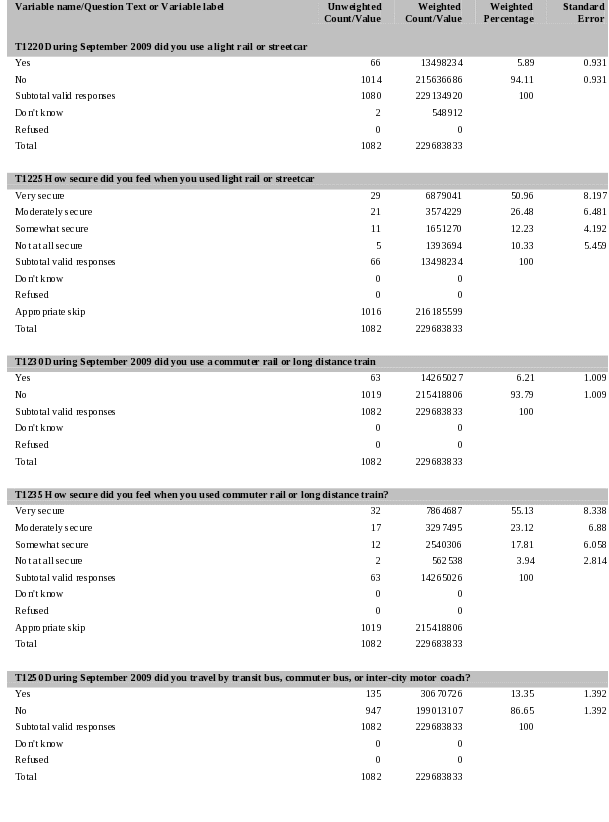
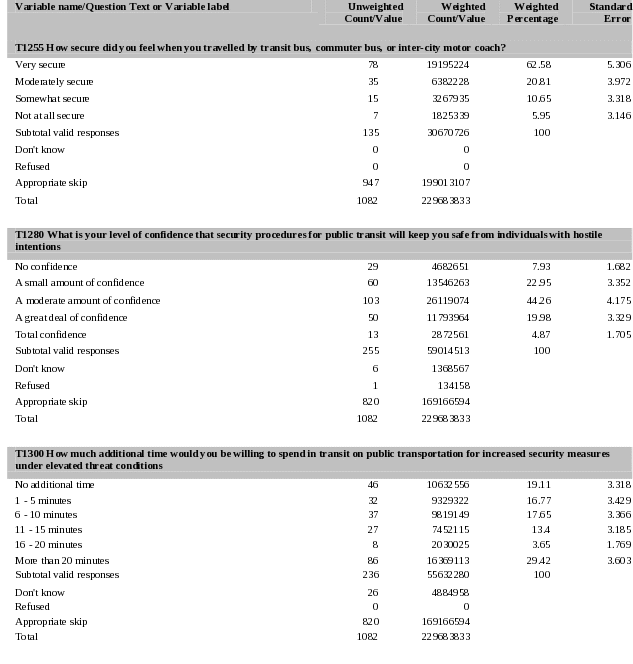
Section D – Demographic Questions

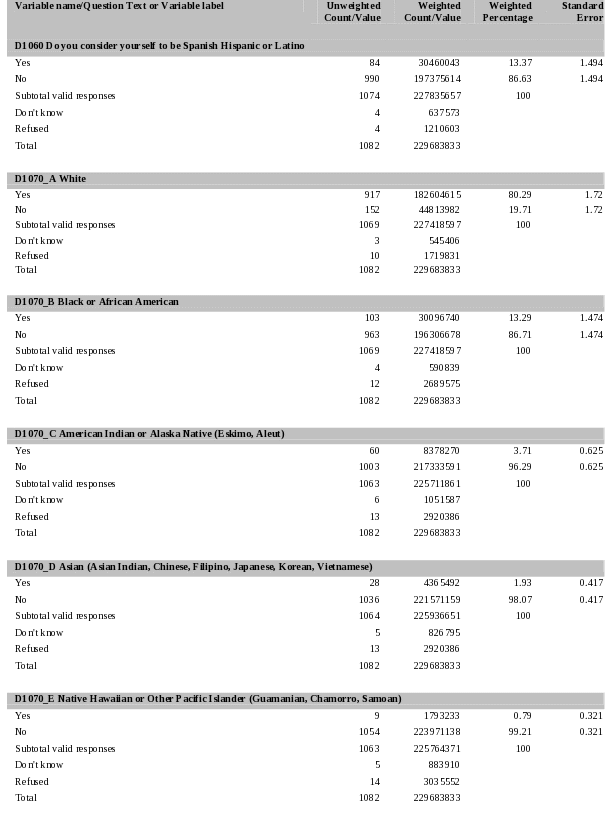
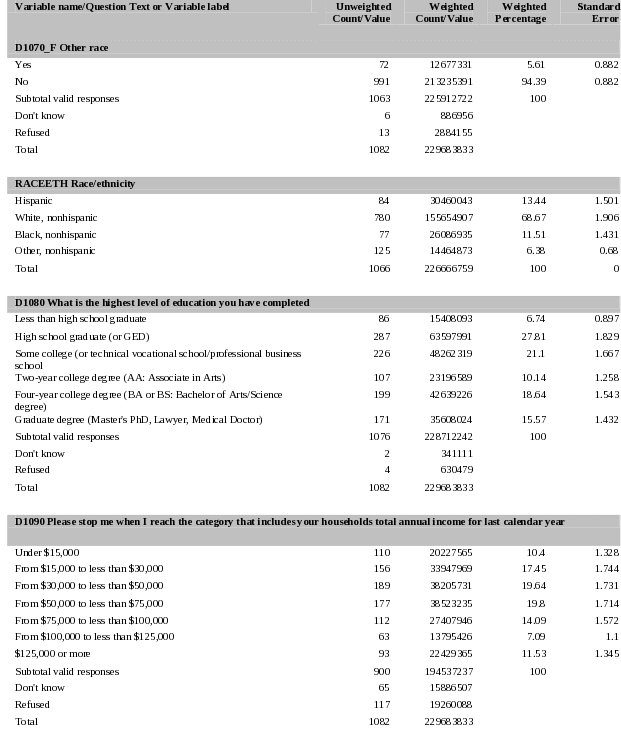
Appendix E: Frequency Tables – Sample of Targeted MSAs
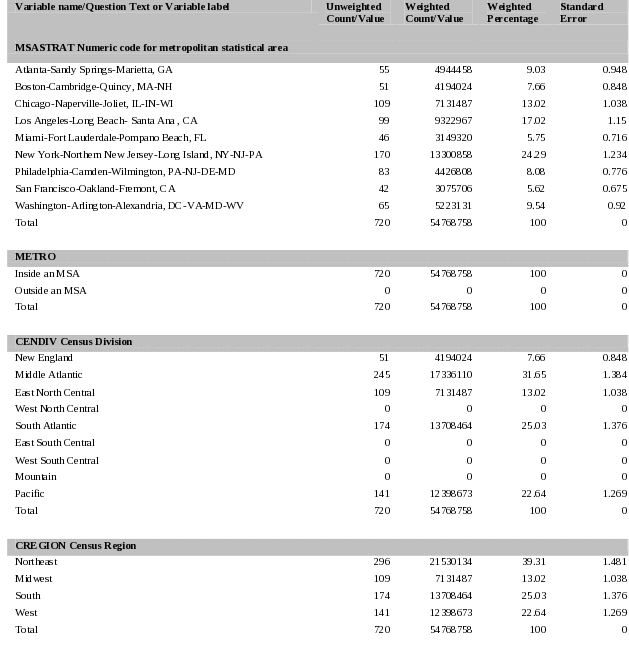
Section M – Mode Use Questions
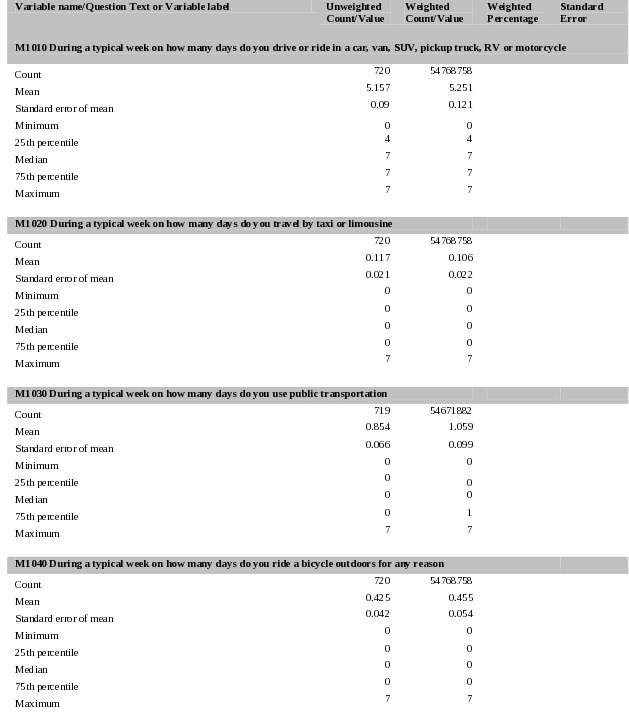
Section L – Community Livability Questions
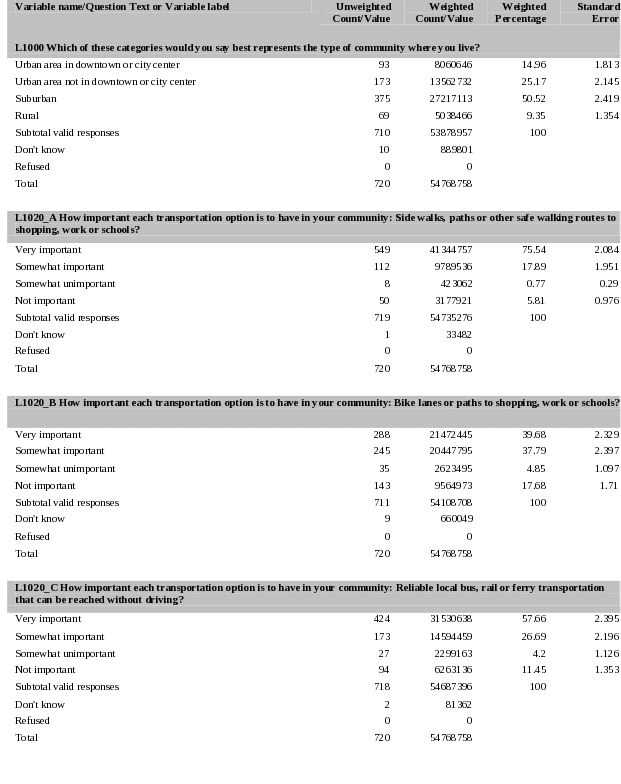


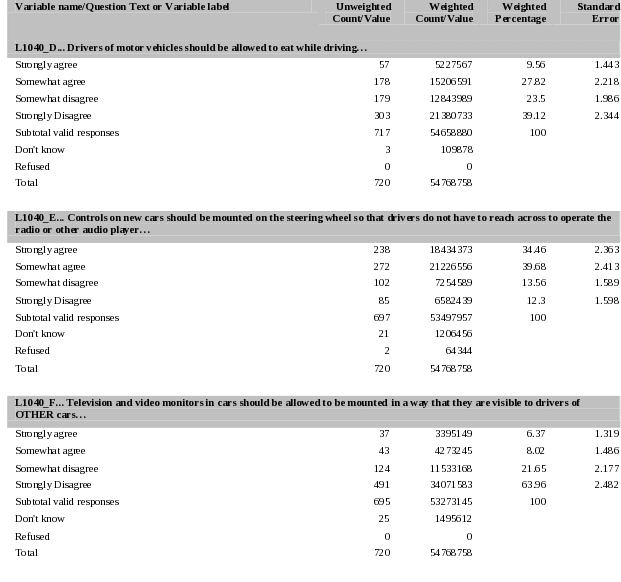
Section J – Journey to Work Items
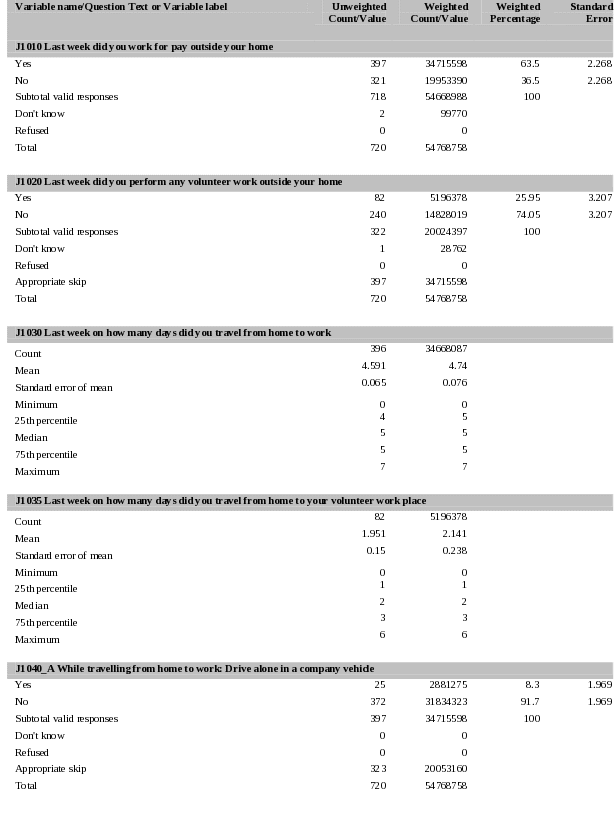
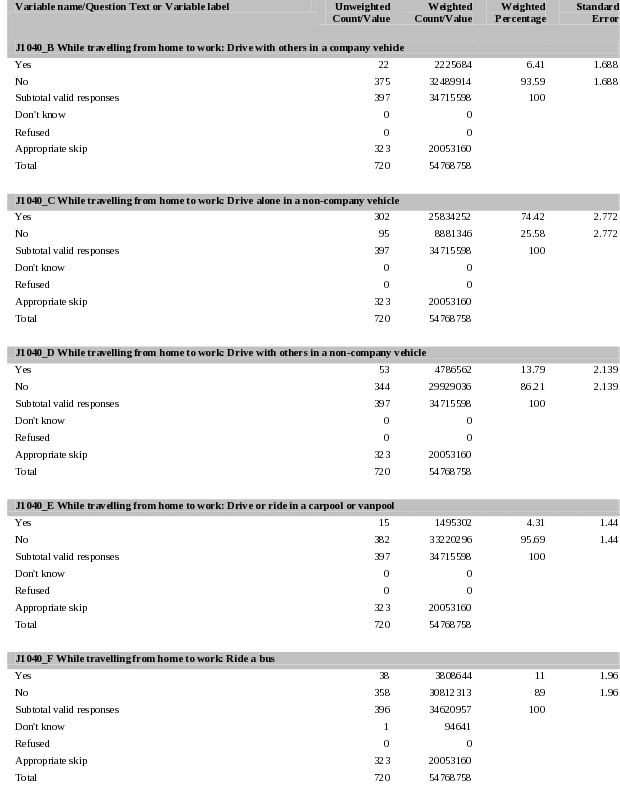
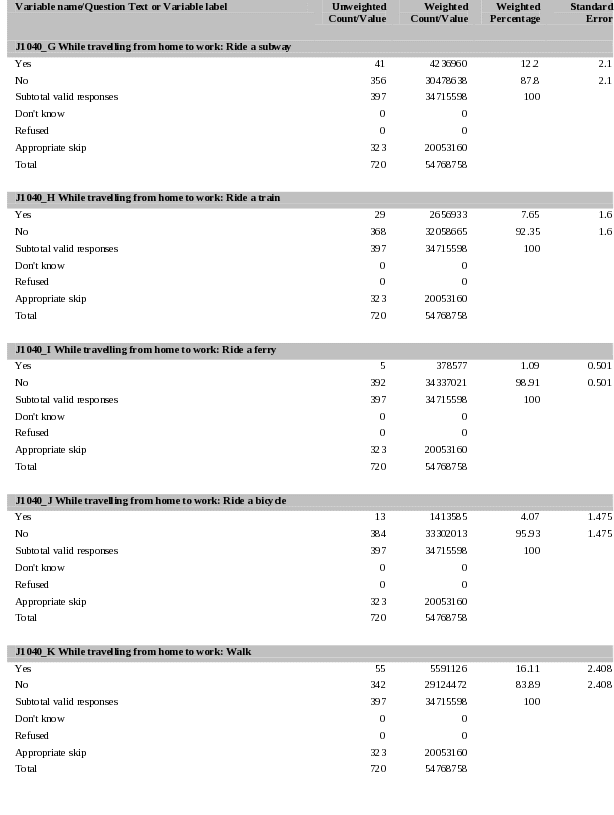

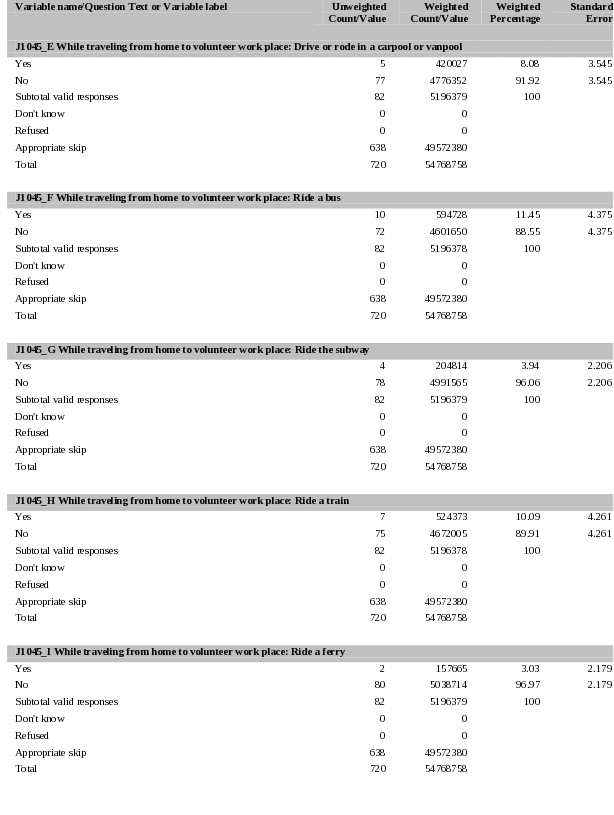

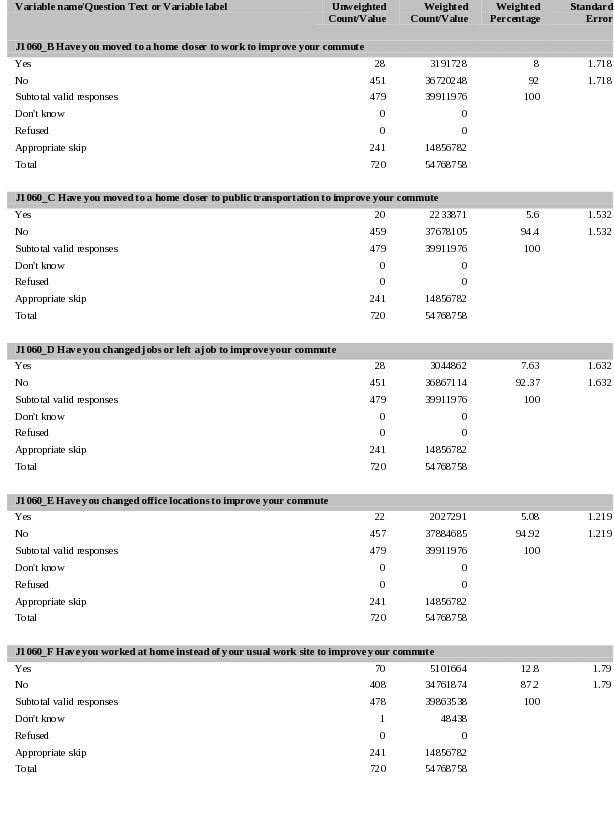
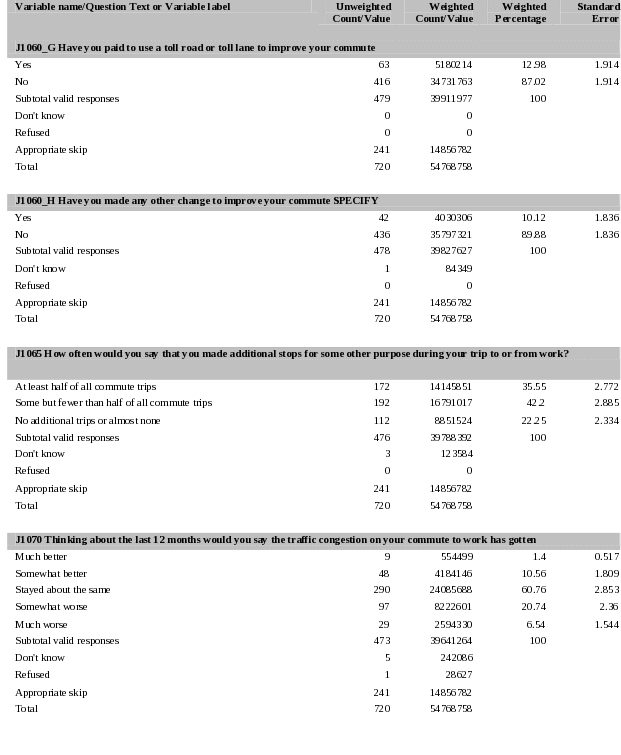

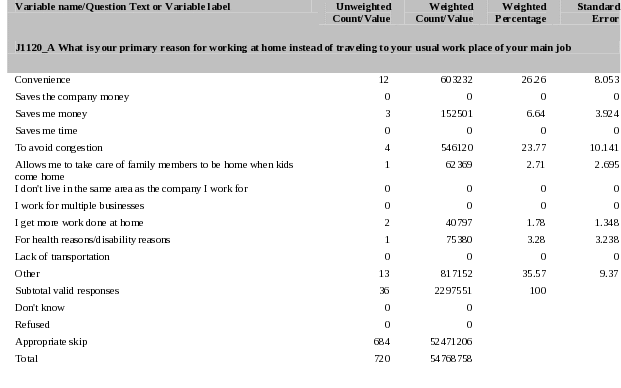
Section T – TSA Items
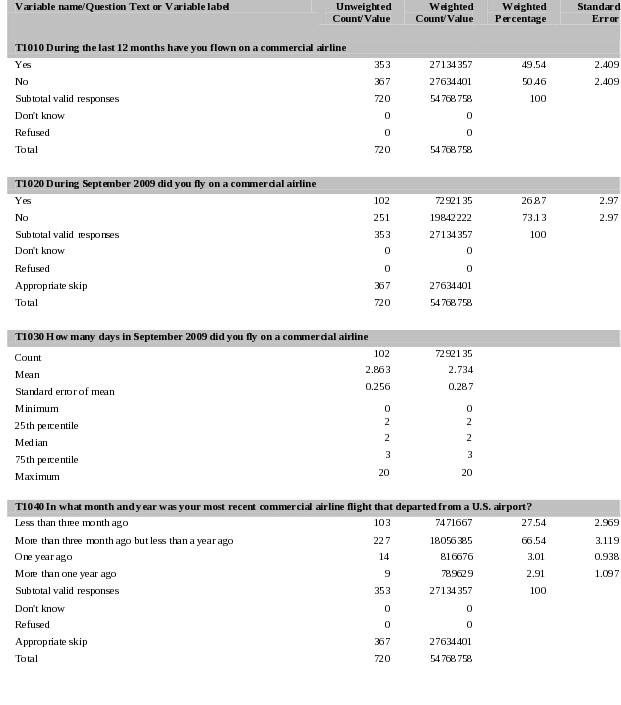

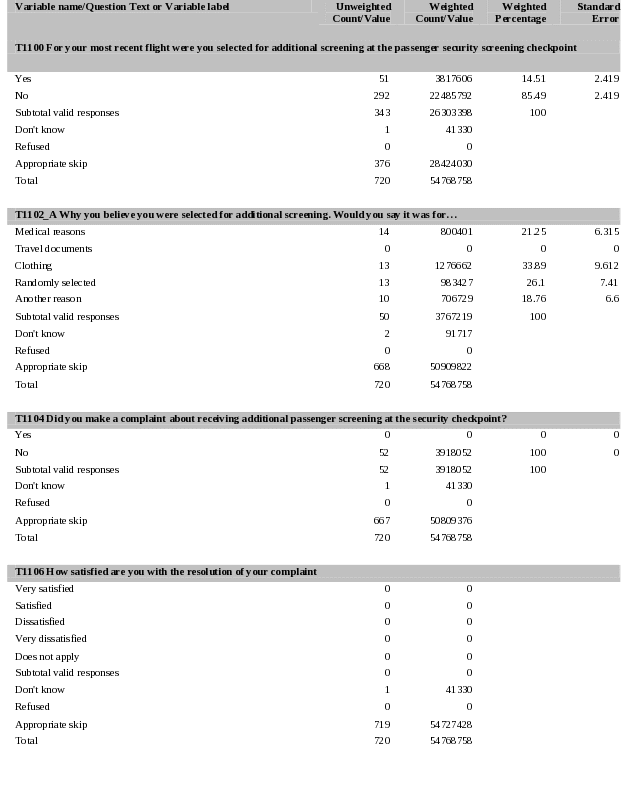

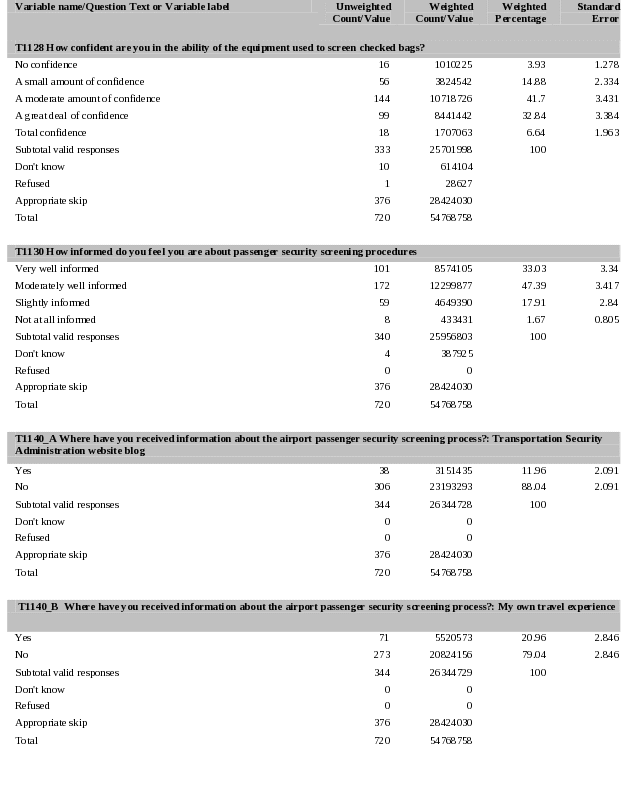
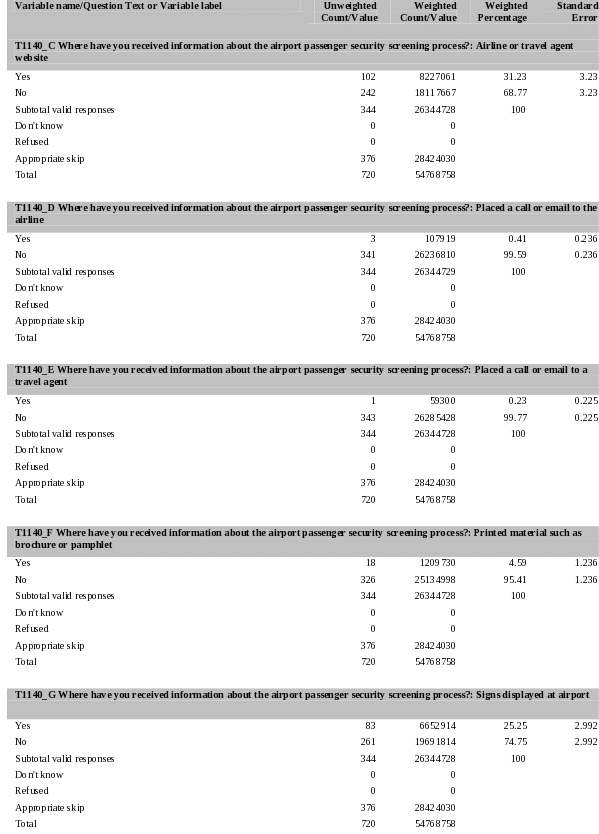
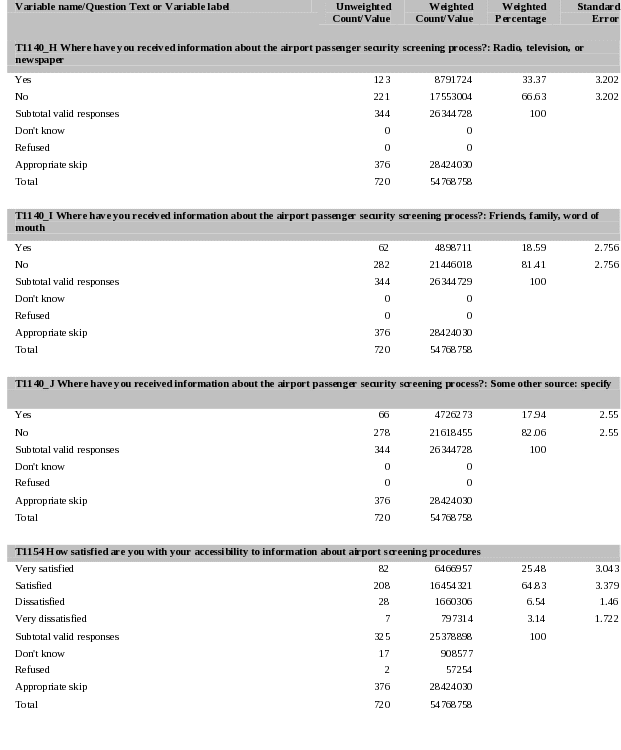
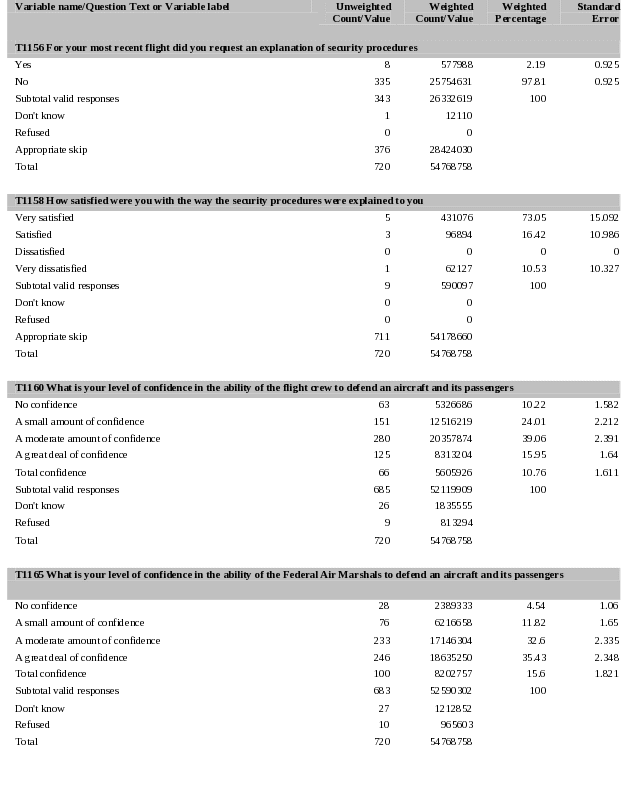


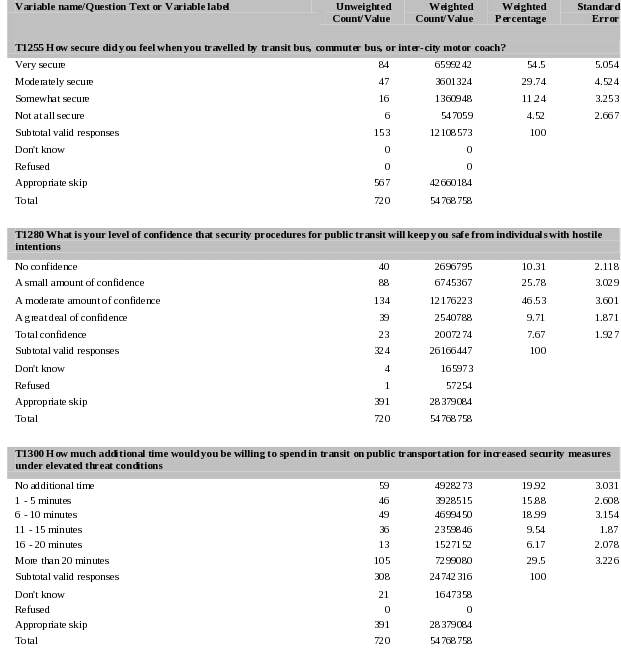
Section D – Demographic Questions
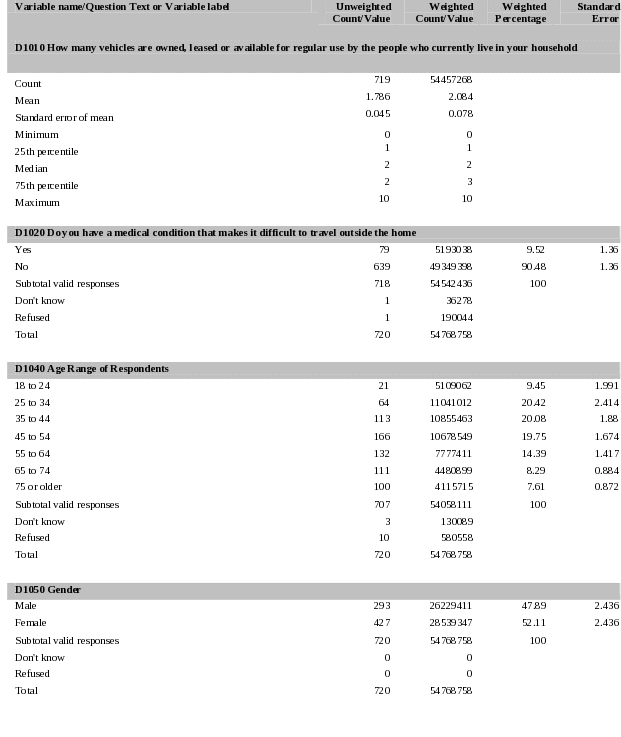
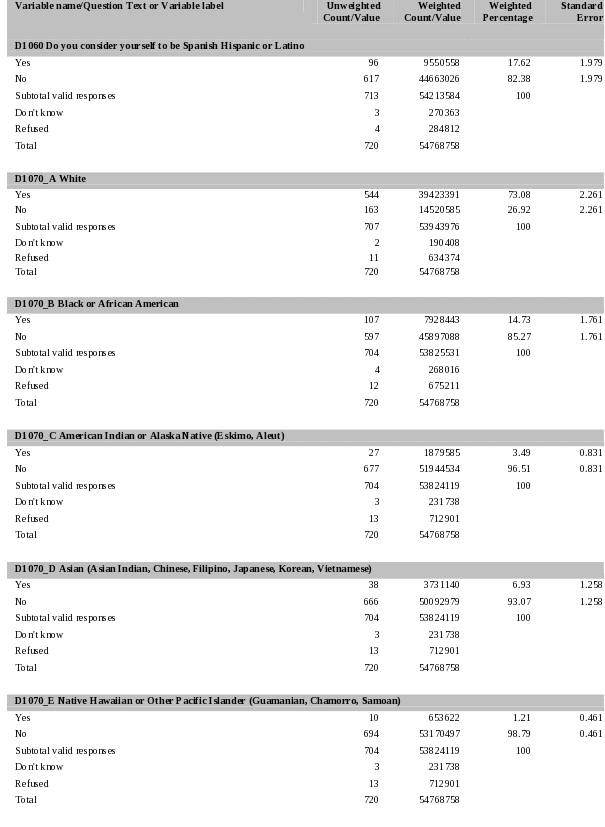
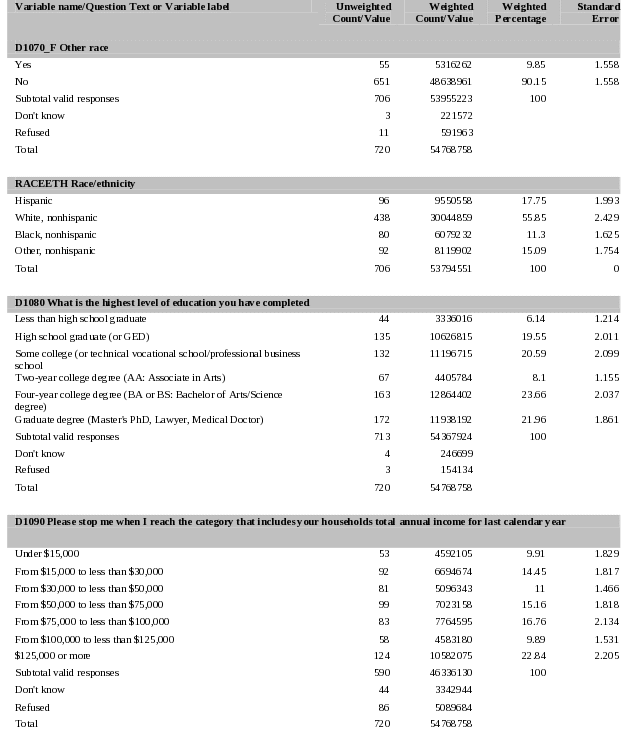
References
Books:
“Sampling of Populations: Methods and
Applications,” 3rd Ed., 1999, Paul S. Levy (School of Public
Health, University of Illinois at Chicago) and Stanley Lemeshow
(School of Public Health, University of Massachusetts).
“Practical
Methods for Design and Analysis of Complex Surveys,” 1995,
Risto Lehtonen (The Social Insurance Institution, Finland) and Erkki
J. Pahkinen (University of Jyvaskyla).
“Sampling Techniques,” 2nd Ed., 1967, William G. Cochran (Harvard University), Wiley.
“SUDAAN Language Manual, Release 10.0,” 1st Ed., 2008, Research Triangle Institute, Research Triangle Park, NC: Research Triangle Institute.
Articles:
“The Next-Birthday Method of Respondent Selection,” by Charles T. Salmon and John Spicer Nichols, Public Opinion Quarterly, Vol. 47: 270–276, 1983.
“1999 Variance Estimation,” National Survey of America’s Families Methodology Report, 1999 Methodology Series, Report No. 4, prepared by J.M. Brick, P. Broene, D. Ferraro, T. Hankins, C. Rauch and T. Strickler, November 2000.
“Pitfalls of Using Standard Statistical Software Packages for Sample Survey Data,” Donna J. Brogan, Encyclopedia of Biostatistics, edited by P. Armitage and T. Colton, John Wiley, 1998.
“Sampling and Weighting in the National Assessment,” K. Rust and E. Johnson, Journal of Educational Statistics, 17(2): 111–129, 1992.
“Poststratification and weighting adjustments,” Andrew Gelman and John B. Carlin, Department of Statistics, Columbia University Working Paper, February 2000.
“Sampling Variances for Surveys With Weighting, Poststratification, and Raking,” Hao Lu and Andrew Gelman, Department of Statistics, Columbia University Working Paper, April 2000.
1 This method of confidence interval calculation is conservative.
2 The Census Bureau provides a detailed breakdown of population count by age, gender, and race/ethnicity.
3 The four race/ethnicity categories used for post-stratification purposes are: Hispanic (any race), Black, non-Hispanic, White, non-Hispanic, and Other, non-Hispanic.
4 See Table 7 for code descriptions.
5 See Table 7 for code descriptions.
|
|
| File Type | application/msword |
| Author | pheny.weidman |
| Last Modified By | pheny.weidman |
| File Modified | 2010-10-20 |
| File Created | 2010-10-13 |
© 2026 OMB.report | Privacy Policy