3D SEER Moderator Guide for HC Professionals
Generic Clearance for the Collection of Qualitative Feedback on Agency Service Delivery
#3_SEER_Attach D_Guide Health Professional
Revised Bundled Sub-study #2 and #3_Usability Testing for DCEG Newsletter Linkage and SEER Consolidated Cancer Statistics Tool
OMB: 0925-0642


Attachment D:
SEER Statistics
Initial Interviews With End Users
Interviewer’s Guide – Health Professional
[Note: The purpose of this document is to guide the interviewer. The questions and tasks contained herein may not be asked as written. The facilitator often draws upon participant comments and the natural flow of the interview process. While the facilitator will try to follow the order of the guide, many times questions will come up ahead of time or in a different order. The facilitator may allow the order of the questions to change in order to let the process flow naturally.]
OMB
No.: 0925-0642-03 Expiration
Date: 9/30/2014 PRIVACY
ACT NOTIFICATION STATEMENT The
National Cancer Program—Sec. 411 [285a] provides authority for
collection of information. (For details about the authority see
http://codes.lp.findlaw.com/uscode/42/6A/III/C/1.)
Personally identifying information (name, address, phone number, and
email) are collected to contact participants and arrange a time of
participation and to provide an incentive as a thank you for their
time. This information will be shared only with those who need to
contact participants about the time or with those who will
compensate participants for their time. Providing this information
is voluntary although without this information, the participant
cannot be scheduled or receive an incentive to participate. This
information is not shared further and it is destroyed after it has
been used for these purposes.
NOTIFICATION
TO RESPONDENT OF ESTIMATED BURDEN Public
reporting burden for this collection of information is estimated to
average 60 minutes per response, including the time for reviewing
instructions, searching existing data sources, gathering and
maintaining the data needed, and completing and reviewing the
collection of information. An
agency may not conduct or sponsor, and a person is not required to
respond to, a collection of information unless it displays a
currently valid OMB control number.
Send comments regarding this burden estimate or any other aspect of
this collection of information, including suggestions for reducing
this burden to: NIH, Project Clearance Branch, 6705 Rockledge Drive,
MSC 7974, Bethesda, MD 20892-7974, ATTN: PRA (0925-0642). Do not
return the completed form to this address.
Introduction
Before we start, let me tell you about what we’re going to be doing today. My colleagues and I are working on redesigning how certain cancer information is provided on the Internet to individuals such as you. But before we do that we need a better understanding of who the users are and what they need. I’ll be asking you questions about what types of cancer information you would want, what you would be doing with that information, and how you would prefer to see it presented.
[Basic information:]
Why don’t we start with you telling me a little bit about what your job is?
Who do you work for?
What is your job role? What do you do?
Do you currently use cancer statistics in the work you do? If so, how often?
What specific statistics do you look for? [Probe to see if the data they seek is statistical in nature. Probe on what kind of questions they seek to answer or tasks that need to be accomplished; how they decide which data is appropriate for their question or task.]
How do you use them? [Probe on for themselves, for colleagues, or for patients.]
[If they DO use cancer statistics for work:]
Let’s discuss just cancer statistics.
Where do you get your cancer statistics?
(View samples if possible.)
What format is the best way for data to be presented for you? Do you easily find what you need?
[Probe on what the data will be used for. Ask if there is a need for cancer statistics to be presented in a summary format, or if details are needed. Probe about the level of sophistication needed--is something needed that might be understandable to the general public?]
Have you ever used any of the following SEER tools:
Cancer Facts Sheets
Cancer Statistics
Fast Stats
Cancer Query System
State Cancer Profiles
[SAMPLE OUTPUT SECTION, LISTED BELOW]
[If NO need for statistics for work:]
Do you think there is a situation in which you would ever want to look for cancer data for a purpose other than statistical analysis?
[Probe on whether they would ever print out data, use it on a presentation, give it to a patient, or send it to a colleague. Ask if they might ever use statistics for their own personal use. ]
Ok, now I’m going to show you some examples of various outputs of some cancer statistics and I’d like you to tell me what you think of them.
Survival
One statistic estimates the probability that a person will still be alive a certain number of years after being diagnosed with cancer. For example, approximately 65.7% of men between ages 60 and 64 when diagnosed with colorectal cancer are still alive 5 years later.
How do you describe this type of statistic? Do you know a specific name for it? [Probe: Survival rate, prognosis, probability]
Are you interested in this type of statistic? [If no, show the next statistic type. If yes, continue.]
If you were looking for this type of statistic, what specifically would you look for? [Probe on options like age, gender, etc.]
[Show SEER options for Survival]
There is a system I know of that has this data and you can get it using these options:
Age: 0-44 50 and Older All Ages
0-49 65 and Older
0-64 75 and Older
45-54
55-64
65-74
Sex: Male Female Both
Race: White
Black
Asian/Pacific Islander
American Indian/Alaska
Native
Hispanic
All
Cancer stage: Localized Regional Distant Unstaged
Survival term: 1-year
2-year
3-year
4-year
5-year
10-year
The year of the diagnosis: 1975-1977 1981-1983 1990-1992 2001-2007
1978-1980 1984-1986 1993-1995
1987-1989 1996-1998
Type of survival: Relative Overall
Which of these factors are of interest to you and why? Which factors seem unclear to you? What other factors would you be interested in that are not in this list? [Probe: Geographical location, trends in data, uncertainty data]
[If participant does not understand a certain term, provide additional information and discuss further:
Age: Explain that it is the age at diagnosis, discuss age
ranges, span of ages available
Race: Differentiation
between “race” and “ethnicity”
Cancer
stage: Explain the categories of cancer diagnosis stages, other
terms besides “stage,” alternative stage labeling outside
of the typical Localized/Regional/Distant classification, what
“unstaged” might imply
Length of survival term:
How long a survival term or what options would be useful to them
Year
of diagnosis: How far back is useful for them, how recent should
the data be
Type of survival: Explain the difference
between relative survival and overall survival, discuss other types
they may be interested in]
Sometimes cancer data is shown as an estimate of how data for the current year might look (as a projection). How would you use these data?
Here is an example of data output that you might generate on the SEER website.
Stage Distribution and 5-year
Relative Survival by Stage at Diagnosis for |
||
Stage at Diagnosis |
Stage |
5-year |
Localized (confined to primary site) |
39 |
90.1 |
Regional (spread to regional lymphnodes) |
37 |
69.2 |
Distant (cancer has metastasized) |
20 |
11.7 |
Unknown (unstaged) |
5 |
33.3 |
|
|
|
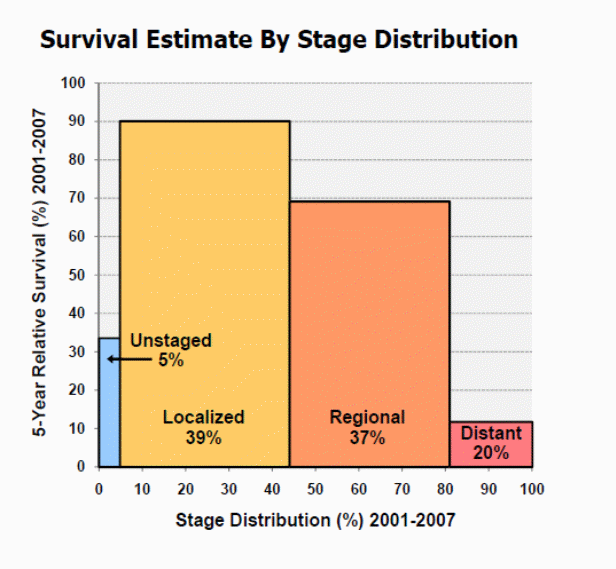
Is it clear what it’s trying to tell you? What specifically seems [clear/unclear] to you?
What do you like about it, and what don’t you like about it?
Do you like the table, the graphs, both or neither?
What would you change about the format, if anything?
If getting this information were easy to do, would any of it be useful to you?
Prevalence
Another statistic estimates the number of people in the US population who were alive on a specific date after having been diagnosed with cancer. For example, 168,326 men were alive on Jan. 1 2008 who had a prior diagnosis of lung or bronchus cancer.
How do you describe this type of statistic? Do you know a specific name for it? [Probe: Most common cancer, most prevalent cancer, most frequent cancer]
Are you interested in this type of statistic? [If no, show the next statistic type. If yes, continue.]
If you were looking for this type of statistic, what specifically would you look for? [Probe on options like age, gender, etc.]
[Show SEER options for Prevalence]
There is a system I know of that has this data and you can get it using these options:
Age: 1-4 45-49
5-10 50-54
11-14 55-59
15-19 60-64
20-24 65-69
25-29 70-74
30-34 75-79
35-39 80-84
40-44 85 and Older
Sex: Male Female Both
Race: White Black Asian/Pacific Islander Hispanic All
Format: Count Percentage
Type of prevalence: Limited duration Complete
Years since diagnosis: Less than 5 5-Less than 10 More than 33
Less than 18 10-Less than 20
Less than 33 20-Less than 25
25-Less than 30
Which of these factors are of interest to you and why? Which factors seem unclear to you? What other factors would you be interested in that are not in this list? [Probe: Geographical location, trends in data, uncertainty data]
[If participant does not understand a certain term, provide additional information and discuss further:
Age:
Explain that it is the age at diagnosis, discuss age ranges, span of
ages available
Race: Differentiation between “race”
and “ethnicity”
Format: Explain the
difference between the two formats. Does having a specific number of
individuals diagnosed with cancer, or a percentage of people
diagnosed with cancer more useful to you?
Type of prevalence:
Explain the difference between the two types of prevalence. Discuss
the range of years that would be useful to the participant.
Years
since diagnosis: How far back is useful for them, discuss ranges,
how recent should the data be]
Sometimes cancer data is shown as an estimate of how data for the current year might look (as a projection). How would you use these data?
Here is an example of data output that you might generate on the SEER website.
[Show output for prevalence]

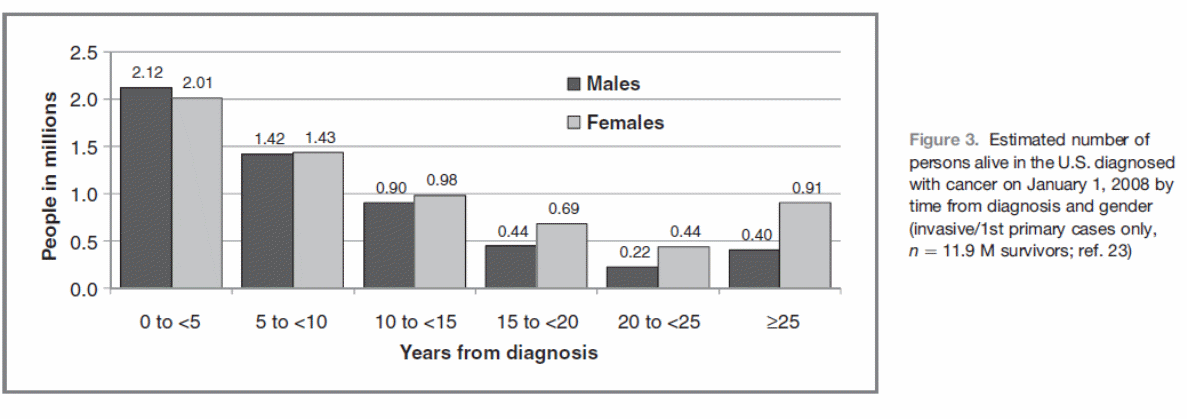
Is it clear what it’s trying to tell you? What specifically seems [clear/unclear] to you?
What do you like about it, and what don’t you like about it?
Do you like the table, the graphs, both or neither?
What would you change about the format, if anything?
If getting this information were easy to do, would any of it be useful to you?
Incidence
Another statistic estimates the number of new cases of cancer. For example, about 21,520 new stomach cancer cases are expected to be diagnosed in 2011.
How do you describe this type of statistic? Do you know a specific name for it? [Probe: Incidence, additional cases, new cases]
Are you interested in this type of statistic? [If no, show the next statistic type. If yes, continue.]
If you were looking for this type of statistic, what specifically would you look for? [Probe on options like age, gender, etc.]
[Show SEER options for Incidence]
There is a system I know of that has this data and you can get it using these options:
Age: 0-14 15-34 30-39 55-64 40 and Older
0-19 15-44 35-44 60-69 50 and Older
0-39
20-29 40-49 65-74 60 and Older
0-49 20-44 45-54 70-79 65 and Older
0-54 20-54 50-59 75-84 75 and Older
0-64 80 and Older
Sex: Male Female Both
Race: White Total Hispanic
Black White Hispanic
Asian/Pacific Islander White Non-Hispanic
American Indian/Alaska Native All
Geographic location: San Francisco
Connecticut
Detroit
Hawaii
Iowa
New
Mexico
Seattle
Utah
Atlanta
Population: 2000 U.S.
1970 U.S.
World
1991 Canadian
1996 Canadian
European
Year of diagnosis: Each single year from 1973 to 2008
1973-2008 1990-2008 2000-2008
1975-2008 1992-2008 2004-2008
1999-2008
Which of these factors are of interest to you and why? Which factors seem unclear to you? What other factors would you be interested in that are not in this list? [Probe: Trends in data, uncertainty data, understanding of age adjusted rates]
[If participant does not understand a certain term, provide additional information and discuss further:
Age: Explain that it is the age at diagnosis. Discuss age
ranges and/or span of ages available.
Race:
Differentiation between “race” and
“ethnicity.”
Geographic location: Explain
that the data was only collected in these areas. Discuss the fact
that locations include cities, regions and states. [Probe: is this a
limitation that affects the participant’s understanding of this
data?]
Population: Explain the comparison to different
populations and how that affects the incidence rate. [Probe: are the
population options relevant to the participant?]
Year of
diagnosis: Discuss ranges and length of time necessary for data
to be useful. [Probe: How recent should the data be?]
Sometimes cancer data is shown as an estimate of how data for the current year might look (as a projection). How would you use these data?
Here is an example of data output that you might generate on the SEER website.
[Show output for incidence]
Trends in Rates
Trends in rates can be described in many ways. Trends over a fixed period of time can be evaluated by the annual percentage change (APC). If the number is negative, the trend is a decrease; otherwise it is an increase. An asterisk after the number indicates the trend was significant--that one believes with a certain level of confidence (usually 95%) that the increase or decrease is beyond chance. If the trend is not significant, the trend is usually reported as stable or level. Joinpoint analyses can be used over a long period of time to evaluate when changes in the trend have occurred. The APC then shows how much the trend has changed between each of the joinpoints.
The joinpoint trend in SEER cancer incidence with associated APC(%) for cancer of the stomach between 1975-2008, All Races |
|||||
Male and Female |
Male |
Female |
|||
Trend |
Period |
Trend |
Period |
Trend |
Period |
-1.6* |
1975-2008 |
-1.2* |
1975-1988 |
-1.6* |
1975-2008 |
|
|
-2.0* |
1988-2008 |
|
|
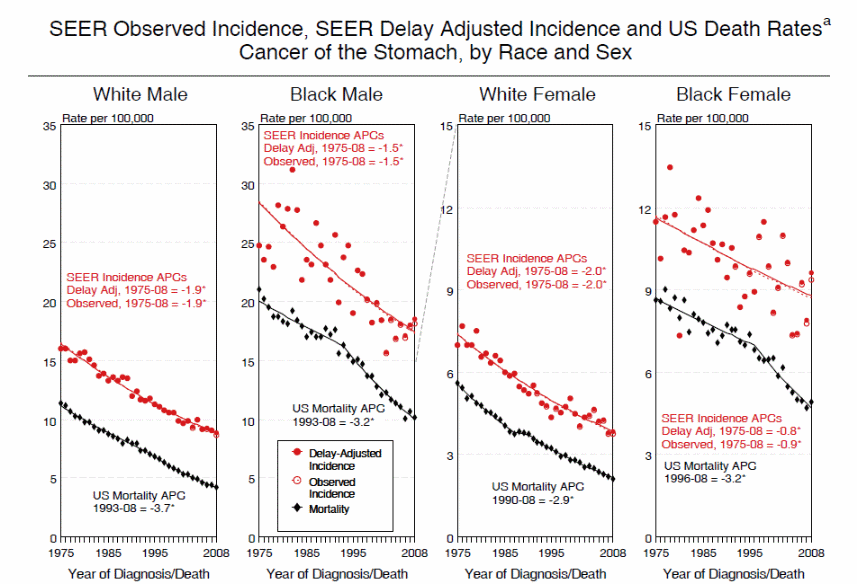
Is it clear what it’s trying to tell you? What specifically seems [clear/unclear] to you [Probe: Joinpoint understanding]?
What do you like about it, and what don’t you like about it?
Do you like the table, the graphs, both, or neither?
What would you change about the format, if anything?
If getting this information were easy to do, would any of it be useful to you?
Mortality
Another statistic estimates the number of people who will die from cancer in a given year. For example, in 2011, about 571,950 Americans are expected to die of cancer.
How do you describe this type of statistic? Do you know a specific name for it? [Probe: Death rate, death count, cancer patients who did not survive]
Are you interested in this type of statistic? [If no, show the next statistic type. If yes, continue.]
If you were looking for this type of statistic, what specifically would you look for? [Probe on options like age, gender, rate vs. count, rate per 100,000 vs. percent etc.]
[Show SEER options for Mortality]
There is a system I know of that has this data and you can get it using these options:
Age: 0-14 15-34 30-39 55-64 40 and Older
0-19 15-44 35-44 60-69 50 and Older
0-39
20-29 40-49 65-74 60 and Older
0-49 20-44 45-54 70-79 65 and Older
0-54 20-54 50-59 75-84 75 and Older
0-64 80 and Older
Sex: Male Female Both
Race: White Total Hispanic
Black White Hispanic
Asian/Pacific Islander White Non-Hispanic
American
Indian/Alaska Native All
Population: 2000 U.S.
1970 U.S.
World
1991 Canadian
1996 Canadian
European
Cause of death: All causes of death
All malignant cancers
A specific type of cancer
Year of death: Each single year from 1969 to 2008
1969-2008 1975-2008 1989-2008 1999-2008 2000-2008
1969-1978 1975-1998 1989-1999 2004-2008
1975-1998
1979-1998
Which of these factors are of interest to you and why? Which factors seem unclear to you? What other factors would you be interested in that are not in this list? [Probe: Geographical location, trends in data, uncertainty data]
[If participant does not understand a certain term, provide additional information and discuss further:
Age: Explain that it is the age at diagnosis, discuss age
ranges, span of ages available
Race: Differentiation
between “race” and “ethnicity”
Population:
Explain the comparison to different populations and how that affects
the incidence rate, are these options relevant to the
participant?
Cause of death: Explain “malignant
cancers,” Are these distinctions useful for the
participant?
Year of death: How far back is useful for
them, discuss ranges, how recent should the data be]
Sometimes cancer data is shown as an estimate of how data for the current year might look (as a projection). How would you use these data?
Here is an example of data output that you might generate on the SEER website.
[Show output for mortality]
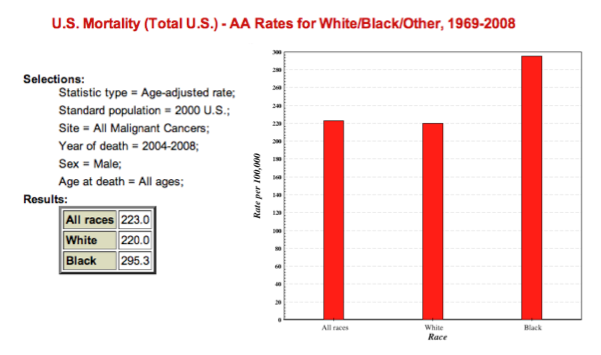
Is it clear what it’s trying to tell you? What specifically seems [clear/unclear] to you?
What do you like about it, and what don’t you like about it?
Do you like the table, the graphs, both, or neither?
Would you prefer to see the data as a percent or out of 100,000 people?
What would you change about the format, if anything?
If getting this information were easy to do, would any of it be useful to you?
Risk
Here is another statistic for you to consider:
Risk of developing stomach cancer over an entire lifespan in 2005-2007:
Approximately 0.88%
Are you interested in this type of statistic? [If no, wrap up the interview. If yes, continue.]
If you were looking for this type of statistic, what specifically would you look for? [Probe on options like age, gender, etc.]
[Show SEER options for Risk]
There is a system I know of that has this data and you can get it using these options:
Starting age: 0 40 80
5 45 85
10 50 90
15 55 95
20 60
25 65
30 70
35 75
Ending age: 5 45 85
10 50 90
15 55 95
20 60 95 and Older
25 65
30 70
35 75
40 80
Sex: Male Female Both
Race: White Total Hispanic
Black White Hispanic
Asian/Pacific Islander White Non-Hispanic
American Indian/Alaska Native All
Risk type: Developing cancer
Dying from cancer
Year of diagnosis: 2005-2007
2003-2005
2000-2002
Which of these factors are of interest to you and why? Which factors seem unclear to you? What other factors would you be interested in that are not in this list? [Probe: Geographical location, trends in data, uncertainty data]
Sometimes cancer data is shown as an estimate of how data for the current year might look (as a projection). How would you use these data?
Here is an example of data output that you might generate on the SEER website.
[Show output for risk]
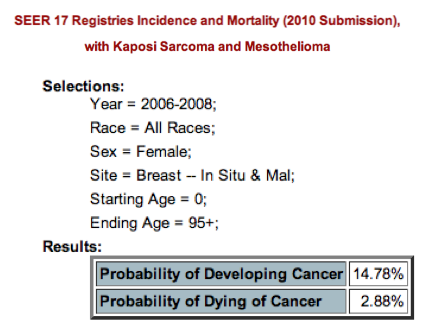
Is it clear what it’s trying to tell you? What specifically seems [clear/unclear] to you?
What do you like about it, and what don’t you like about it?
Do you like table format?
3. What would you change about the format, if anything?
| File Type | application/vnd.openxmlformats-officedocument.wordprocessingml.document |
| Author | Danielle Smith |
| File Modified | 0000-00-00 |
| File Created | 2021-01-31 |
© 2026 OMB.report | Privacy Policy