New Teacher Bias Analysis
New teacher bias analysis appendix_100509.doc
Beginning Teacher Longitudinal Study (BTLS) 2009-2012
New Teacher Bias Analysis
OMB: 1850-0868
A-
Appendix A. New Teacher Bias Analysis in the 2007-08 Schools and Staffing Survey
Executive Summary…………….………………………………………………………... |
A-2 |
Findings………...……………………………………………………................... |
A-2 |
Recommendations …………………...………………………………………….. |
A-2 |
Background………………………………………………………………………………. |
A-4 |
Overview of SASS teacher sampling……………………………………………. |
A-4 |
Methodology……………………………………………………………………………... |
A-4 |
School nonresponse to the Teacher Listing Form……………....……………….. |
A-5 |
Teacher nonresponse to SASS…………………………………………………… |
A-6 |
New teacher nonresponse to SASS……………………………………………… |
A-7 |
Response Rates…………………………………………………………………………... |
A-7 |
Detailed Findings………………………………………………………………………… |
A-10 |
TLF………………………………………………………………………………. |
A-10 |
SASS public school teachers…………………………………………………….. |
A-12 |
New SASS public school teachers……………………………………………….. |
A-14 |
Description of State-Level Bias Tables………………………………………………….. |
A-17 |
Attachment 1: Basic-Weighted TLF State-Level Nonresponse Bias Tables……………. |
A-19 |
Attachment 2: Adjusted-Weighted TLF State-Level Nonresponse Bias Tables………… |
A-35 |
Attachment 3: Basic-Weighted SASS Public School Teacher State-Level Nonresponse Bias Tables…………………..……………………………. |
A-51 |
Attachment 4: Final-Weighted SASS Public School Teacher State-Level Nonresponse Bias Tables………………….…………………………….. |
A-98 |
Attachment 5: Basic-Weighted New SASS Public School Teacher State-Level Nonresponse Bias Tables………………………………………………… |
A-145 |
Attachment 6: Final-Weighted New SASS Public School Teacher State-Level Nonresponse Bias Tables………………………………………………… |
A-190 |
Executive Summary
This appendix addresses concerns regarding potential nonresponse bias among beginning (first-year) teachers. Because the Beginning Teacher Longitudinal Study (BTLS) cohort consists of all responding first-year public school teachers in the 2007-08 Schools and Staffing Survey (SASS), if beginning public school teachers respond at lower rates than all public school teachers and their responses differ from nonrespondents, then survey variables of interest could be biased in SASS. Potentially, this bias could be perpetuated and exacerbated in BTLS. To evaluate the potential for nonresponse bias, ESSI conducted an analysis on public school teachers with 1 to 3 years of experience (new teachers) in the 2007-08 SASS. The Teacher Listing Form (TLF) is used in this new teacher nonresponse bias analysis to provide information on both responding and nonresponding teachers. Because the TLF does not collect data on first-year teachers, a broader range of experience (1-3 years) was used to define a new teacher.
Findings
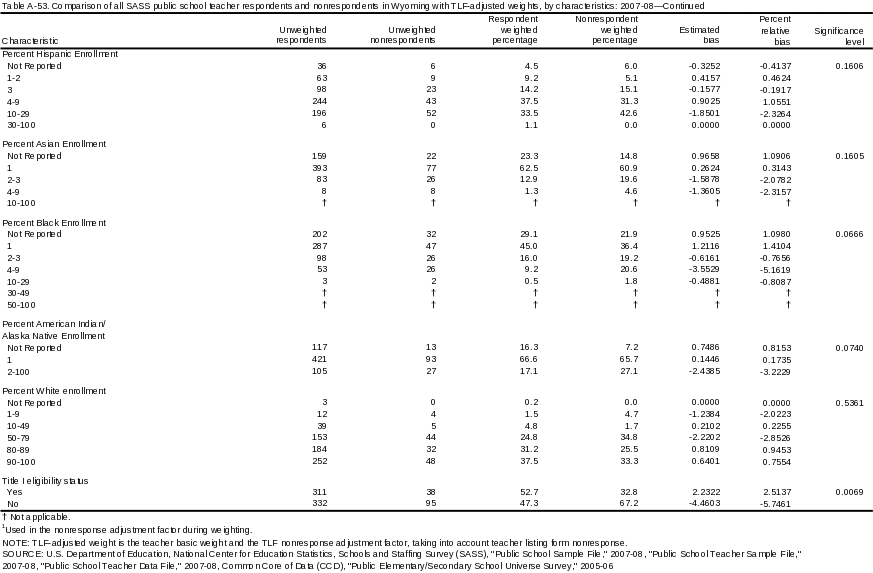
The Teacher Listing Form nonresponse bias analysis found that the nonresponse adjustment reduced the effects of school nonresponse for SASS public school teachers. Of 15 states analyzed, all but one state had no significant differences in the distributions of schools between the respondent and sample populations after the nonresponse adjustment was applied. Therefore, school nonresponse to the Teacher Listing Form did not significantly add to teacher nonresponse.
Based on the teacher analysis, nonresponse bias is largely offset after nonresponse adjustments for all SASS public school teachers. Of 23 analyzed, several states have significant differences in the distributions between the respondent and sample populations, but this did not result in high nonresponse bias. This finding supports the initial nonresponse bias analysis completed by the Census Bureau, which used a different methodology to analyze nonresponse bias.
NCES also finds that nonresponse bias is not a concern for new SASS public school teacher respondents. However, for the subset of 19 states for which both teacher populations (all and new teachers) were analyzed, the mean and median percent relative bias values were larger for new public school teachers compared to all public school teachers. In 11 states, new teachers had higher proportions of characteristics that were significantly different between the respondent and sample populations, though 8 states had lower proportions compared to all public school teachers. While these values are not sufficiently high to raise concern for SASS, they point to a potential pattern of higher nonresponse bias among the BTLS cohort. The levels of nonresponse bias showed a pattern of higher nonresponse bias among responding teachers with 1 to 3 years of experience than for the teacher respondent population as a whole.
Recommendations
ESSI recommends the following actions during future data collection and processing:
NCES should continue to monitor and boost response rates for the beginning teacher cohort during data collection. While the 2008-09 TFS data collection cycle has closed, NCES carefully monitored the response rates of this cohort to remove all obstacles to completing the interview. For example, Census conducted additional efforts to find e-mail addresses for nonresponding teachers to the survey instrument, NCES staff sent handwritten letters along with paper instruments to encourage participation, and Census prioritized the cohort for telephone follow-up.
Using the same methodology as employed in this analysis, NCES should revise the nonresponse bias analysis methodology for subsequent survey collections in order to quantify potential bias.
Findings from the bias analysis should be employed to inform and evaluate the weighting process, which adjusts for nonresponse. While nonresponse bias cannot be completely removed through adjustments factors, the weights can be constructed to reduce potential bias.
NCES should consider an empirical approach to identifying the characteristics of nonresponse in order to calculate precise noninterview weighting adjustments. Previous survey collections of SASS and TFS have used an “analytical judgment” model to define patterns of response among teachers. ESSI is currently testing alternative approaches, such as Chi-Square Automatic Interaction Detection (CHAID) analysis, to empirically calculate weighting adjustments based on the best predictors of response.
NCES should repeat a similar bias analysis on the beginning teacher cohort in the 2008-09 Teacher Follow-up Survey. Data for shared characteristics of respondents and nonrespondents are available in the 2007-08 SASS.
Background
Overview of SASS teacher sampling
Teachers are selected for SASS through a two-stage sampling process. The school was sampled first, and then teachers were sampled from schools. To build a teacher sampling frame, all sampled schools were mailed the Teacher Listing Form (TLF) to obtain a list of K-12 teachers who met the SASS definition of a teacher in each school as well as information about each teacher’s main subject(s) taught, full-time or part-time status, experience level in years, and whether or not the teacher was expected to be teaching in the school the following year. From the subsequent list, teachers were sampled for SASS.
Because of the two-stage process, nonresponse bias could be introduced in either survey stage. If a school did not respond to the TLF, then no teachers from that school were sampled. As a result, weighting adjustments were calculated and applied to the sampling weights to correct for school nonresponse to the TLF and teacher nonresponse to the SASS Teacher Questionnaire. Any analysis of potential nonresponse bias should take into account both stages of sampling and evaluate the efficacy of adjustment factors applied to mitigate potential nonresponse bias. The following section outlines the methodology used to conduct this analysis.
Methodology
As outlined in appendix B of the Statistical Standards, the degree of nonresponse bias is a function of two factors: the nonresponse rate and how much the respondents and nonrespondents differ on survey variables of interest. The mathematical formulation to estimate bias for a sample mean is:
![]()
where
![]() is the estimated bias,
is the estimated bias,
![]() is the base-weighted unit nonresponse rate,
is the base-weighted unit nonresponse rate,
![]() is the base-weighted estimated mean based on the respondents, and
is the base-weighted estimated mean based on the respondents, and
![]() is the base-weighted estimated mean based on the nonrespondents.
is the base-weighted estimated mean based on the nonrespondents.
In order to provide a measure of magnitude, the relative bias of each variable was determined using the following formula:
Rel
![]()
where
Rel
![]() is the relative bias with respect to the estimate,
is the relative bias with respect to the estimate,
![]() .
.
In
other words, shared characteristics are compared between respondents
and nonrespondents in order to determine the extent to which the two
populations differ. The estimate of bias,
![]() ,
is derived by calculating the mean of a selected characteristic for
respondents and nonrespondents, and then multiplying the difference
of these means by the base-weighted nonresponse rate. The relative
bias, Rel
,
is derived by calculating the mean of a selected characteristic for
respondents and nonrespondents, and then multiplying the difference
of these means by the base-weighted nonresponse rate. The relative
bias, Rel
![]() ,
is calculated by dividing the estimated bias by the base-weighted
mean of the respondents.
,
is calculated by dividing the estimated bias by the base-weighted
mean of the respondents.
Similar comparisons are made using the final weight to evaluate the effect of the teacher nonresponse adjustment factors. However, instead of comparing respondents and nonrespondents, shared characteristics of respondents are compared to the original sample to estimate the effect of weighting. Schools and teachers that were deemed to be out-of-scope after data collection began were excluded from this analysis. Therefore, the original sample populations were slightly larger than those used for this analysis.
Finally, a chi-square test is used to compare the distribution of the characteristic variable between the respondent and nonrespondent populations. For the teacher bias analysis, this test was structured to control for teacher selection by school. The significance level for each variable is reported in the state-level bias tables (attached). Statistical significance is defined as any p-value of 0.05 or less.
The analysis is presented in the follow order: school nonresponse to the TLF, teacher nonresponse to SASS, and new teacher nonresponse to SASS. Because the BTLS was designed to follow a cohort of public school teachers, this analysis was limited to SASS public school teachers only. Private and Bureau of Indian Education-funded schools are not included.
School nonresponse to the Teacher Listing Form
For the TLF nonresponse bias analysis, respondents and nonrespondents were compared by computing the estimated and relative bias using the school base weight. Then, in order to show any mitigating effects of weighting on school nonresponse bias, the estimated and relative bias were computed by comparing the TLF-adjusted respondents to the base-weighted school sample.
Table 1 presents the characteristics used to compare school respondents and nonrespondents or respondents and sample populations to the TLF. This analysis is conducted only in those states with less than an 85 percent response rate to the TLF.
-
Table 1. Variables compared for TLF respondents and nonrespondents or respondents and the school sample population
Characteristic
Source
School characteristics (for TLF and Teacher analysis)
Charter status
SASS School sampling frame
Grade level of school1
SASS School sampling frame
Percent of K-12 students approved for free/reduced-priced lunch
SASS School sampling frame
School enrollment1
SASS School sampling frame
School urbanicity1
SASS School sampling frame
Magnet status
SASS School sampling frame
Percent of students by race/ethnicity
SASS School sampling frame
Title I eligibility status
SASS School sampling frame
1Used in the nonresponse adjustment factor during weighting.
Teacher nonresponse to SASS
For the teacher nonresponse bias analysis, the estimated and relative bias were calculated for each state with a nonresponse rate less than 85 percent using the TLF-adjusted weight, which takes into account TLF nonresponse by schools. Then, in order to evaluate the effect of weighting, the final-weighted respondents were compared to the TLF-adjusted teacher population.
Table 2 contains a list of all characteristics used to measure potential nonresponse bias.
-
Table 2. Variables compared for SASS respondents and the teacher sample population
Characteristic
Source
Teaching characteristics
Teacher main subject (8 possible subject choices)1
Teacher Listing Form
Full-time/part-time status
Teacher Listing Form
Teaching experience at current school1
Teacher Listing Form
School characteristics
Charter status
SASS School sampling frame
Grade level of school1
SASS School sampling frame
Charter status
SASS School sampling frame
Grade level of school1
SASS School sampling frame
Percent of K-12 students approved for free/reduced-priced lunch
SASS School sampling frame
School enrollment1
SASS School sampling frame
School urbanicity1
SASS School sampling frame
Magnet status
SASS School sampling frame
Percent of students by race/ethnicity
SASS School sampling frame
Title I eligibility status
SASS School sampling frame
1Used in the nonresponse adjustment factor during weighting.
New teacher nonresponse to SASS
The same teacher analysis was repeated for new teachers, defined as those with 1-3 years of experience. While the BTLS cohort consists of teachers in the first year of teaching, the TLF instrument required schools to indicate if the teacher had 1 to 3 years, 4 to 9 years, or 10 or more years of experience. Because the TLF only collected aggregate experience categories larger than the BTLS definition of a beginning teacher, the new teacher nonresponse bias analysis is an approximation of nonresponse bias for the BTLS cohort. It assumes that patterns of nonresponse are similar for teachers with 1 year of experience and teachers with between 1and 3 years of experience.
Response Rates
Table 3 shows the response rates for the TLF and SASS public school teachers by years of experience and by state. Among sampled public schools, 86 percent of schools responded to the TLF. Among all public school teachers and new public school teachers, about 84 percent responded to the SASS teacher questionnaire. Fifteen states, with a TLF response rate less than 85 percent, were included in the TLF nonresponse bias analysis. Twenty-three states, with a teacher response rate less than 85 percent, were included in the nonresponse bias analysis for public school teachers. Twenty-two states, with a new teacher response rate less than 85 percent, were included in the bias analysis for new teachers. A subset of 19 states had response rates less than 85 percent among both teacher populations (all and new teachers).
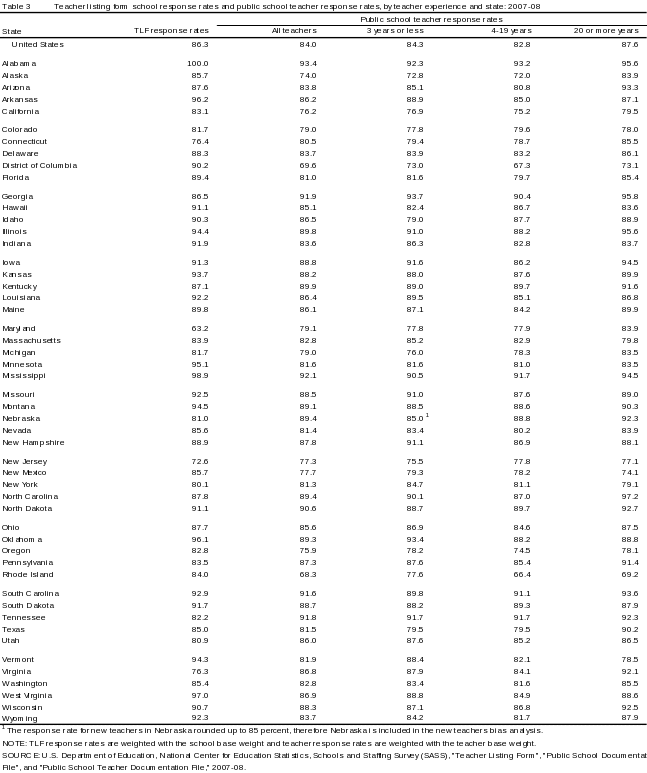
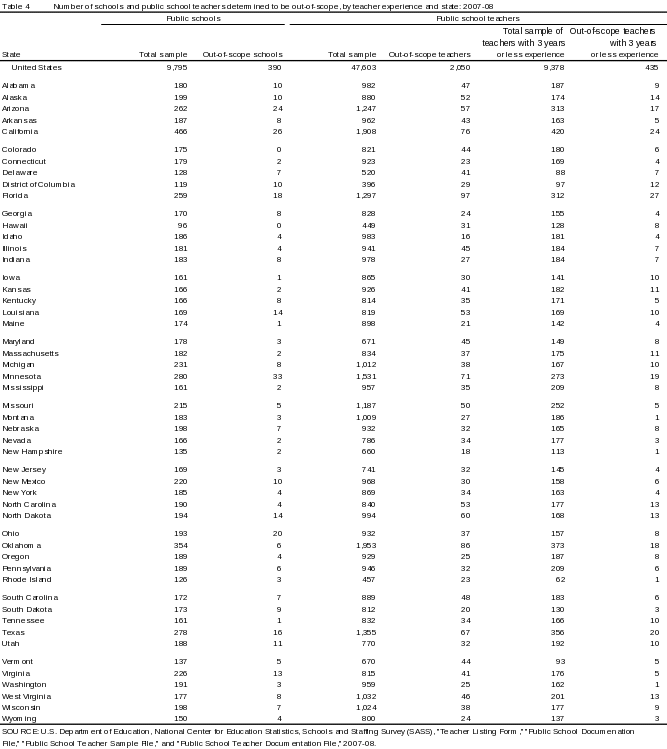
Table 4 shows the total sample and number of out-of-scope cases for public schools, public school teachers, and public school teachers with 3 years or less experience. Out-of-scope schools and teachers were excluded from the nonresponse bias analysis for this report.
Detailed Findings
Teacher Listing Form
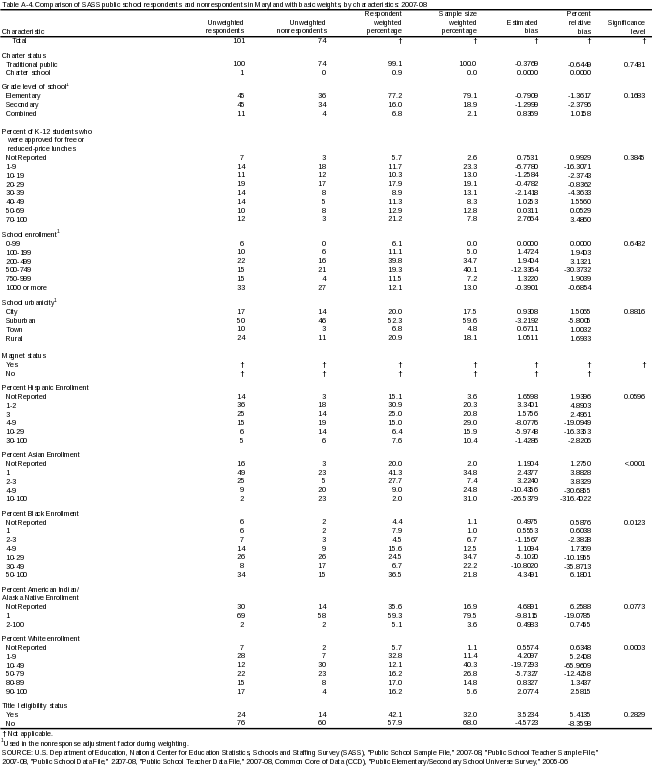
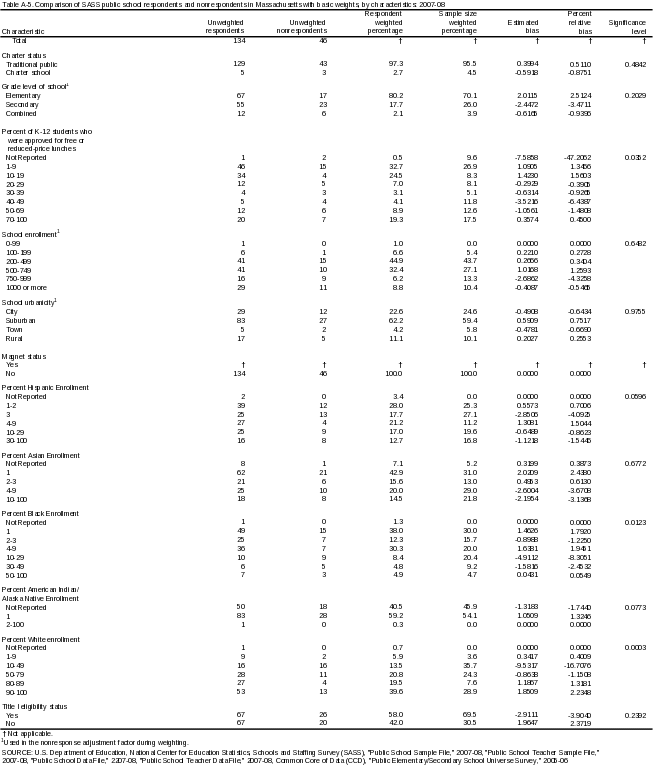
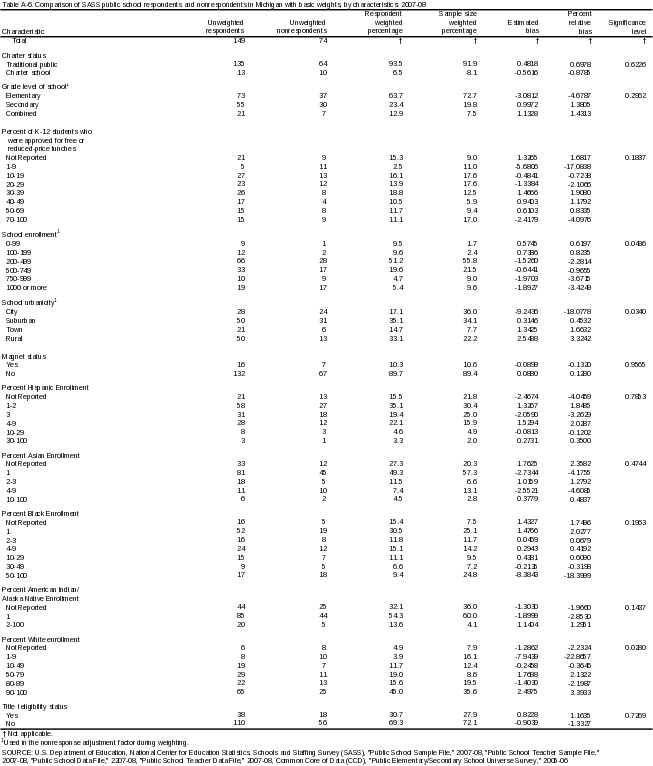
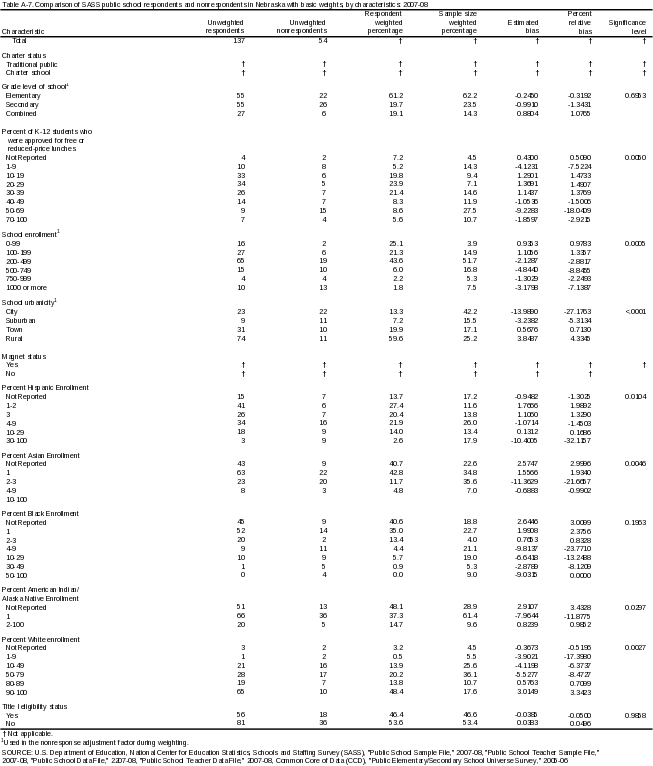
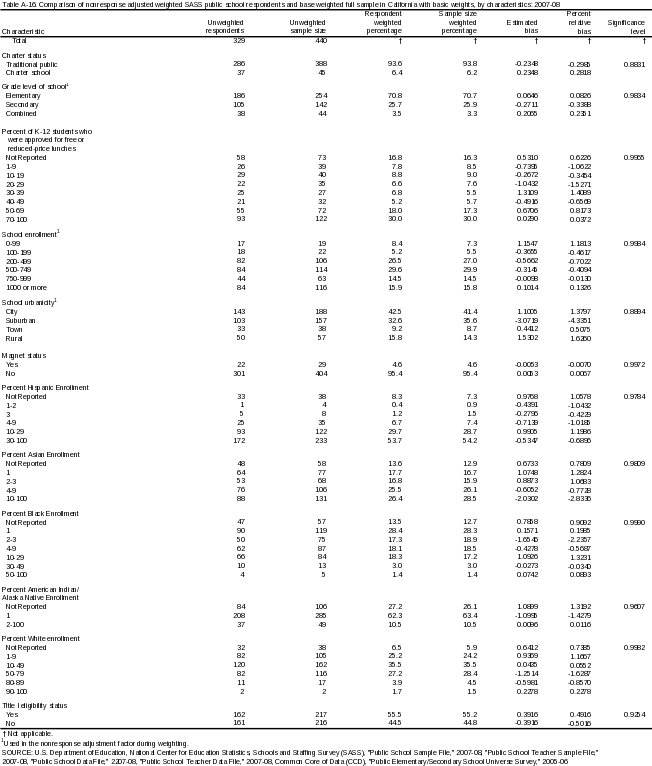
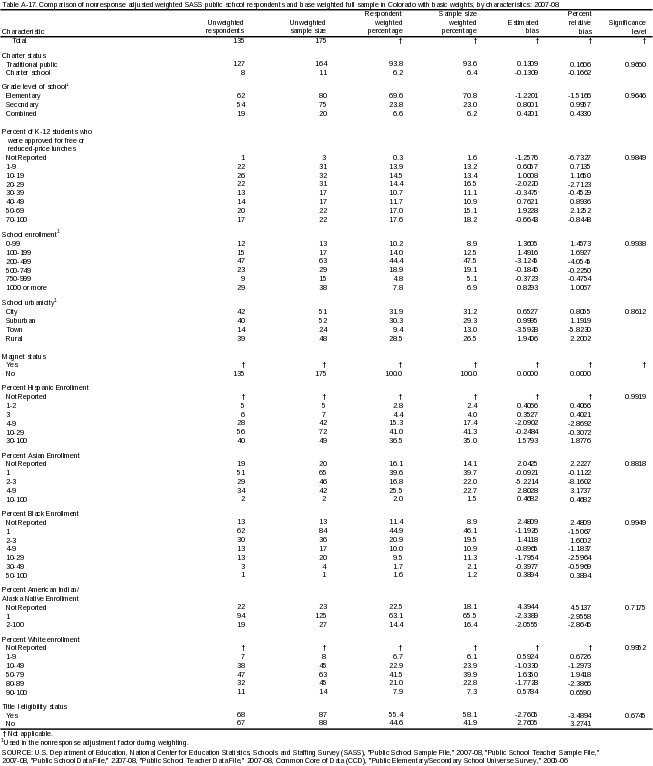
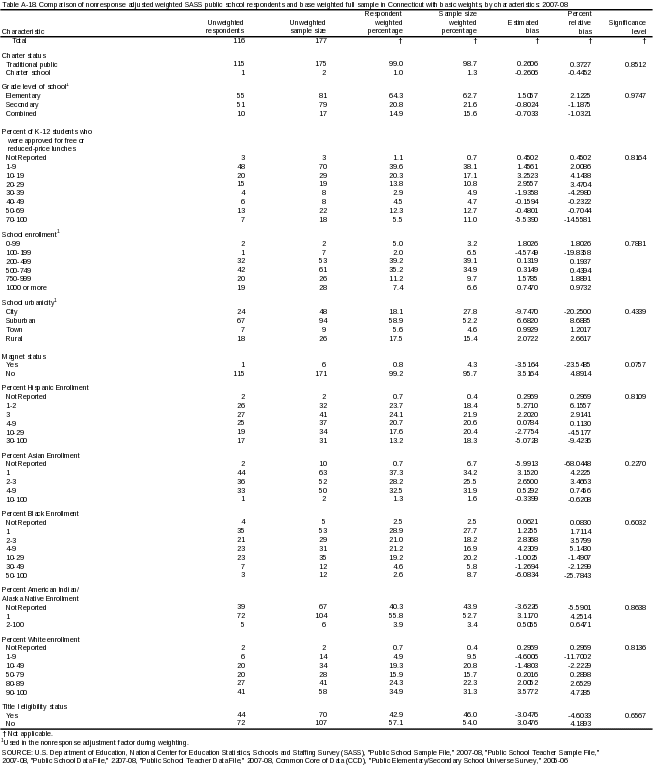
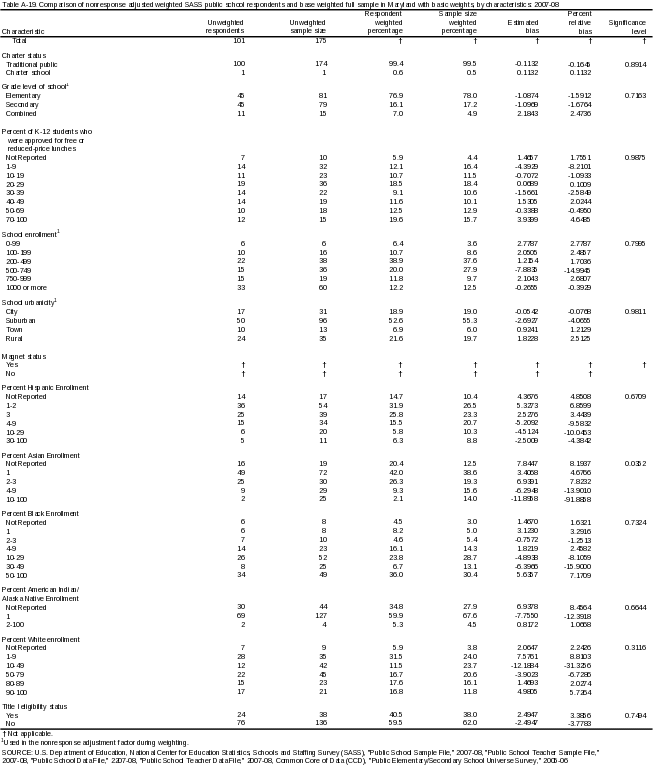
Table 5 contains a summary of estimated and relative bias for all public schools in states with response rates below 85 percent. Detailed state tables can be found in attachments 1 and 2. Table 5 reports (1) the average and median of the percent relative bias for each state and (2) the percentage of all applicable characteristic variables that were significantly different between the respondent and either the nonrespondent or the sampled populations for each state. These summary statistics are reported before and after the nonresponse weighting adjustment in order to quantify the effects of the adjustment factor in mitigating school TLF nonresponse bias.
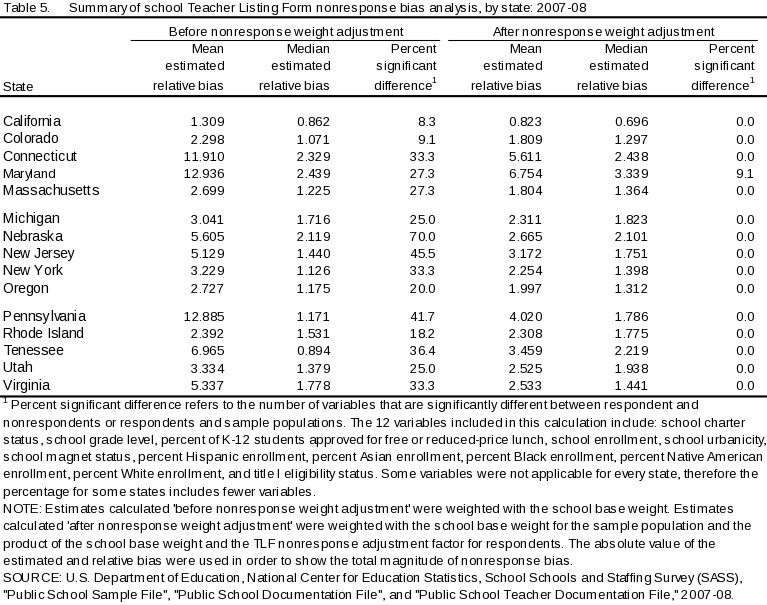
There is a high level of nonresponse bias among states with less than an 85 percent response rate before the nonresponse weight adjustment. Maryland had the highest mean (12.936) and median (2.439) relative bias, while Nebraska had the highest percent of characteristics significantly different between the respondent and nonrespondent distributions (70.0). After the TLF nonresponse adjustment factor was applied, Maryland again had the largest mean (6.754) and median (3.339) relative bias. Maryland was also the only state with any characteristics that were significantly different between the respondent and sample populations (9.1).
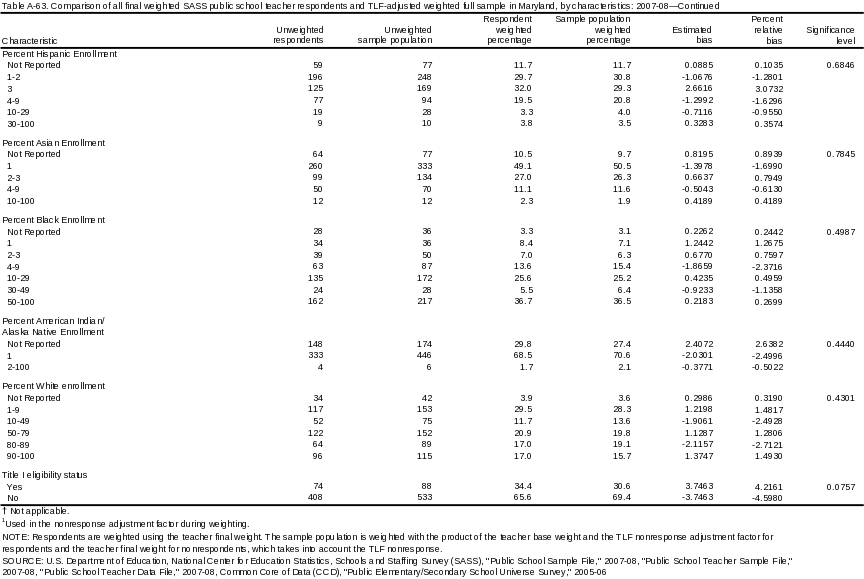
The final-weighted state table for Maryland (described at the end of this appendix) shows that there are eighteen characteristics with significant (+/- 5) percent relative bias. There was significant TLF nonresponse bias for schools with the following characteristics:
1-9 percent of K-12 students approved for free or reduced-price lunch (-8.2101),
500-749 students (-14.9945),
1-2 percent Hispanic enrollment (6.8599),
4-9 percent Hispanic enrollment (-9.5832),
10-29 percent Hispanic enrollment (-10.0463),
did not report Asian enrollment (8.1937),
2-3 percent Asian enrollment (7.8232),
4-9 percent Asian enrollment (-13.9010),
10-100 percent Asian enrollment (-91.8858),
10-29 percent Black enrollment (-8.1059),
30-49 percent Black enrollment (-15.9000),
50-100 percent Black enrollment (7.1709),
did not report American Indian/Alaska Native enrollment (8.4564),
1 percent American Indian/Alaska Native enrollment (-12.3918),
1-9 percent White enrollment (8.8103),
10-49 percent White enrollment (-31.3256),
50-79 percent White enrollment (-6.7286), and
90-100 percent White enrollment (5.7264).
Percent Asian enrollment was the only characteristic listed above with an overall distribution that was significantly different between the respondent and sample populations (p = 0.0352). No other characteristics in Maryland were significantly different. Thus, although high nonresponse bias did exist for the characteristics listed above, these did not translate into significant differences between the overall distributions of the respondent and sample populations, except for percent Asian enrollment.
Nationally, before the nonresponse adjustment was applied, significant nonresponse bias was found in schools with 40-100 percent of K-12 students approved for free or reduced-price lunch, city schools, schools with 4-100 percent Hispanic enrollment, schools with 4-100 percent Asian enrollment, schools with 10-100 percent Black enrollment, schools with 1-100 percent American Indian/Alaska Native enrollment, and schools with 1-49 percent White enrollment. Most, but not all states exhibited these patterns.
After the nonresponse adjustment was applied these patterns were reduced in all states and eliminated in some states. Five states still had significant bias in schools with 40-100 percent of K-12 students approved for free or reduced-price lunch, seven states had significant bias in city schools, 13 states had significant bias in schools with 4-100 percent Hispanic enrollment, 4-100 percent Asian enrollment, 10-100 percent Black enrollment, or 1-100 percent American Indian/Alaska Native enrollment, and eight schools had significant bias in schools with 1-49 percent White enrollment. The mean relative bias decreased after the nonresponse adjustment in all states. The nonresponse adjustment eliminated significant differences between the respondent and sample populations for every state except Maryland. Thus, the nonresponse adjustment reduced the effect on nonresponse bias for SASS public schools with regard to the Teacher Listing Form.
SASS Public School Teachers
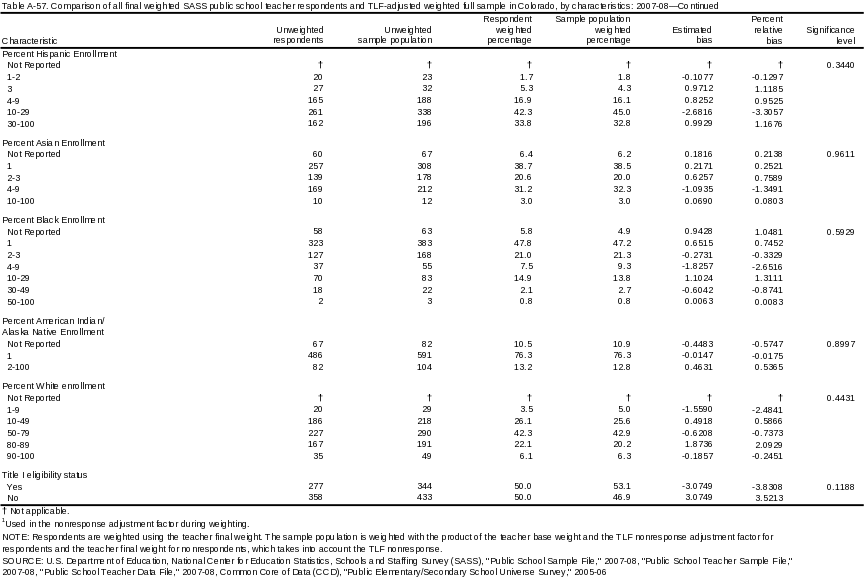
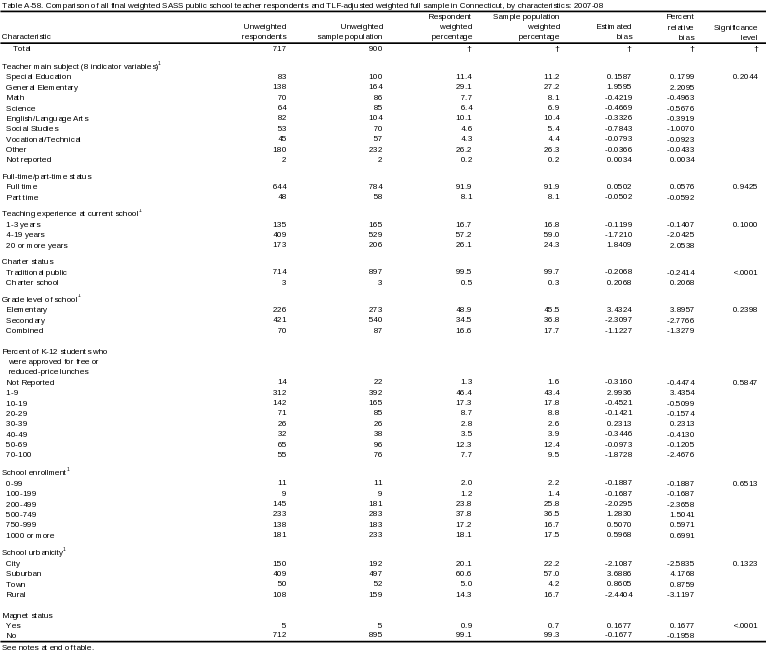
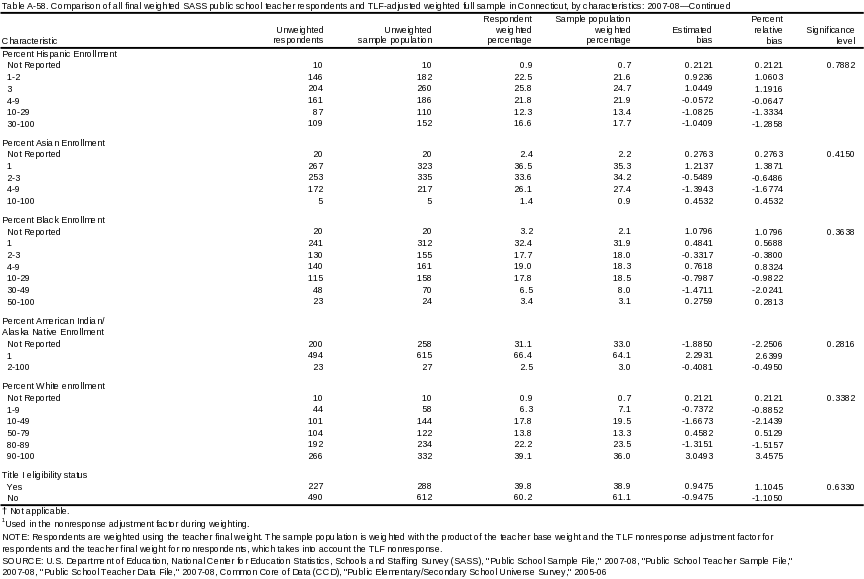
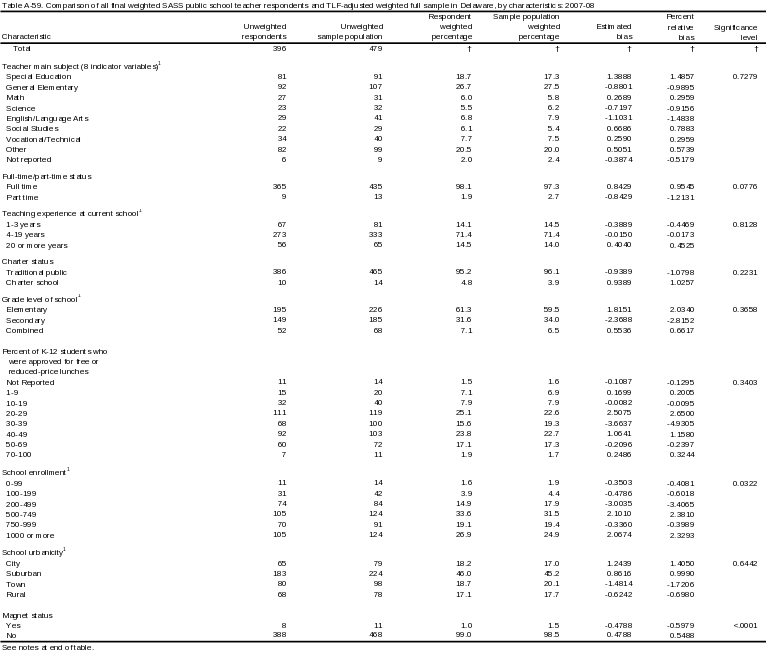
Table 6 contains a summary of estimated and relative bias for all public school teachers in states with response rates below 85 percent. Detailed state tables can be found in attachments 3 and 4. Table 6 reports (1) the average and median of the percent relative bias for each state and (2) the percentage of all applicable characteristic variables that were significantly different between the respondent and either the nonrespondent or the sample populations for each state. These summary statistics are reported before and after the final weighting adjustments in order to quantify the effects of final weights in mitigating teacher nonresponse bias.
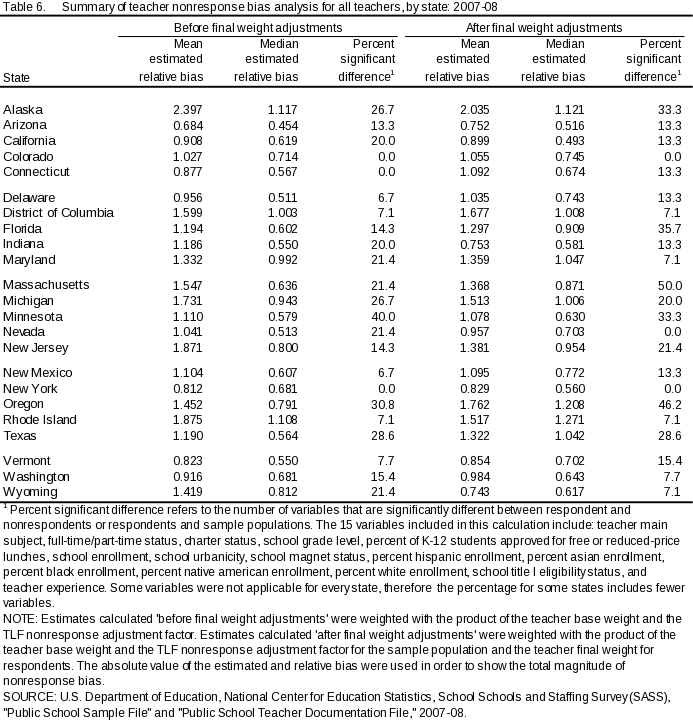
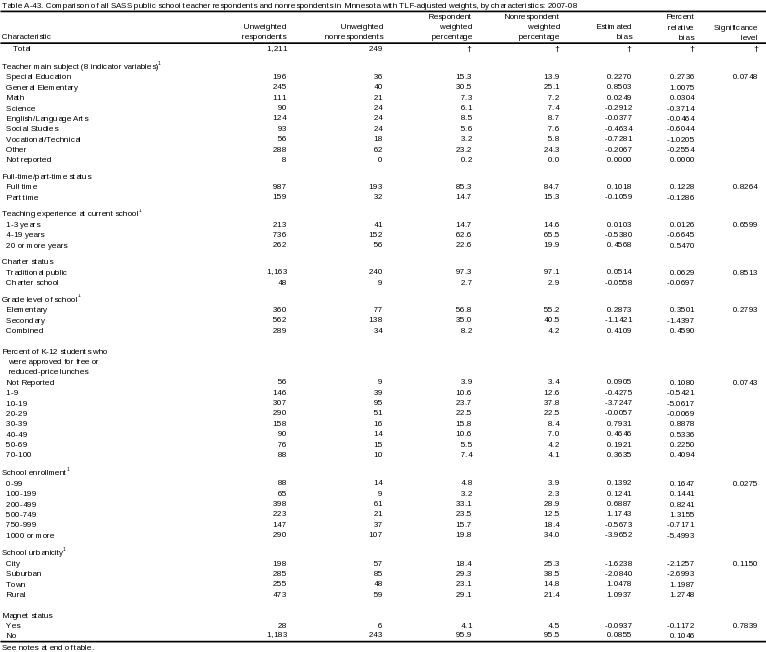
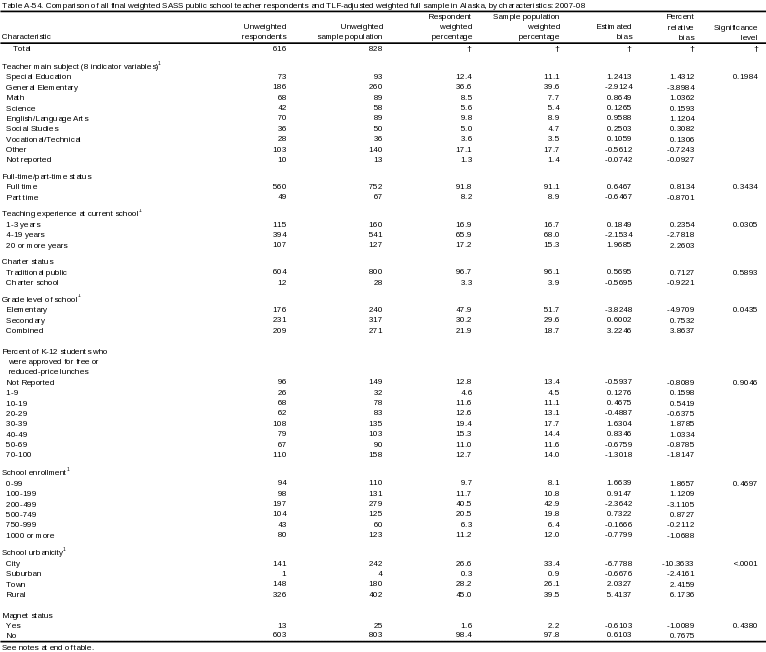
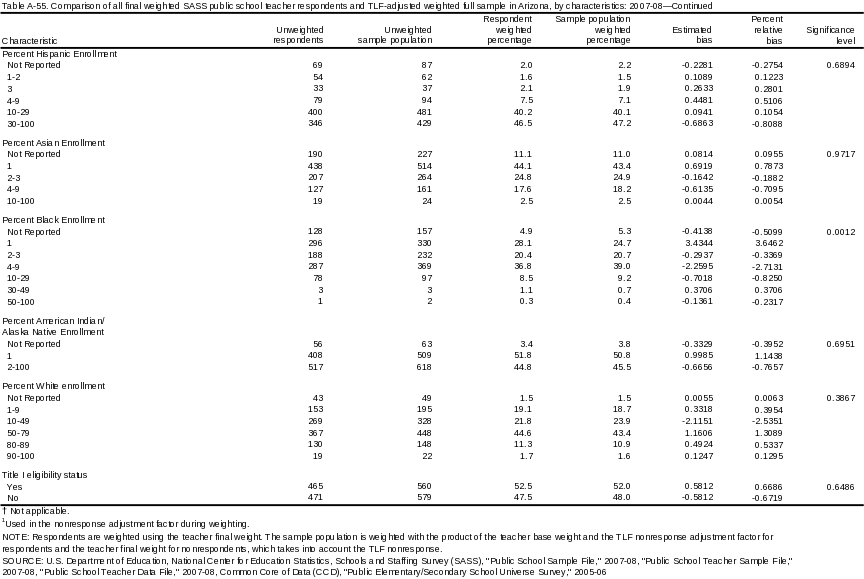
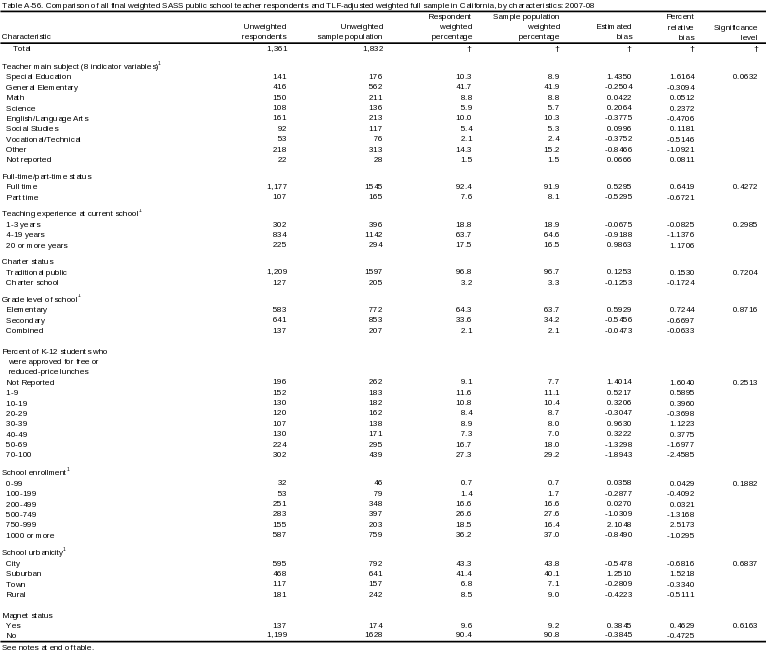
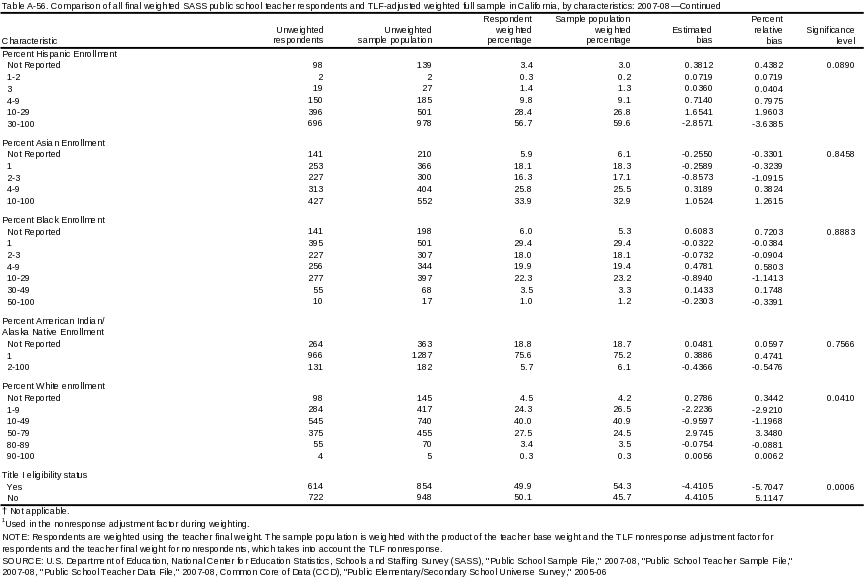
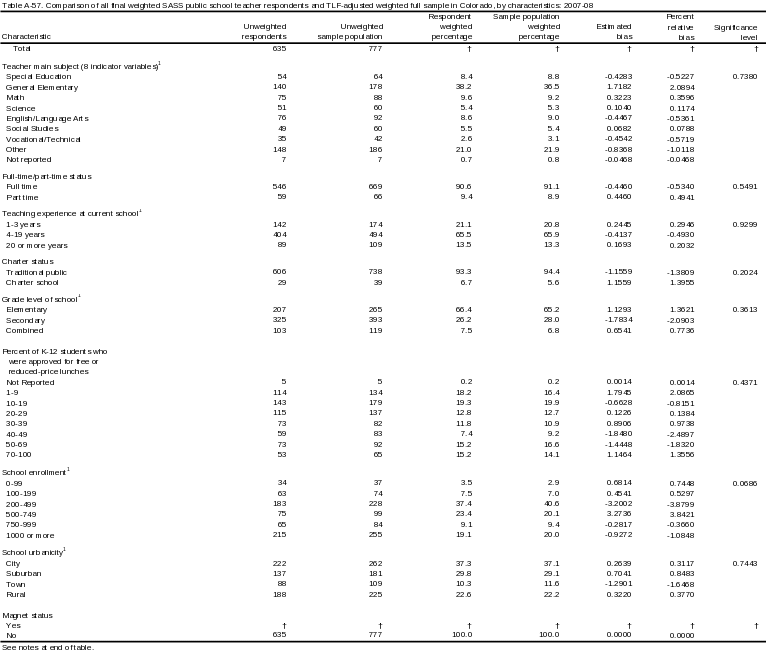
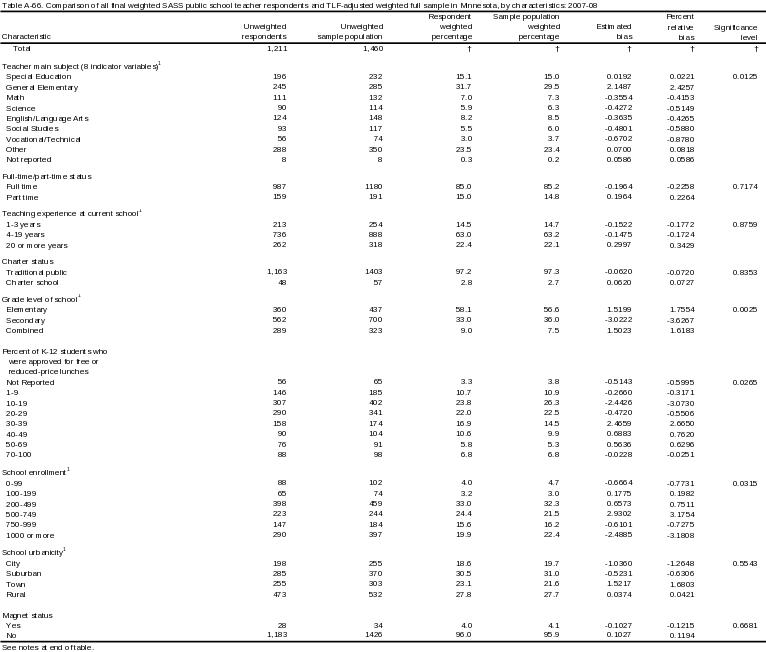
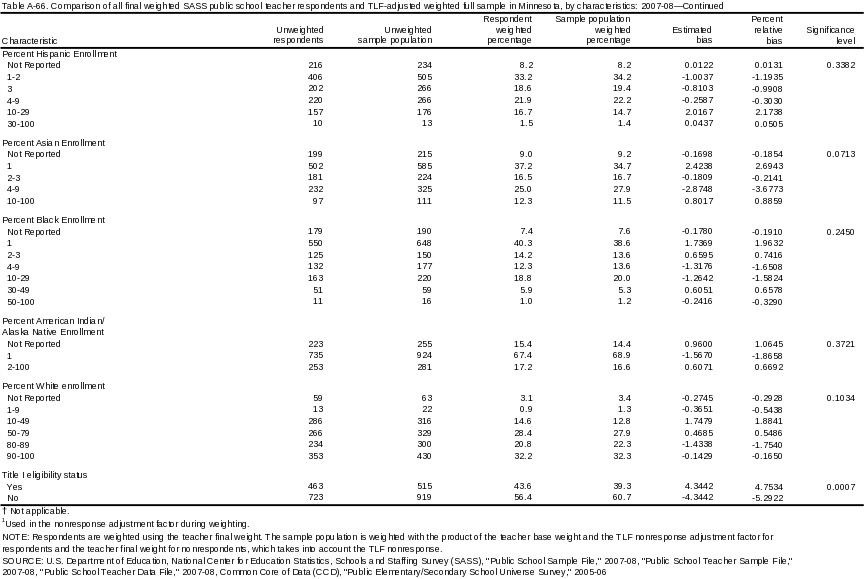
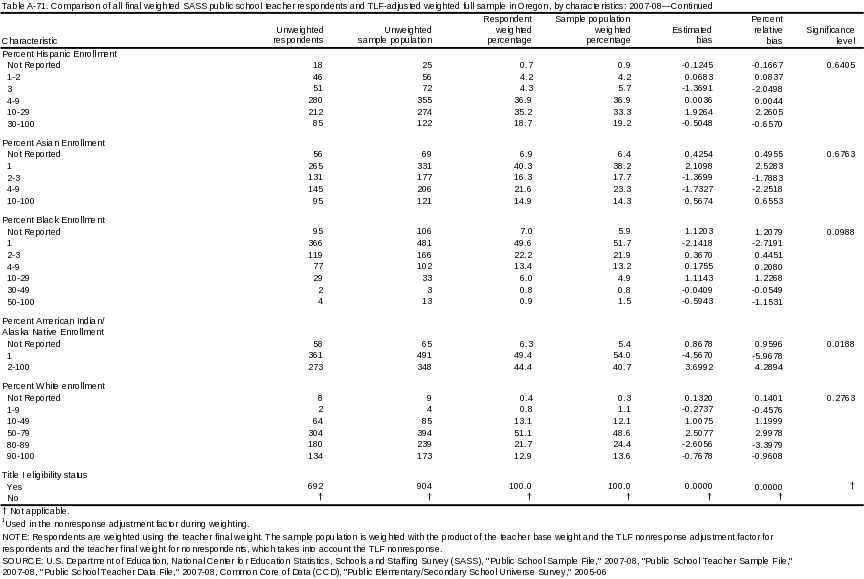
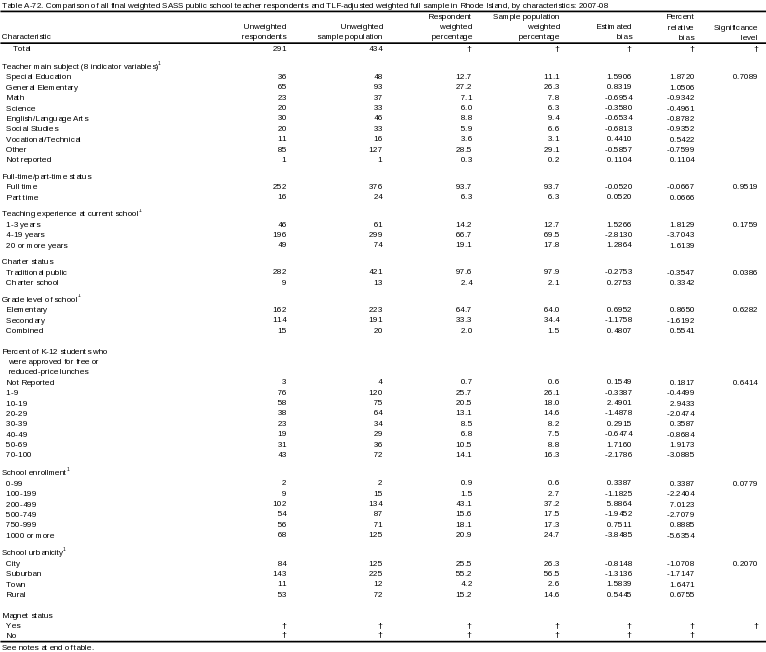
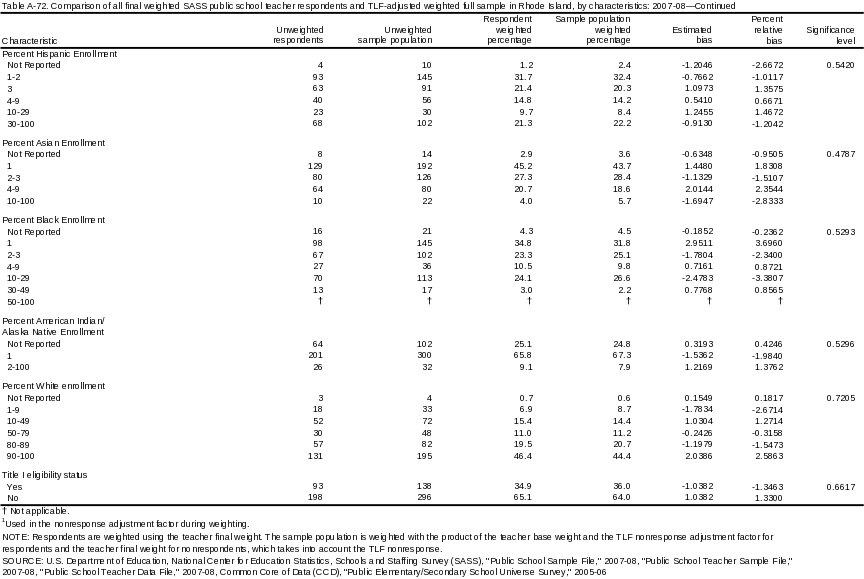
Among states with a response rate less than 85 percent, Alaska has the largest mean (2.397) and median (1.117) percent relative bias before final weighting adjustments. The state with the highest percentage of characteristics that are significantly different between respondent and sample populations was Minnesota (40.0). After final weight adjustments, Alaska had the highest mean (2.035) and Rhode Island had the largest median (1.271) relative bias. The state with the highest percentage of significantly different characteristics was Massachusetts (50.0).
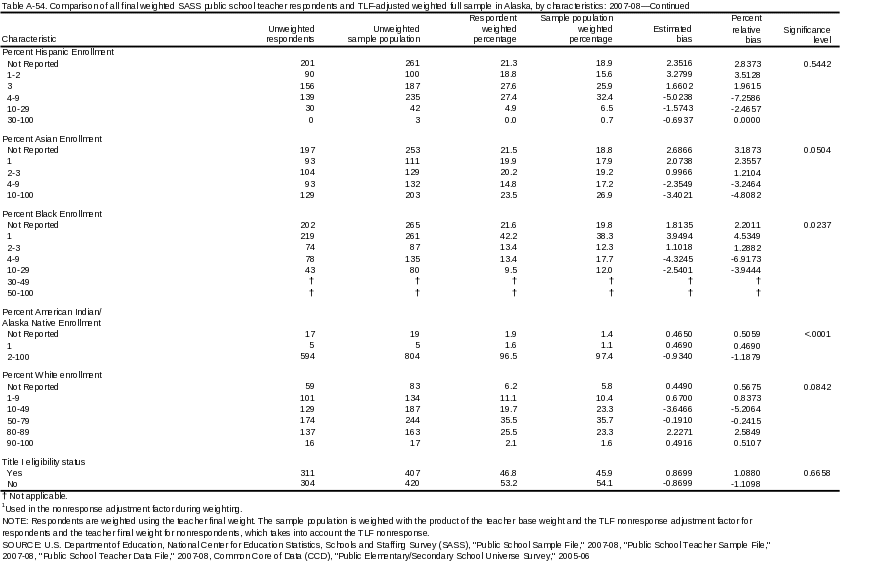
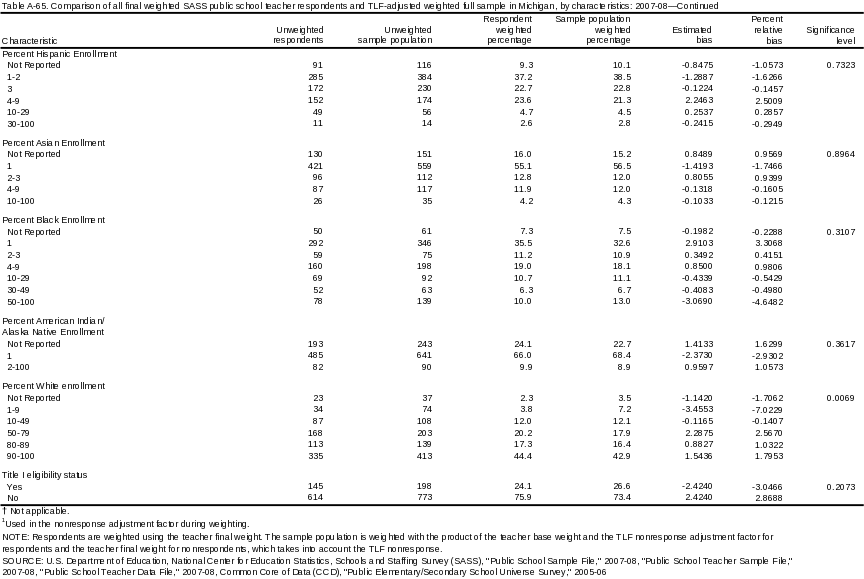
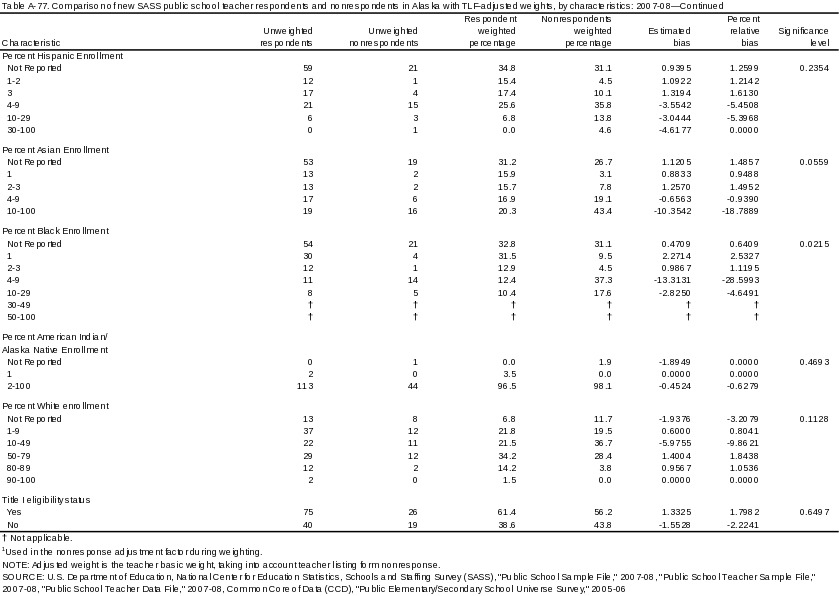
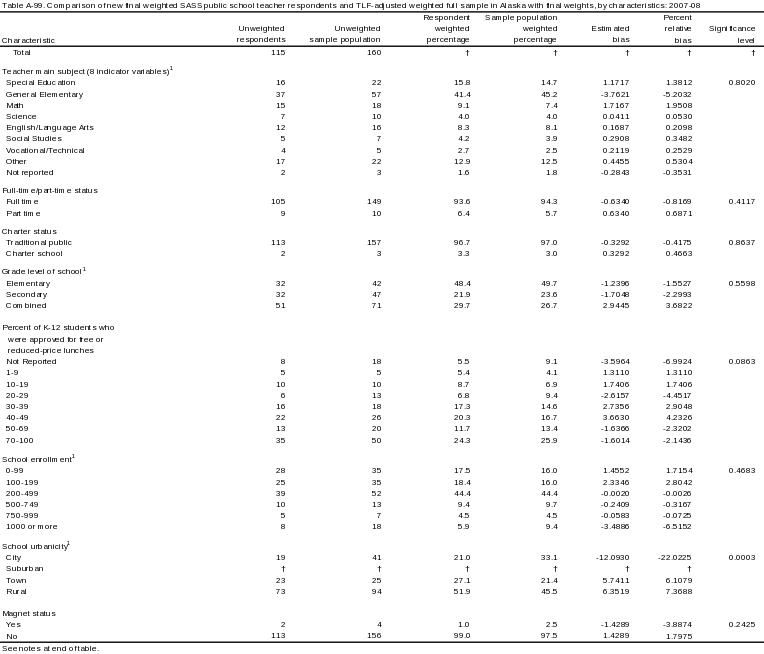
The final-weighted state table for Alaska (described at the end of this report) shows that there are five characteristics with significant (+/- 5) relative bias. There was significant nonresponse bias for teachers in city and rural schools, schools with 4-9 percent Hispanic enrollment, schools with 4-9 percent Black enrollment, and schools with 10-49 percent White enrollment. The overall distributions of school urbanicity (p < .001) and percent Black enrollment (p = 0.0237) were significantly different between the final-weighted respondent population and the TLF-adjusted weighted sample population. Percent Hispanic enrollment (p = 0.5442) and percent White enrollment (p = 0.0842) were not significantly different.
Rhode Island, the state with the highest median relative bias, had two characteristics with significant bias: schools with 200-499 students (7.0123) and schools with 1,000 or more students (-5.6354). The distribution of school enrollment was not significantly different between the respondent and sample populations (p = 0.0779).
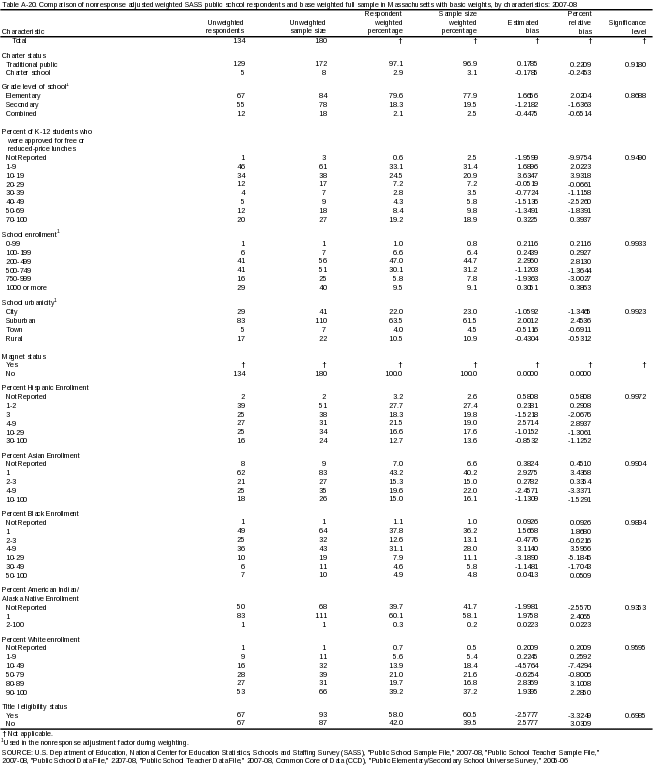
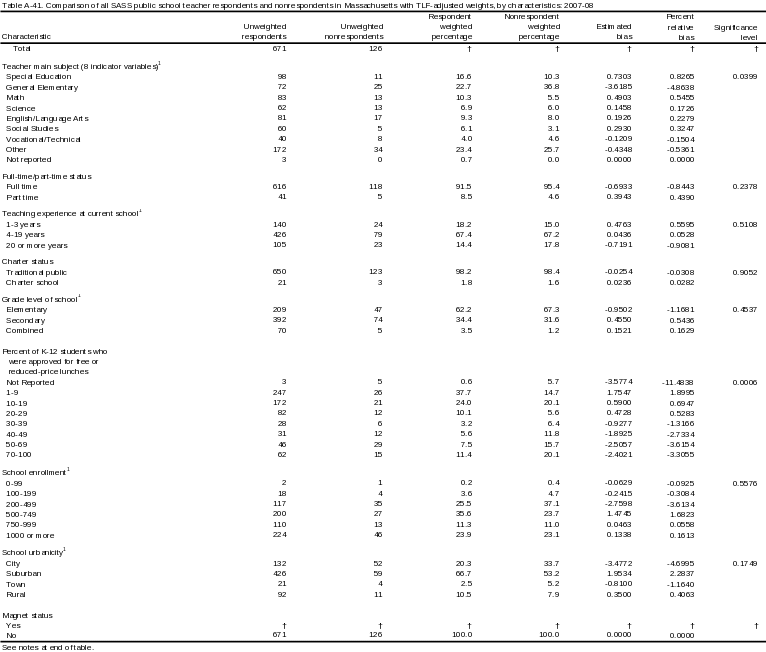
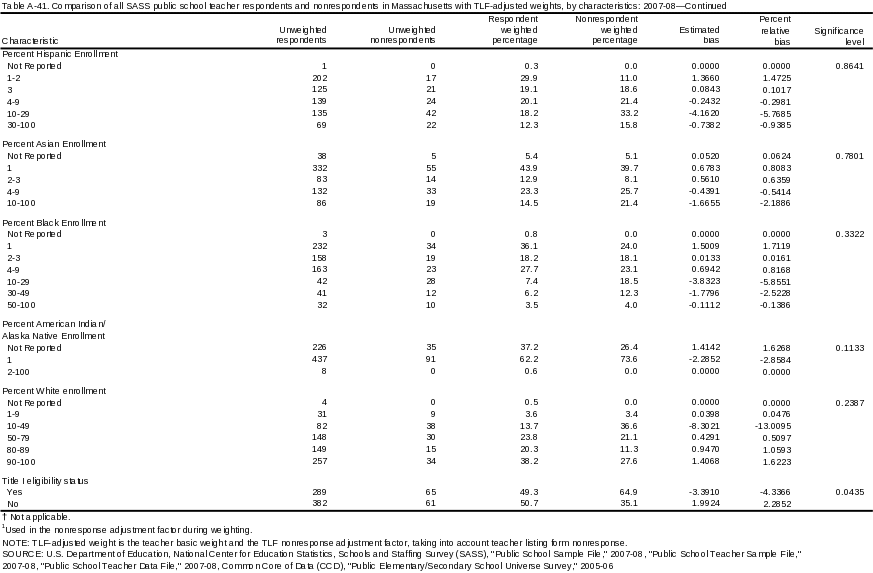
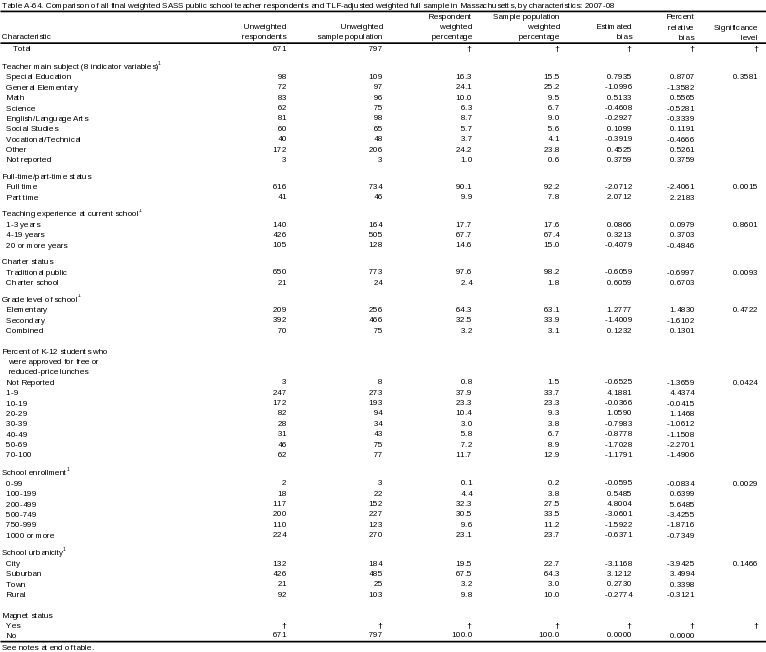
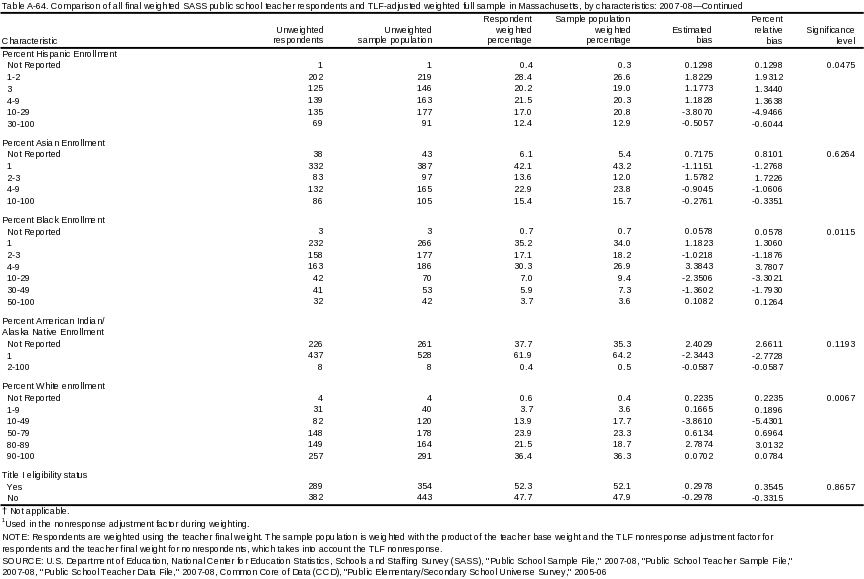
Massachusetts, the state with the highest percentage of significant differences of characteristics between the respondent and sample populations, had significant relative bias for teachers in schools with 200-499 students (5.6485) and 10-49 percent White enrollment (-5.4301). The distributions of both school enrollment (p = 0.0029) and percent White enrollment (p = 0.0067) were significantly different.
Nationally, before final weighting, nonresponse bias was found among teachers in urban schools, schools with 30-100 percent of poverty, schools with 750 students or higher enrollment, and schools with 10-100 percent Hispanic or Black enrollment, and 1-9 percent White enrollment. Most, but not all states exhibited these patterns.
After final weighting, these patterns were reduced in all states and eliminated in some states. Some states still exhibited these patterns with moderate bias (+/-2 to +/-4.9). The mean relative bias decreased after final weighting in 11 states and increased in 12 states. Median relative bias increased in 19 states; only 4 states had a decrease in median relative bias after final weighting. Final weights did not affect the percentage of characteristics with significant tests for six states, while they decreased the percentage with significant tests for nine states and increased the percentage with significant tests for eight states. Thus, final weight adjustments did not have a consistent effect on nonresponse bias for all SASS public school teachers.
These relative bias means indicate a low level of nonresponse bias for all SASS public school teachers. After final weight adjustments, the highest average amount of relative bias was about 2 percent. Although several states had between 30 and 50 percent significantly different characteristics, the low level of mean and median bias shows that this did not translate into high nonresponse bias for the respondent populations.
New SASS public school teachers
Following the analysis of all public school teachers, the population was restricted to only new teachers (1-3 years of experience) to investigate the potential for bias among the cohort of first-year teachers in the BTLS. Table 7 contains summary information for the nonresponse bias analysis for new teachers.
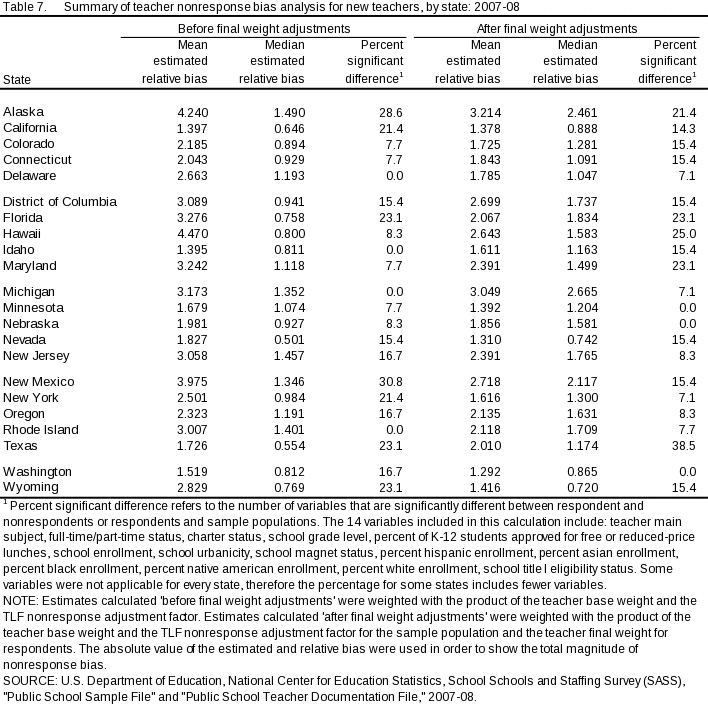
As table 7 shows, prior to final-weighting adjustments, Hawaii had the largest mean relative bias (4.470), and Alaska had the highest median relative bias (1.490). The state with the highest percentage of characteristics that were significantly different between respondent and nonrespondents was New Mexico (30.8). After the final-weight adjustments, Alaska had the highest mean relative bias (3.214) and Michigan had the highest median relative bias (2.665). The state with the highest percentage of characteristics that were significantly different was Alaska (28.6).
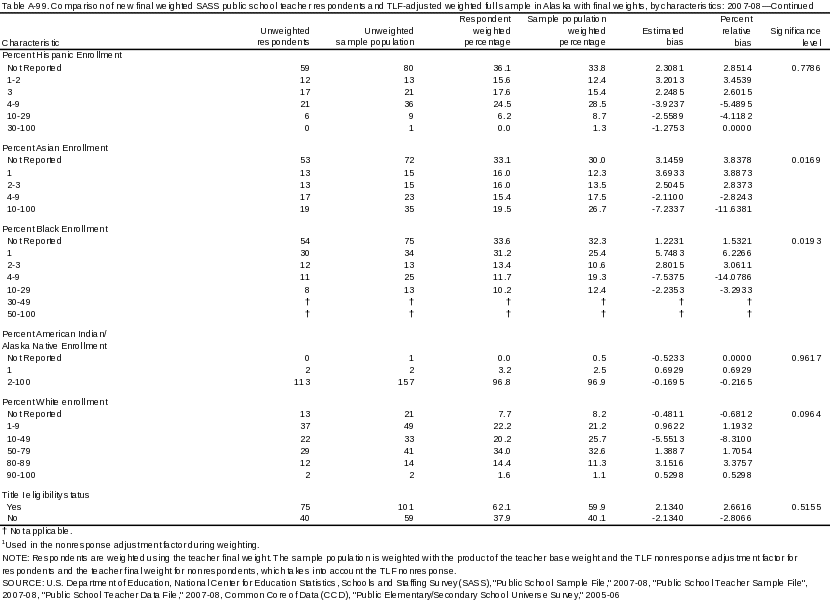
The final-weighted state table for Alaska shows that teachers in schools with the following characteristics had significant nonresponse bias:
special education teachers (-5.2032)
schools that did not report the percentage of K-12 students approved for free or reduced-price lunch (-6.9924),
1,000 or more school enrollment (-6.5152),
city schools (-22.0225),
schools in towns (6.1079).
rural schools (7.3688),
4-9 percent Hispanic enrollment (-5.4895),
10-100 percent Asian enrollment (-11.6381),
1 percent Black enrollment (6.2266),
4-9 percent Black enrollment (-14.0786), and
10-49 percent White enrollment (-8.3100).
There were significant differences in the school characteristics of responding teachers and of the overall eligible teacher sample in Alaska for urbanicity (p = 0.0003), percent Asian enrollment (p = 0.0169) and percent Black enrollment (p = 0.0193). The differences in teacher main subject (p = 0.8020), students approved for free or reduced-price lunches (p = 0.0863), school enrollment (p = 0.4683), percent Hispanic enrollment (p = 0.7786), and percent White enrollment (p = 0.0964) were not significantly different. This shows that, while not all characteristics exhibit nonresponse bias, several do show that bias is a potential issue for new teachers in Alaska.
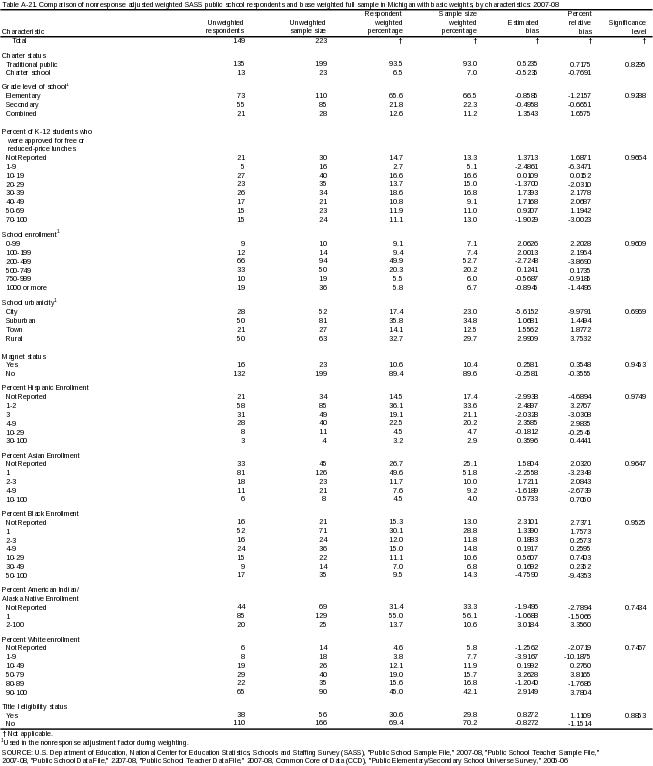
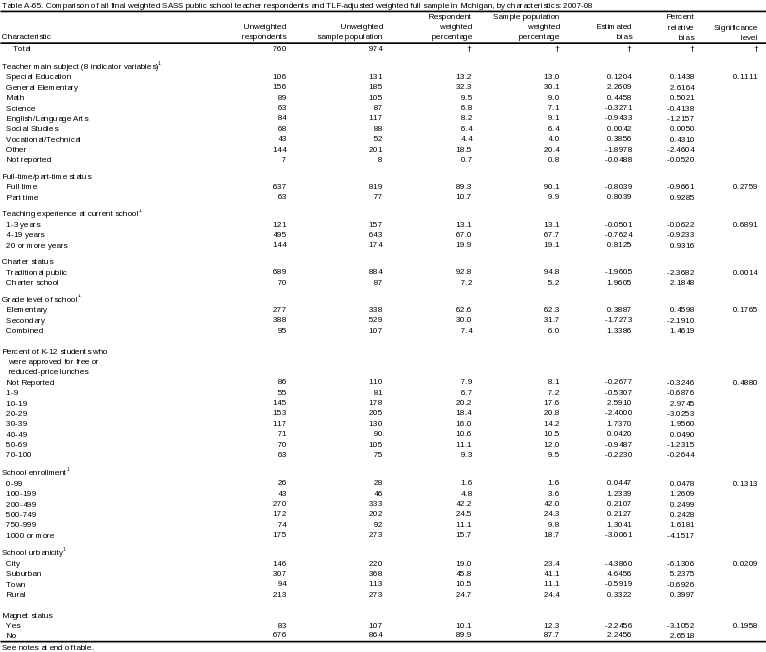
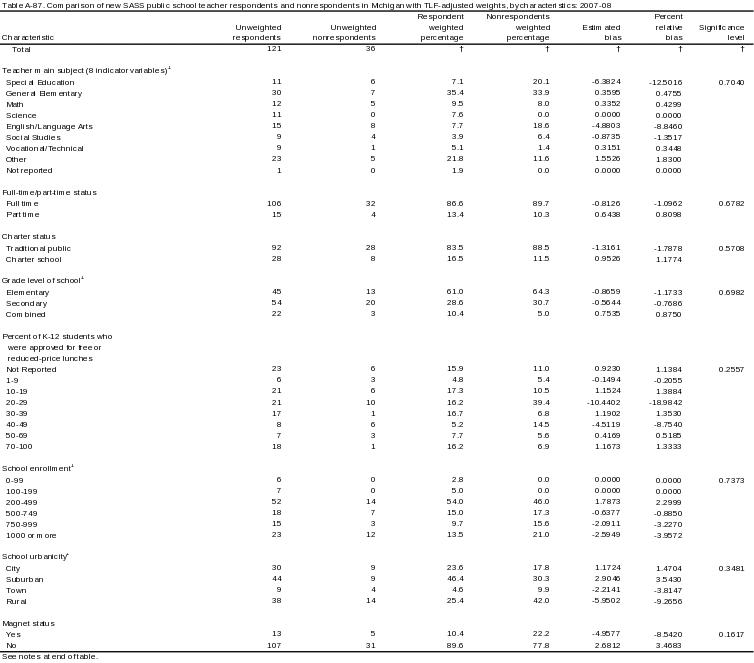
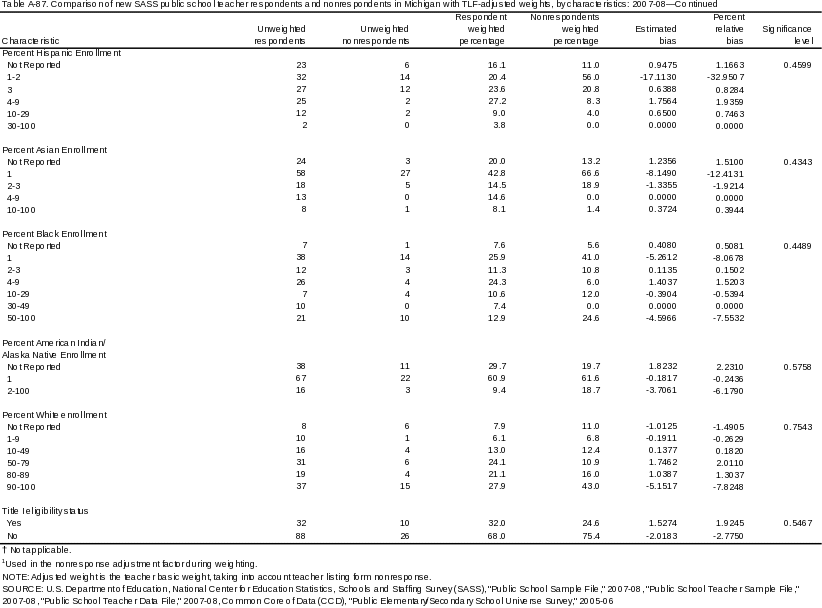
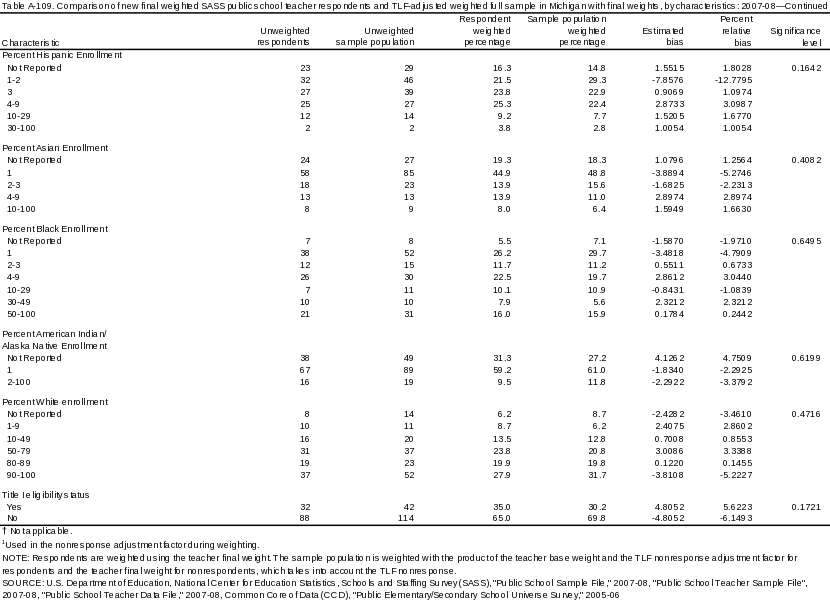
The final-weighted state table for Michigan shows that teachers in schools with the following characteristics had significant nonresponse bias:
traditional public schools (-7.9306),
charter schools (7.0421),
schools with 20-29 percent of K-12 students approved for free or reduced-price lunch (-13.7324),
schools with 70-100 percent of K-12 students approved for free or reduced-price lunch (5.0563),
rural schools (-6.3049),
magnet schools (-5.0923),
1-2 percent Hispanic enrollment (-12.7795),
1 percent Asian enrollment (-5.2746),
90-100 percent White enrollment (-5.2227),
schools eligible for Title I status (5.6223), and
schools not eligible for Title I status (-6.1493).
Charter status was the only characteristic with an overall distribution that was significantly different between the respondent and sample populations in Michigan (p = 0.0155). Thus, the high bias values did not translate into large differences between the respondent and sample populations in Michigan.
Overall, there were a few patterns with significantly high levels of relative bias in the base-weighted state tables. These included teachers who taught in schools with: 4-100 percent Asian enrollment, 4-100 percent Hispanic enrollment, 2-100 percent American Indian/Alaska Native enrollment, and 10-100 percent Black enrollment (17 states), city schools (14 states), 30-100 percent of K-12 students approved for free or reduced-price lunches (13 states), and schools with 500 or more students (21 states). Each pattern was also exhibited in several other states but as moderate relative bias (+/- 2 to +/-4.9). These patterns were similar to those found for all teachers with TLF-adjusted base weights; however the magnitude of nonresponse bias for new teachers is greater than for the whole teacher population.
As with the total teacher population, these patterns again were reduced by the teacher final weights. Significant bias for teachers in schools with high Asian, Hispanic, American Indian/Alaska Native, Black enrollment (14 states), medium to high enrollment (12 states), high percent of K-12 students approved for free or reduced-price lunch (5 states), and schools in cities (6 states) remained. The other significant patterns were eliminated or were only found in a few states, although all the patterns were still exhibited as moderate relative bias in most states. Table 6 illustrates that the final weights mitigated potential teacher nonresponse bias. All but two state’s mean relative bias decreased after final weighting. The effect of final weighting on the chi-square tests mitigated differences between the respondent and sample populations for ten states, while increasing the significant differences for nine states. The percentage of significant chi-square tests for three states were unaffected by the final weights.
These relative bias values indicate a higher level of nonresponse bias for new SASS public school teachers than for all SASS public school teachers. After final-weight adjustments, the highest average amount of relative bias was in Alaska (3.214). No state had a mean relative bias value of less than 1. This indicates that, while not a serious concern, nonresponse bias is greater among new SASS public school teachers than among all SASS public school teachers.
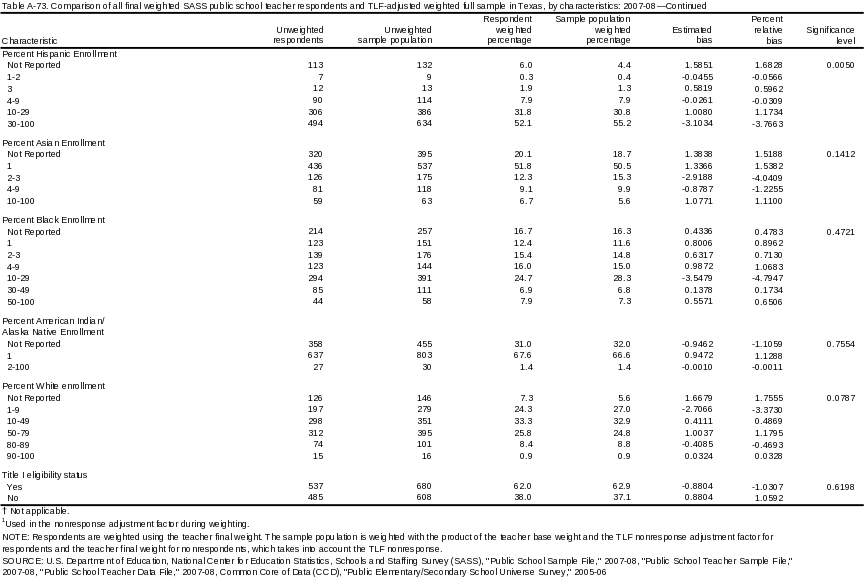
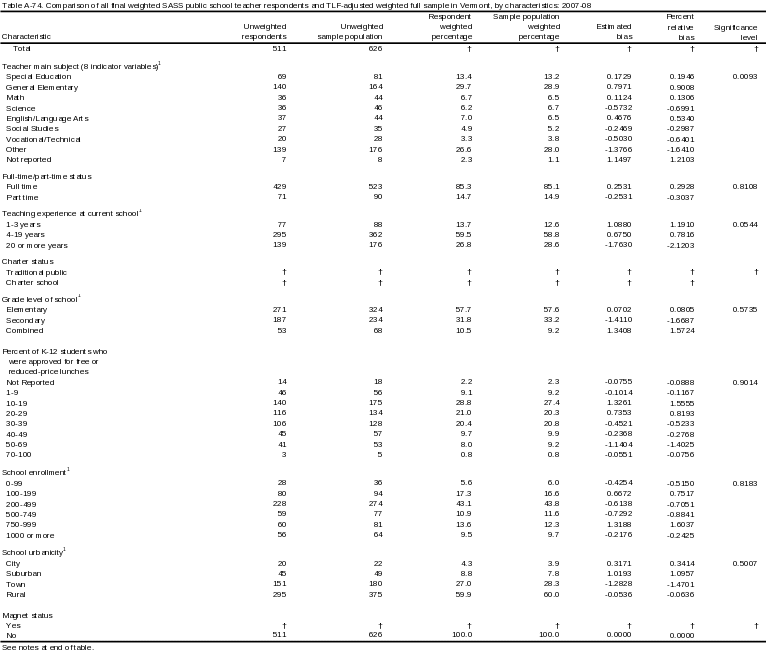
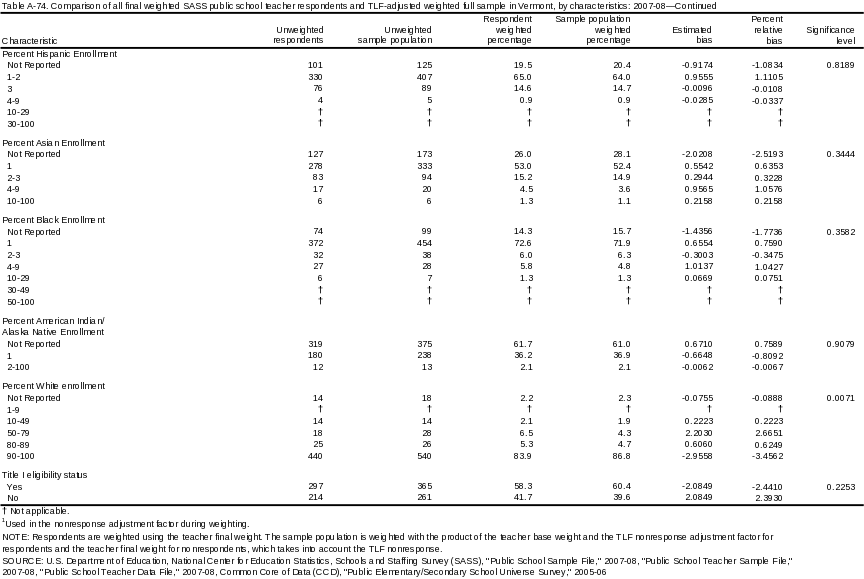
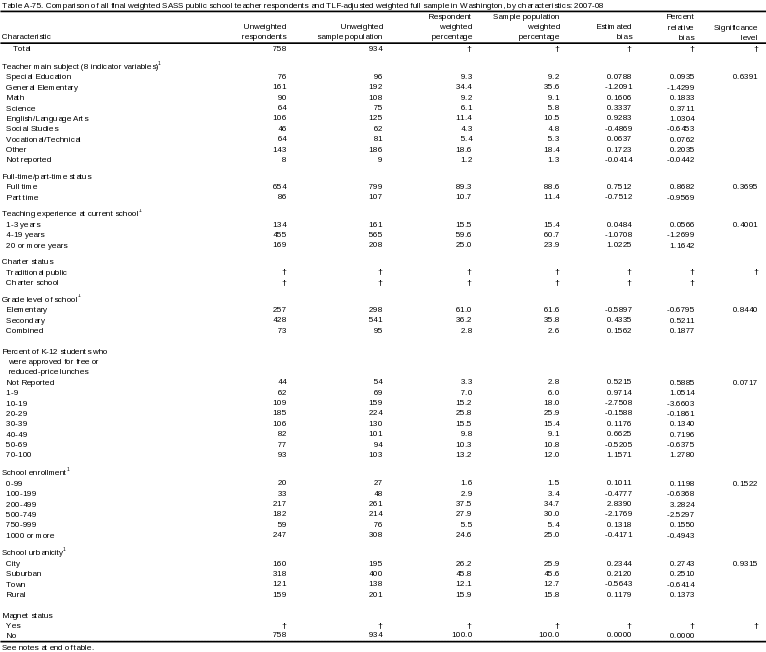
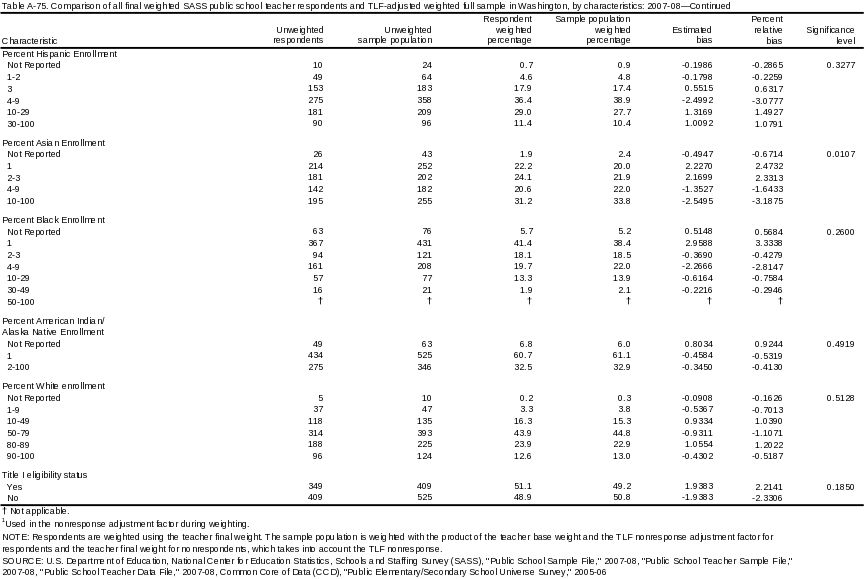
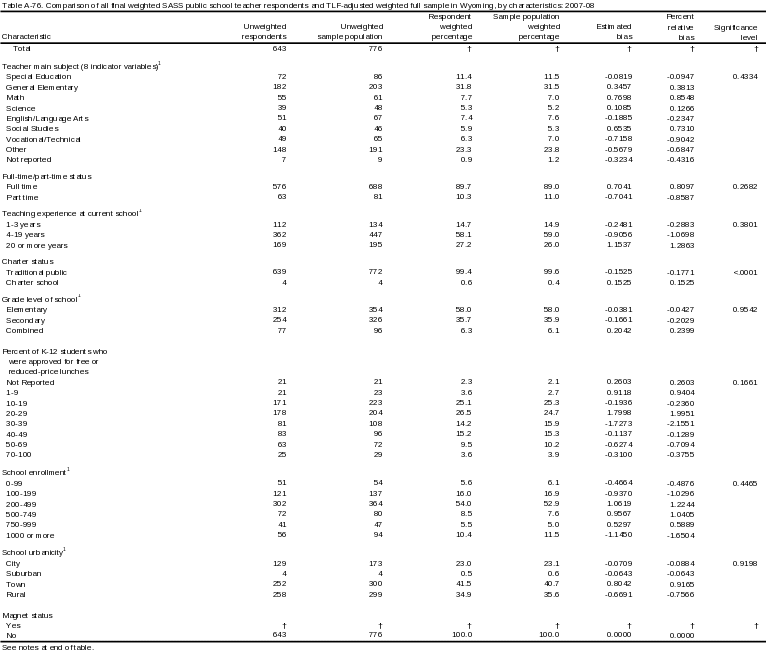
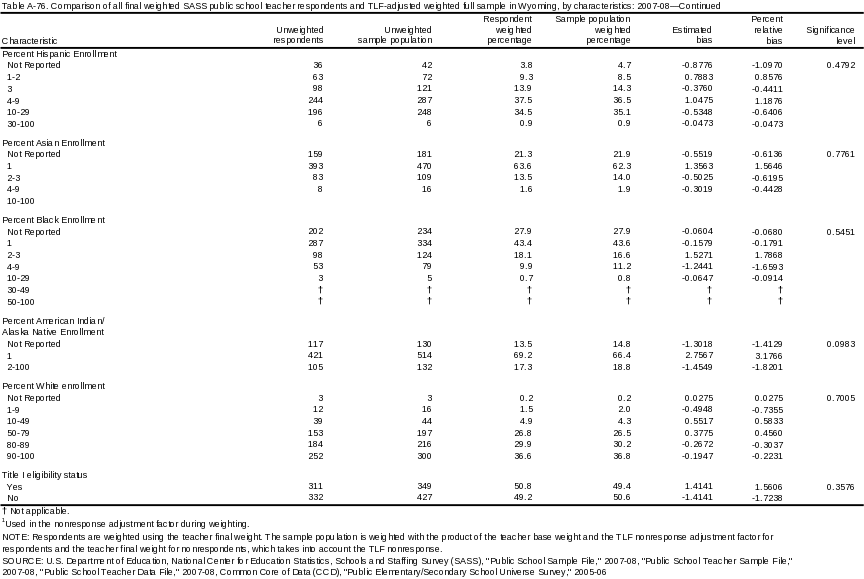
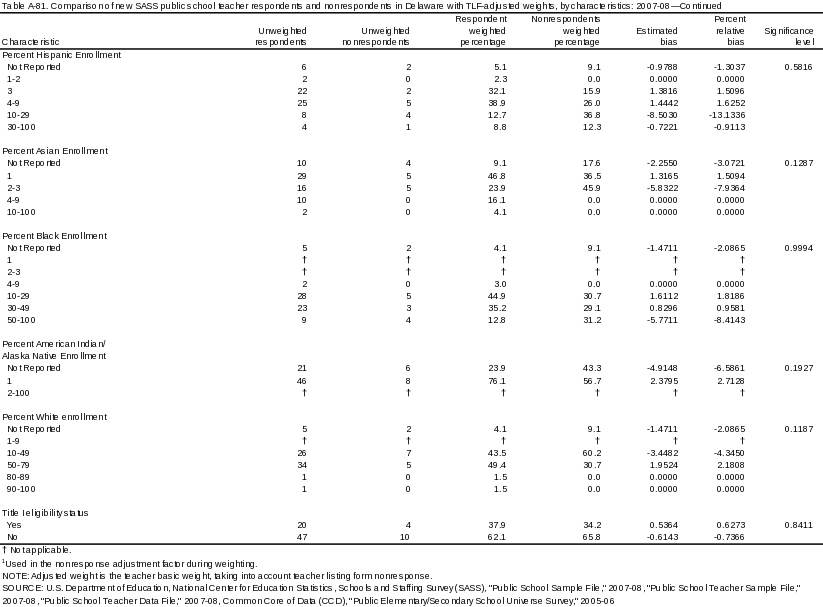
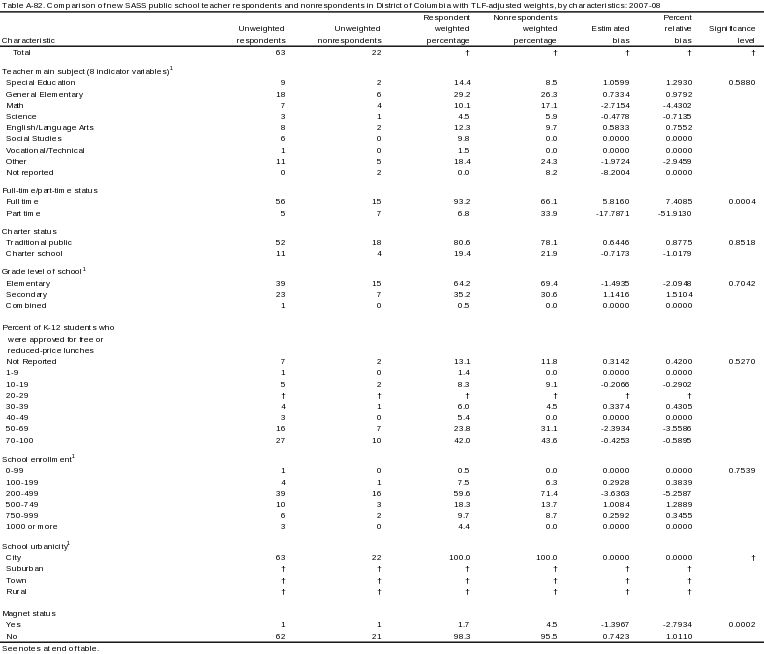
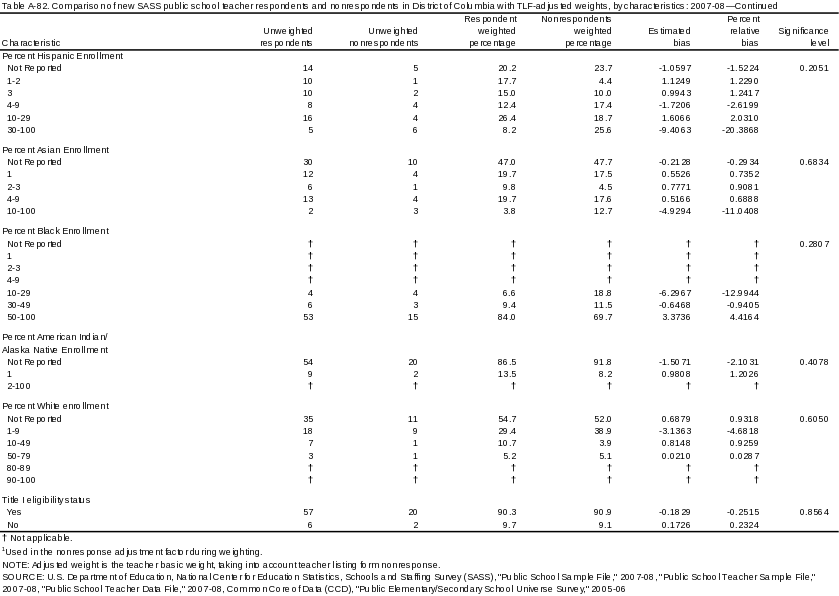
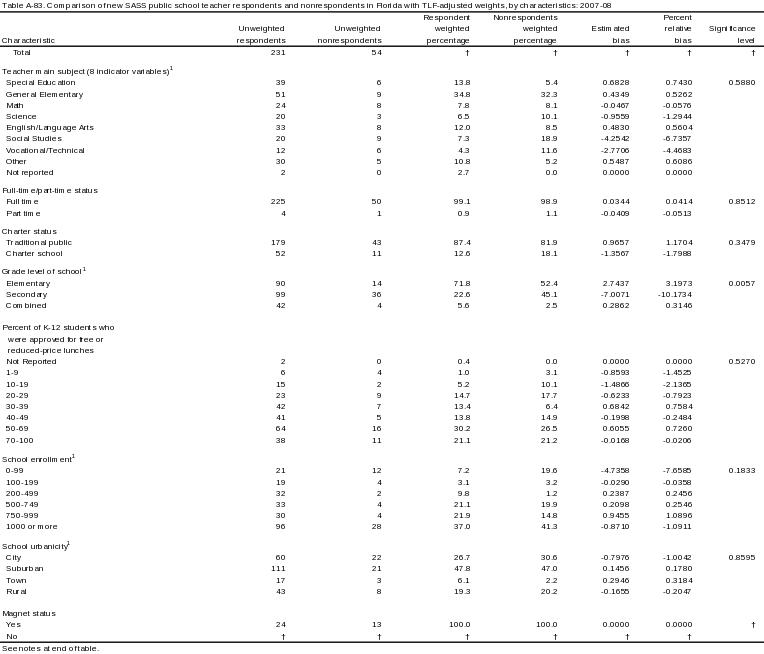
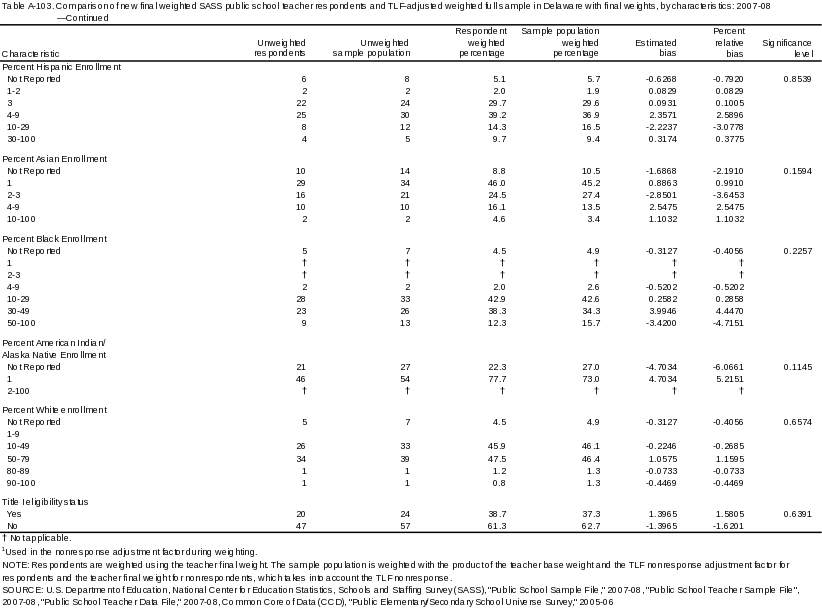
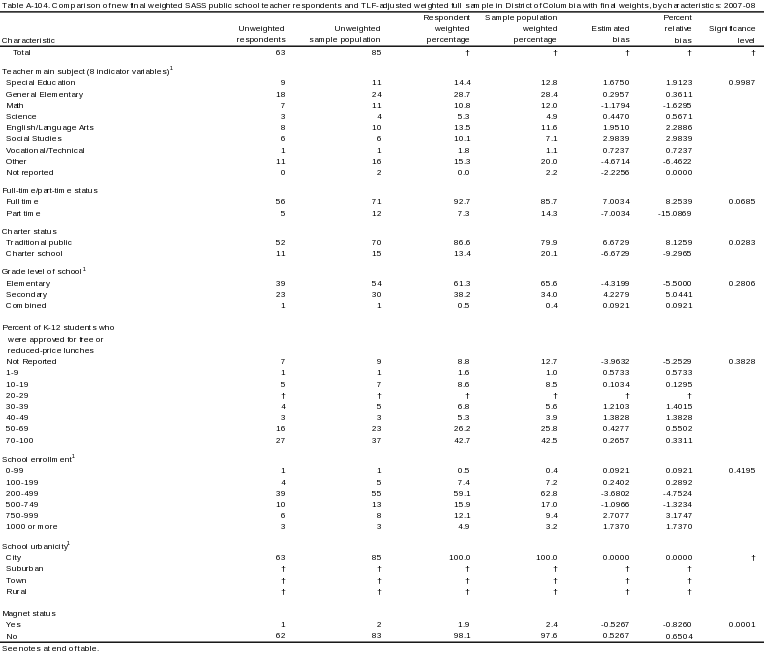
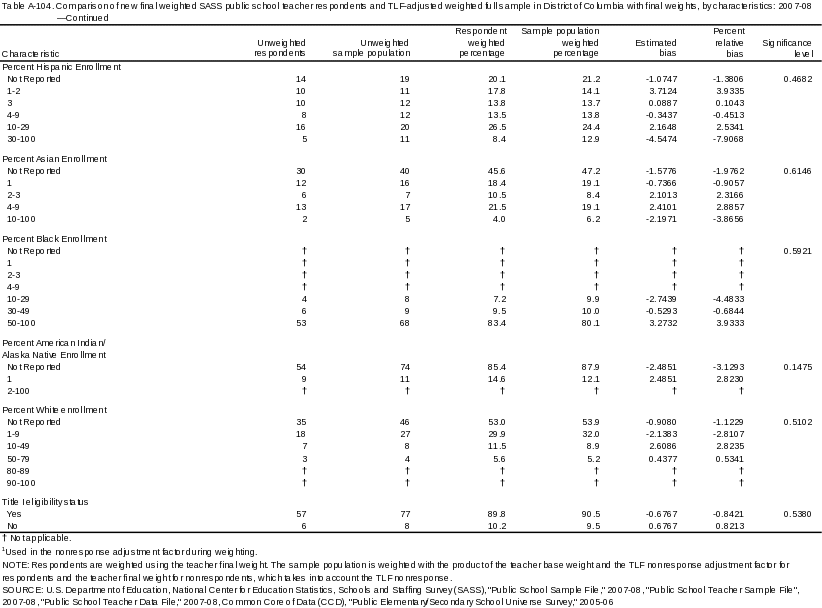
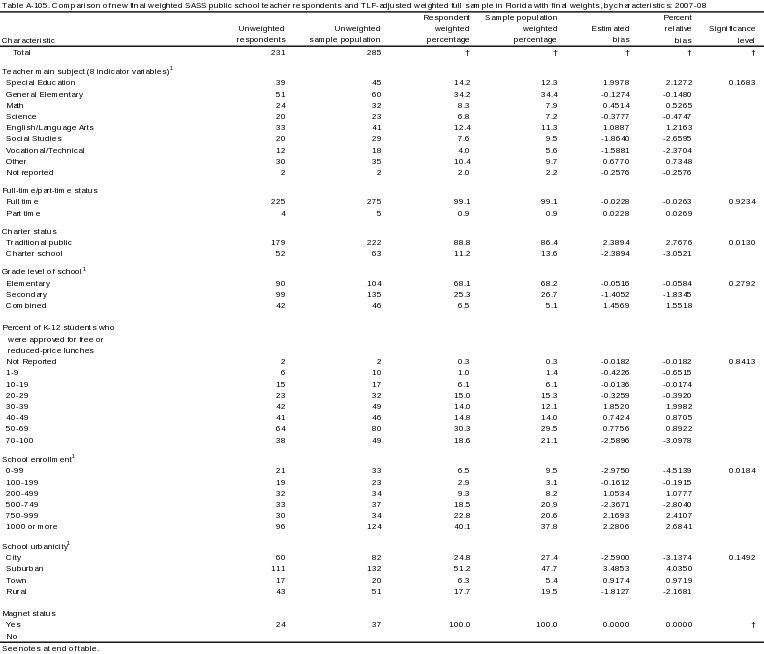
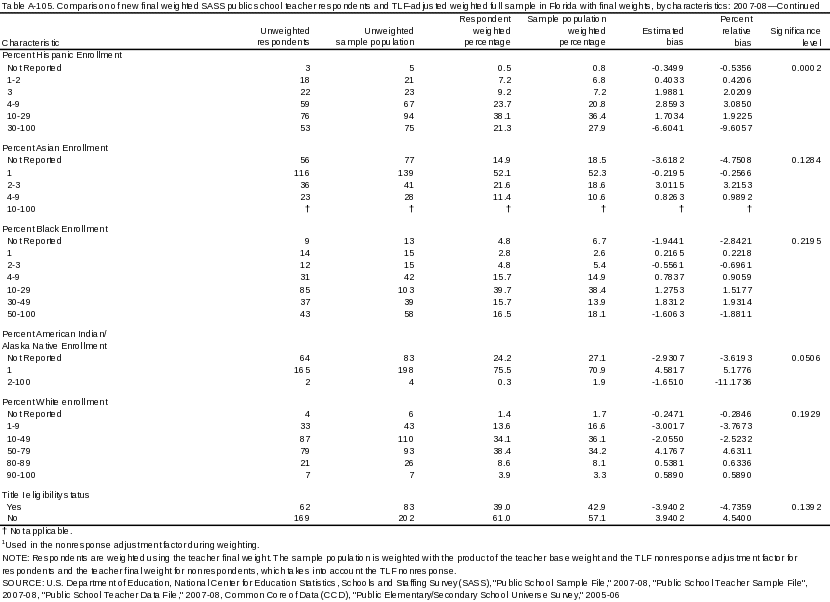
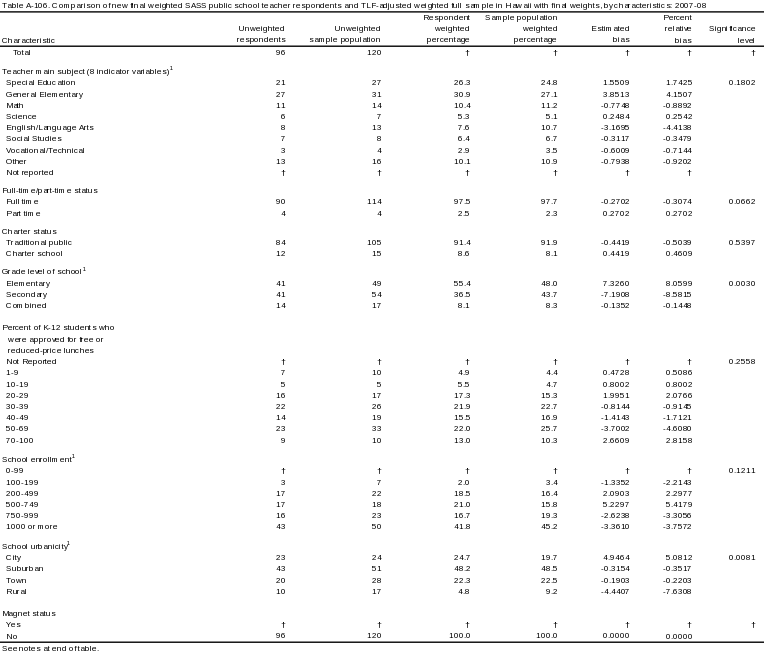
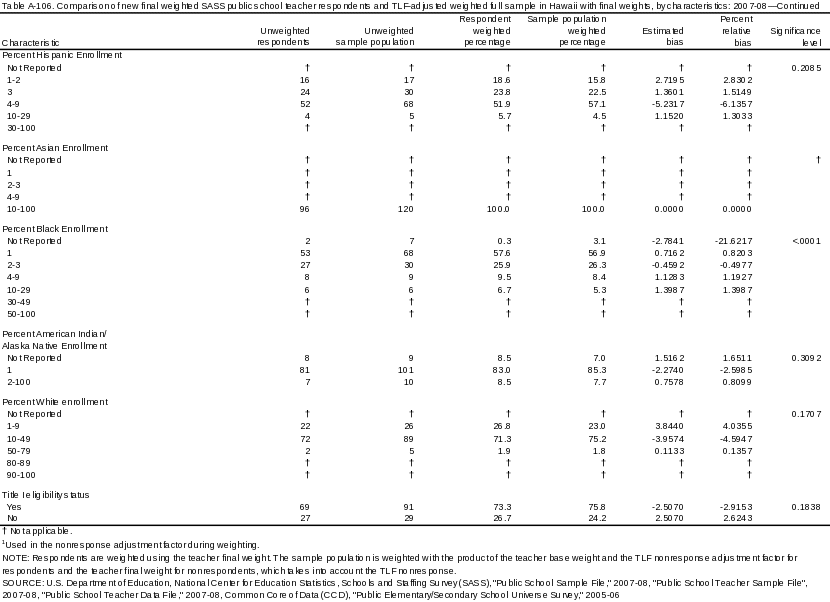
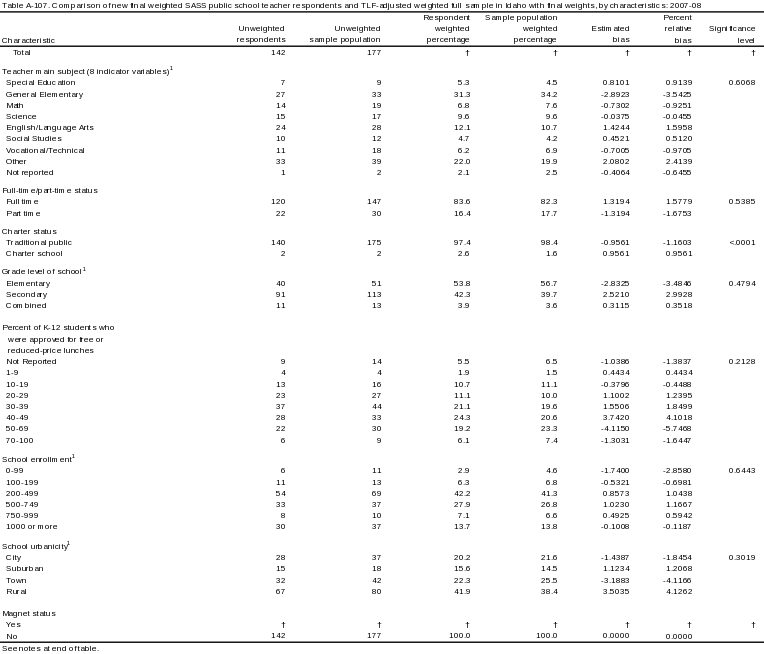
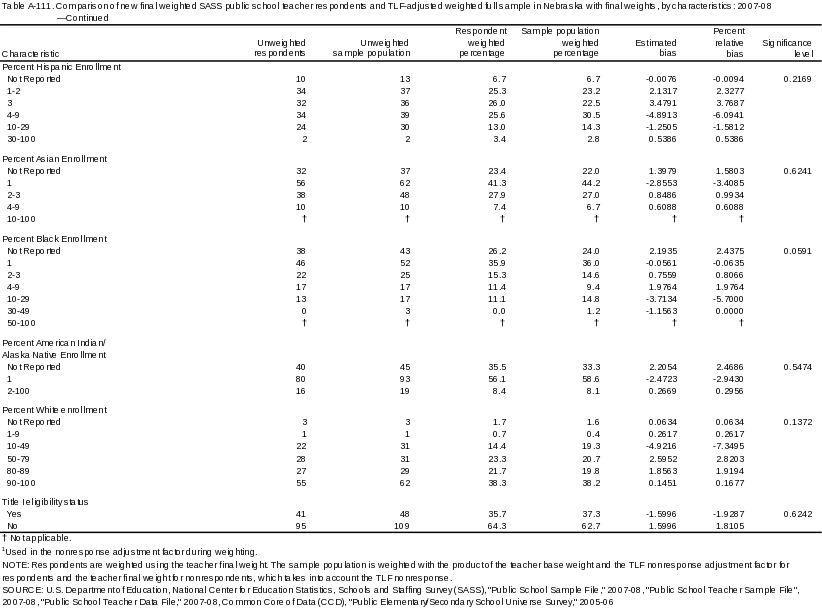
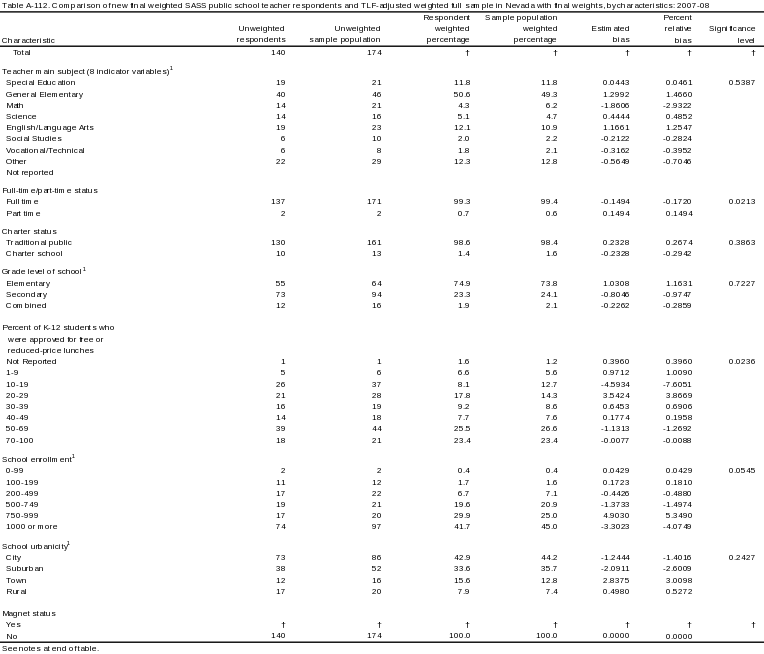
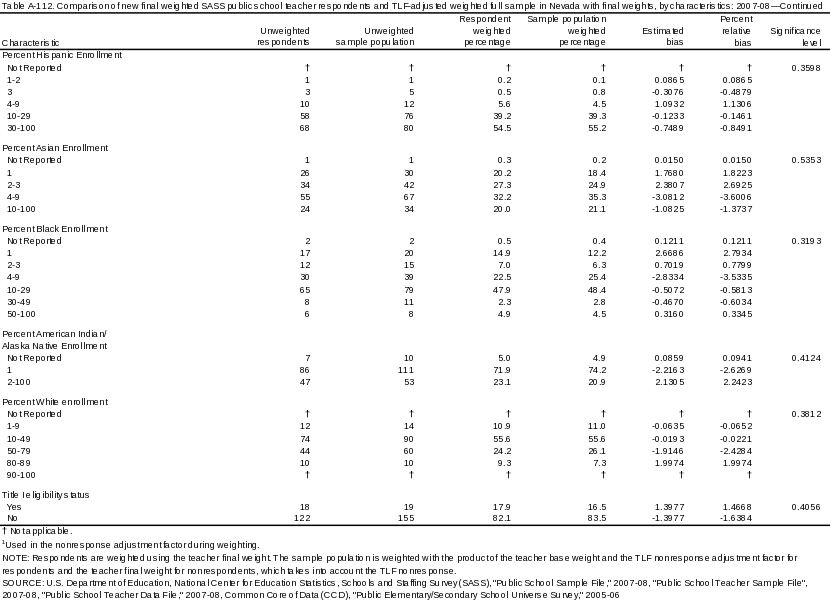
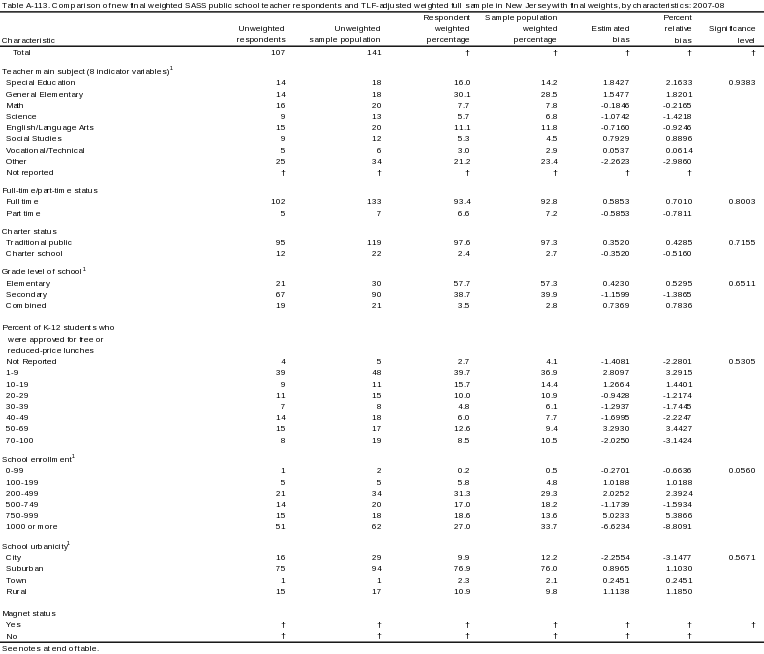
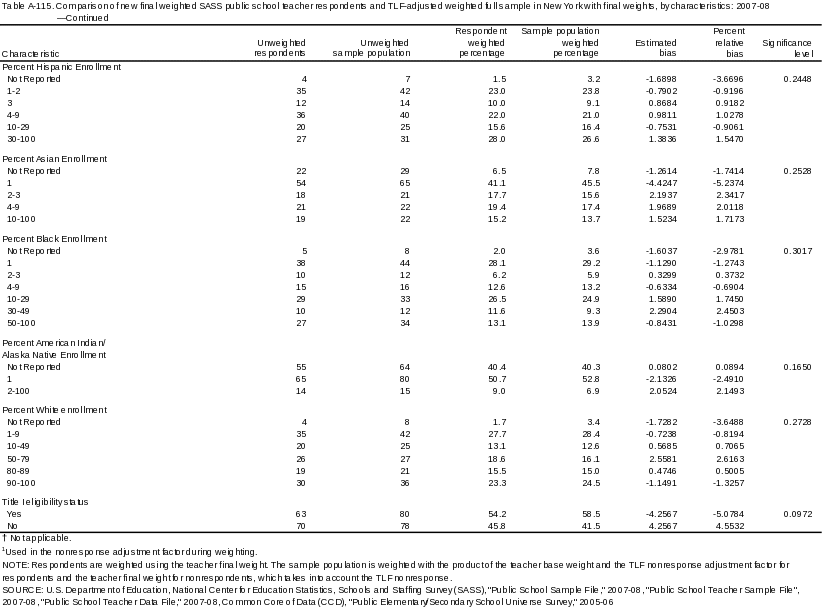
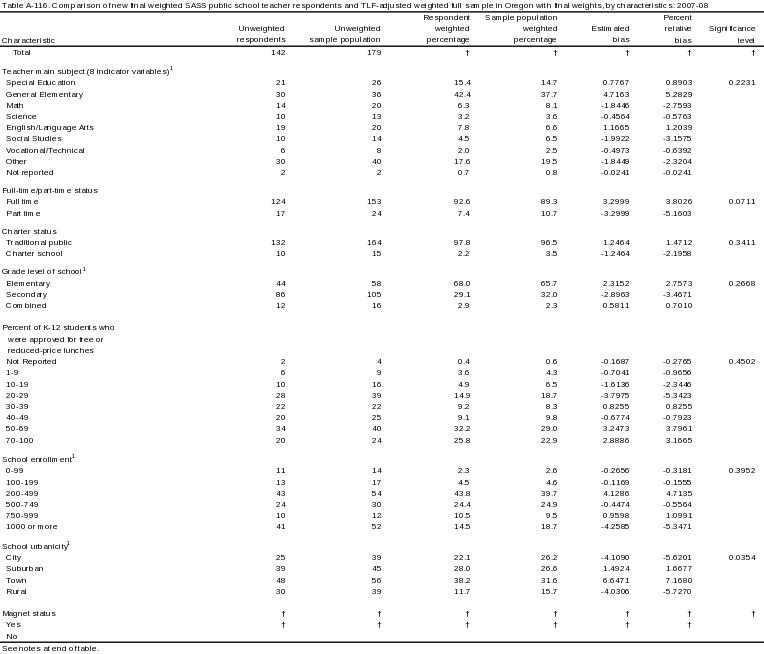
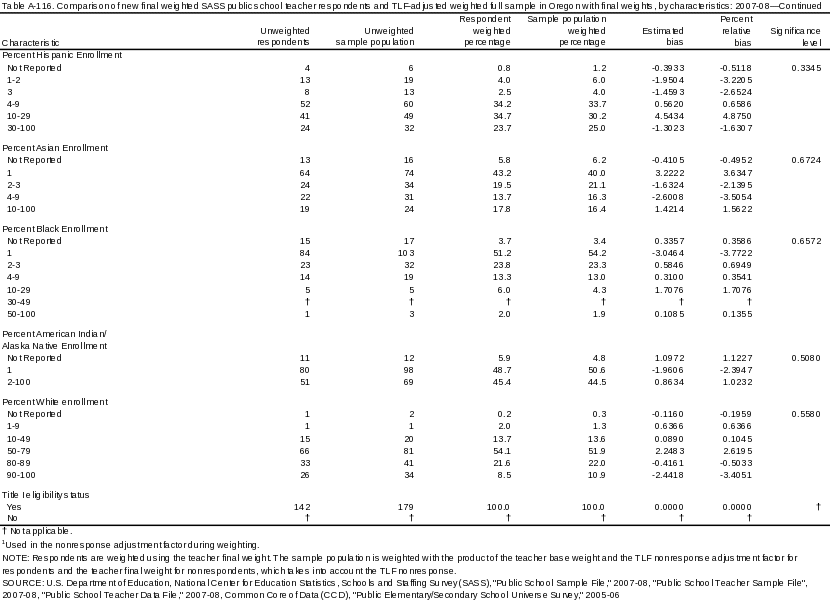
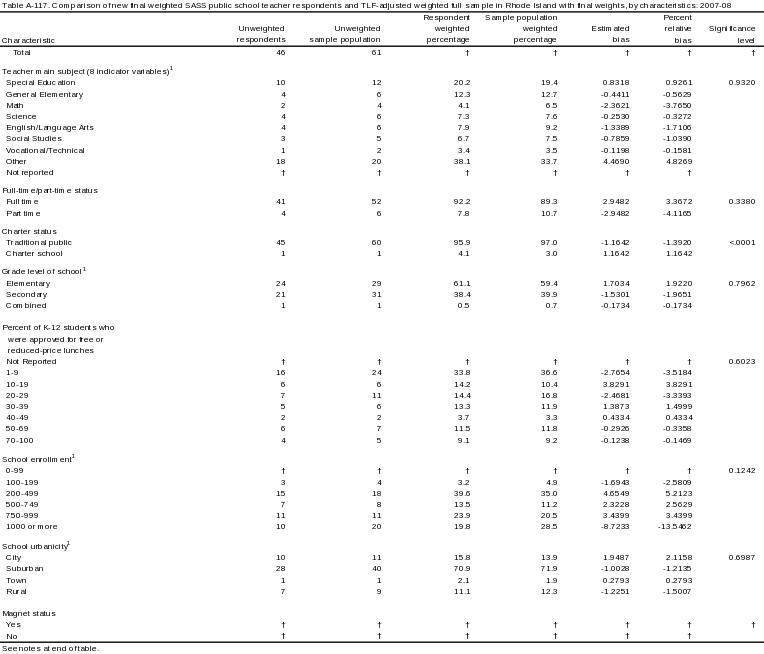
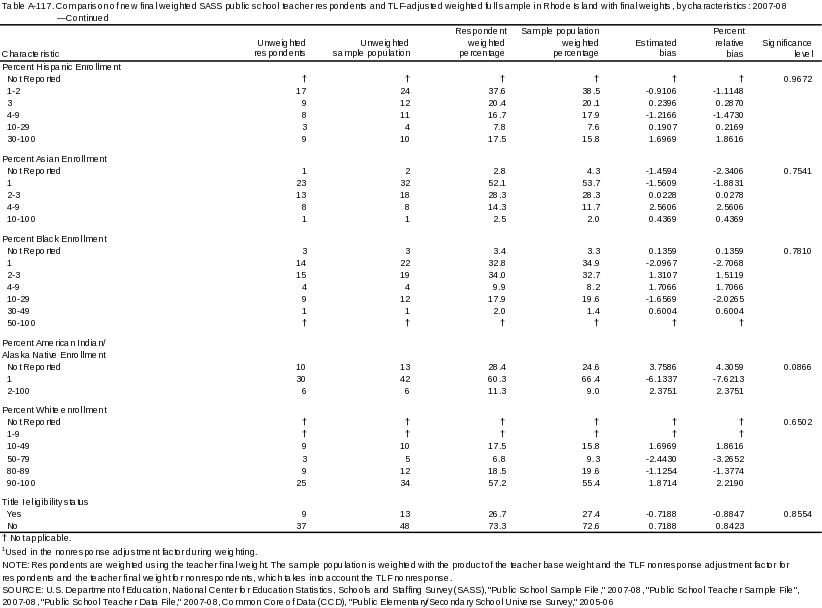
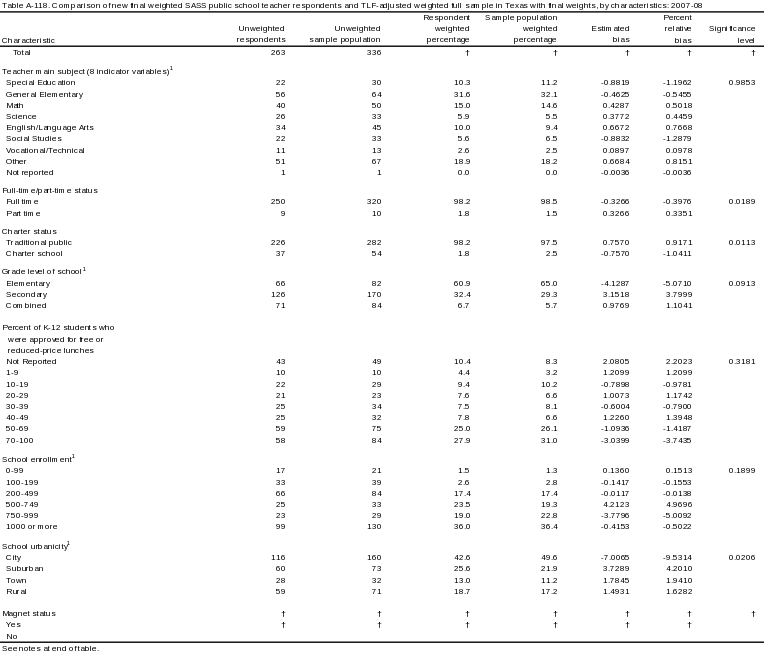
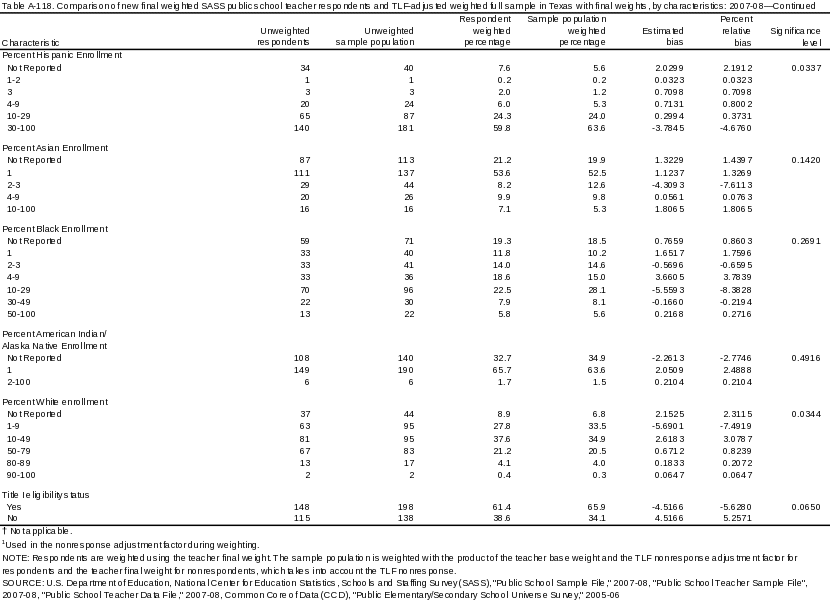
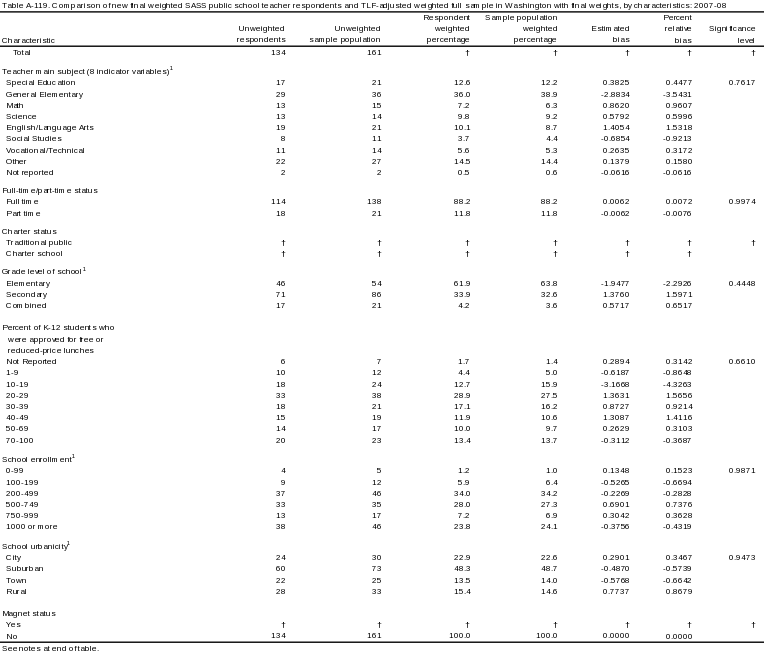
Description of State-Level Bias Tables
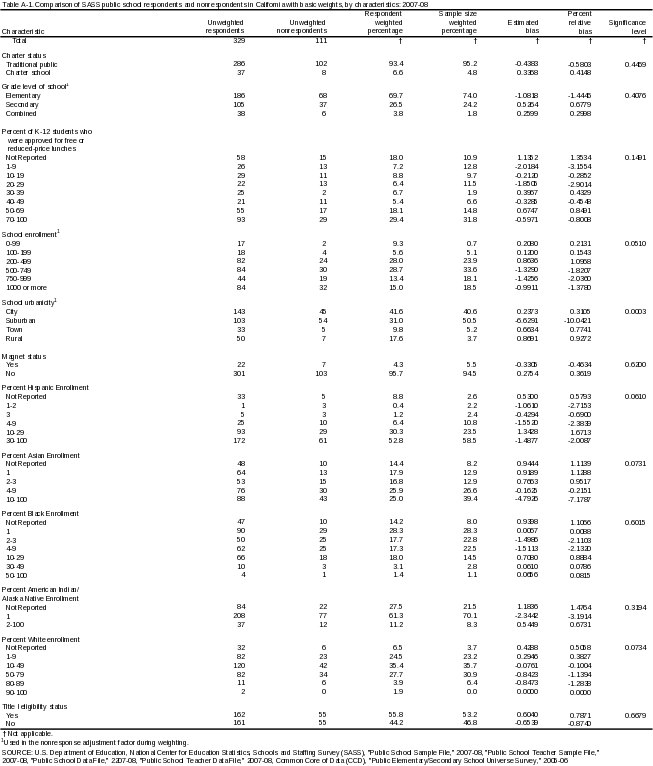
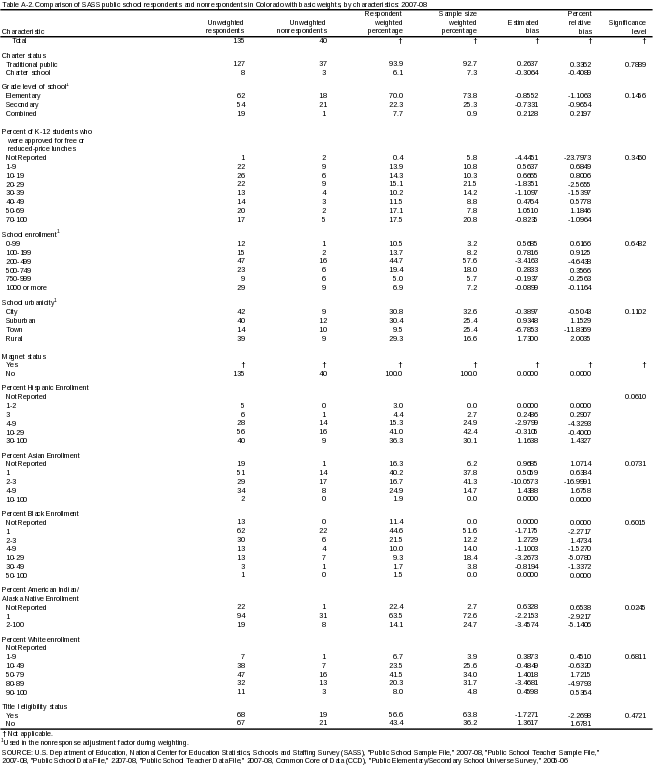
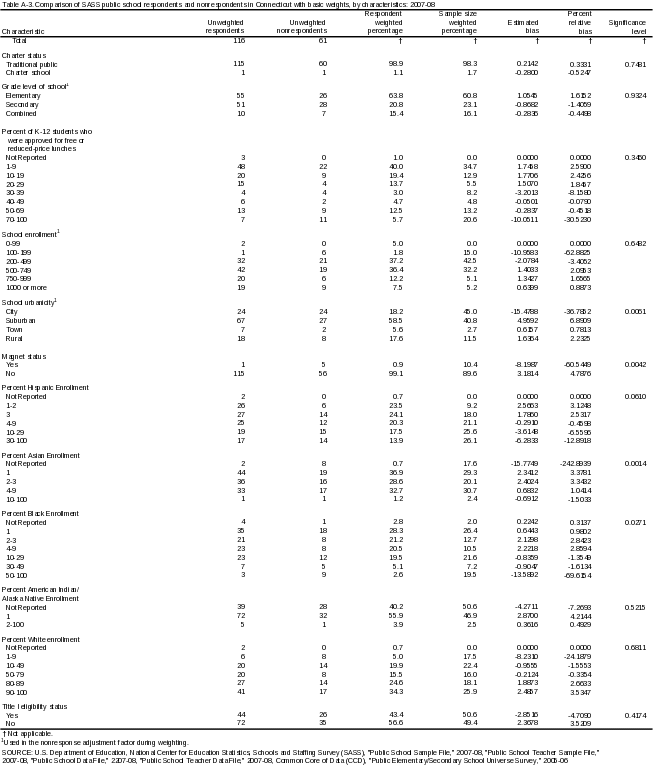
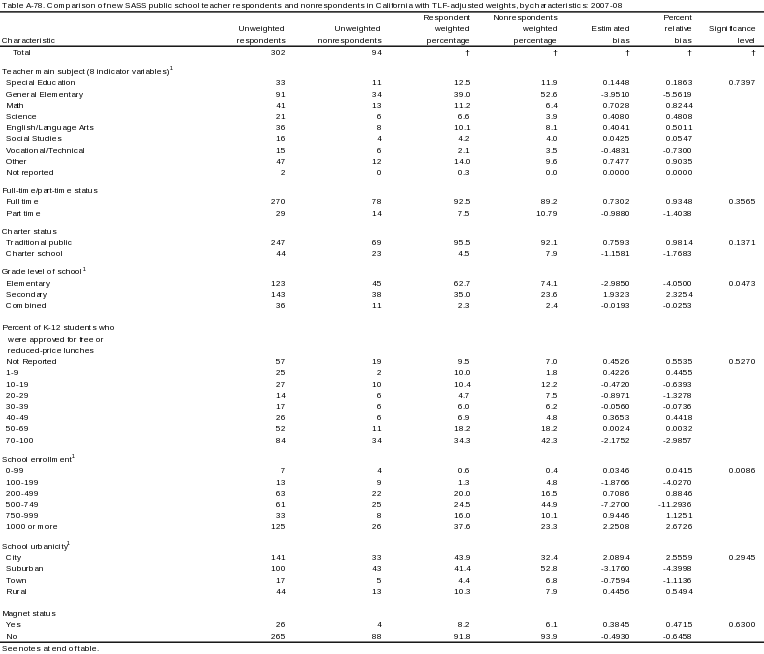
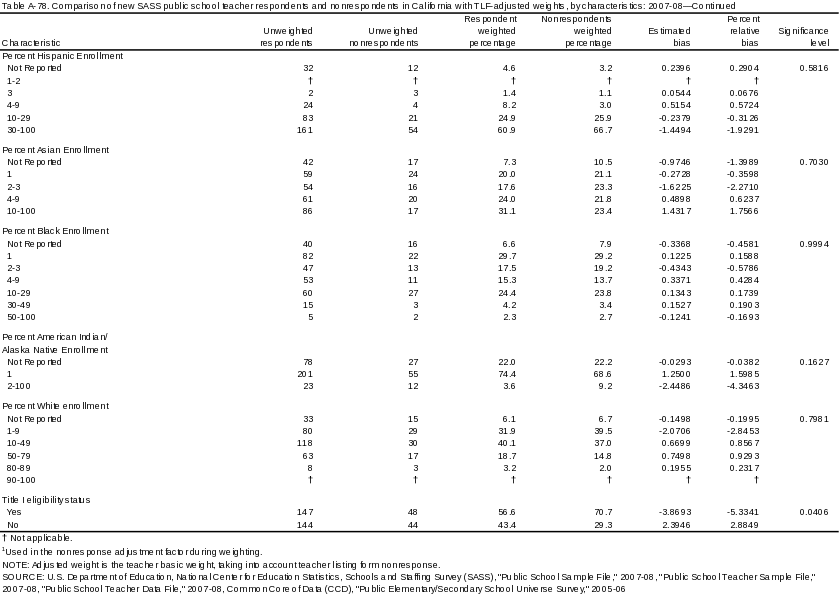
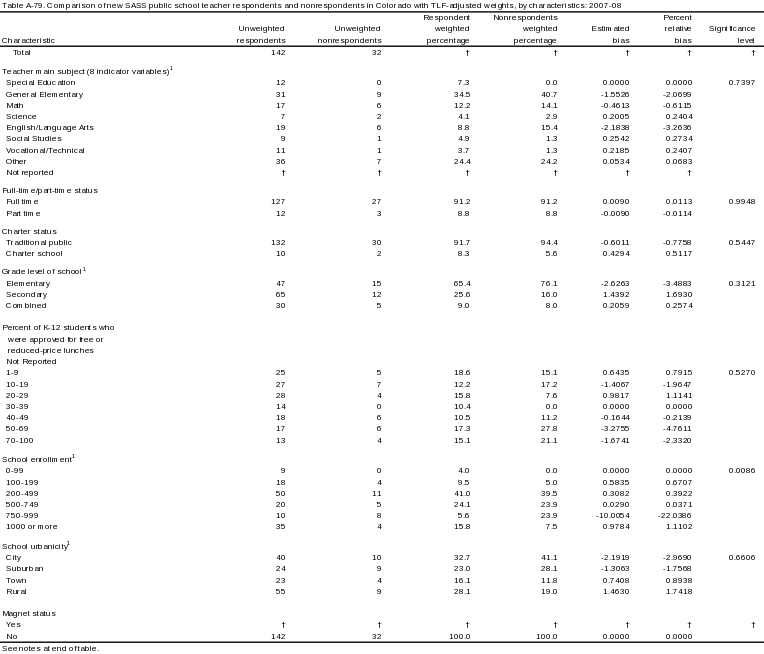
Nonresponse bias analysis was run for each state with less than an 85 percent response rate. For TLF nonresponse there were 15 states with a response rate less than 85 percent. For teacher nonresponse there were 23 states with a response rate less than 85 percent among all teachers, while 22 states had less than an 85 percent response rate among beginning teachers. The attached tables (Attachments 1, 2 and 3) show the results of this analysis for each state.
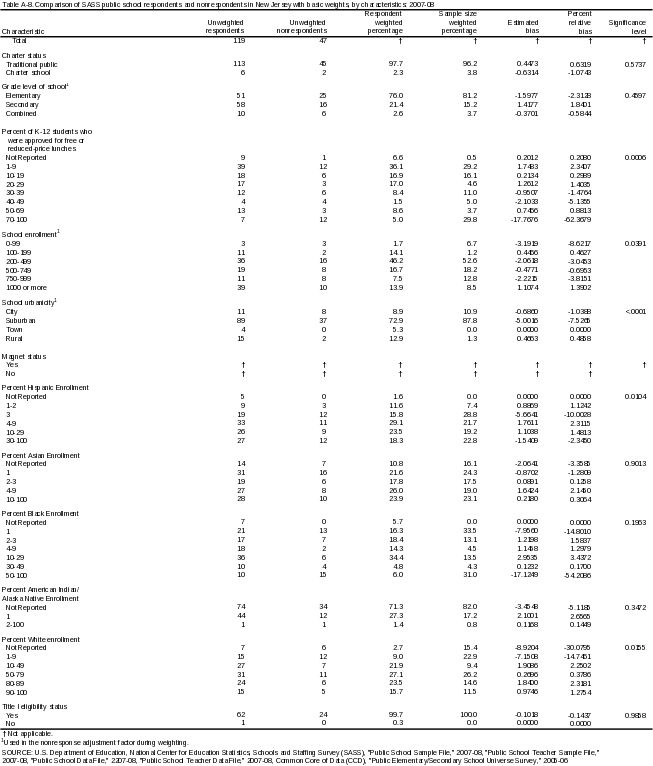
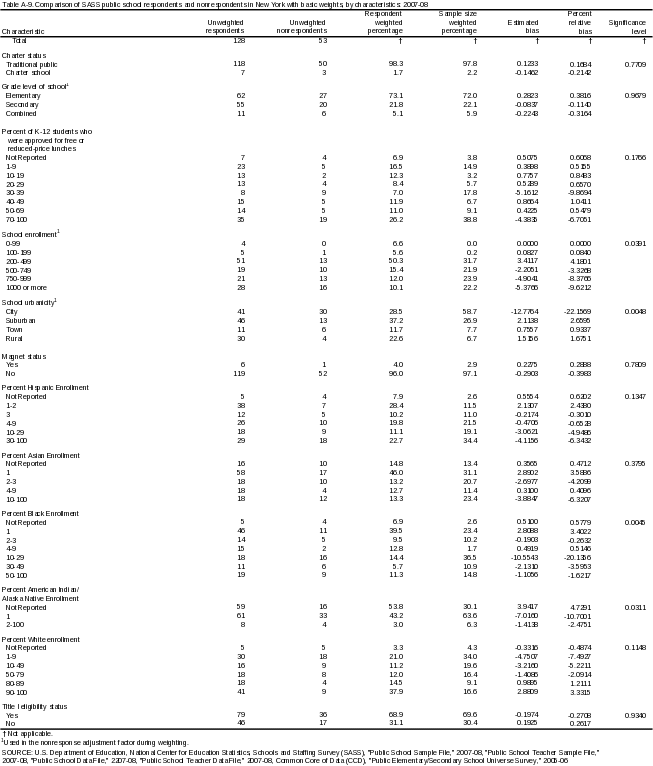
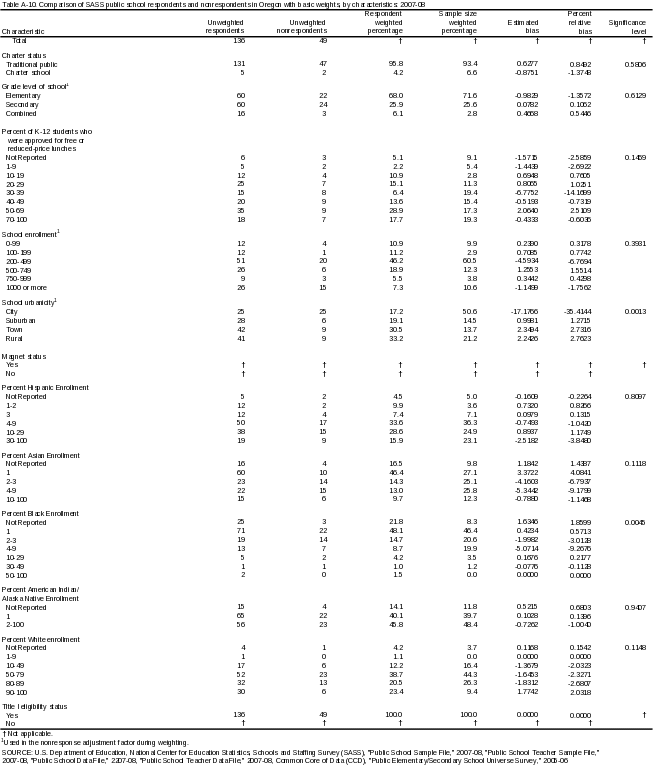
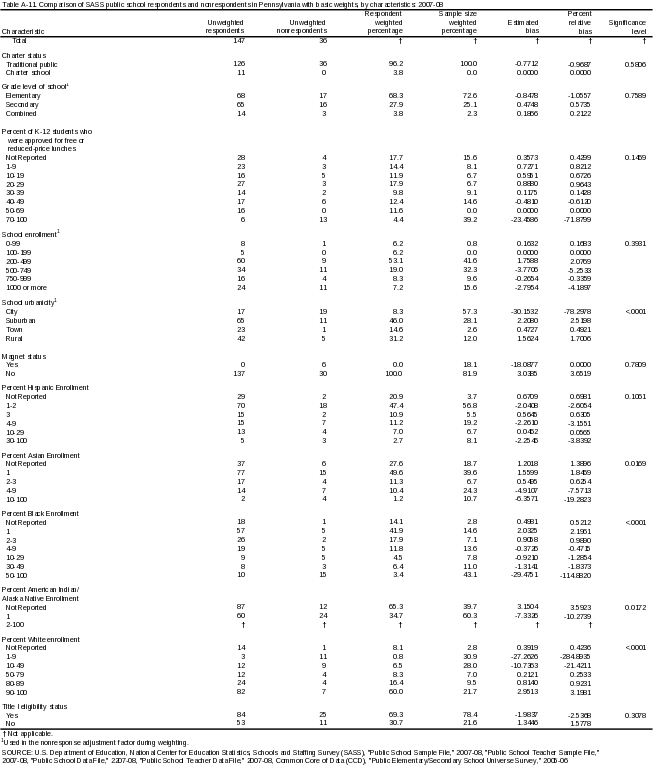
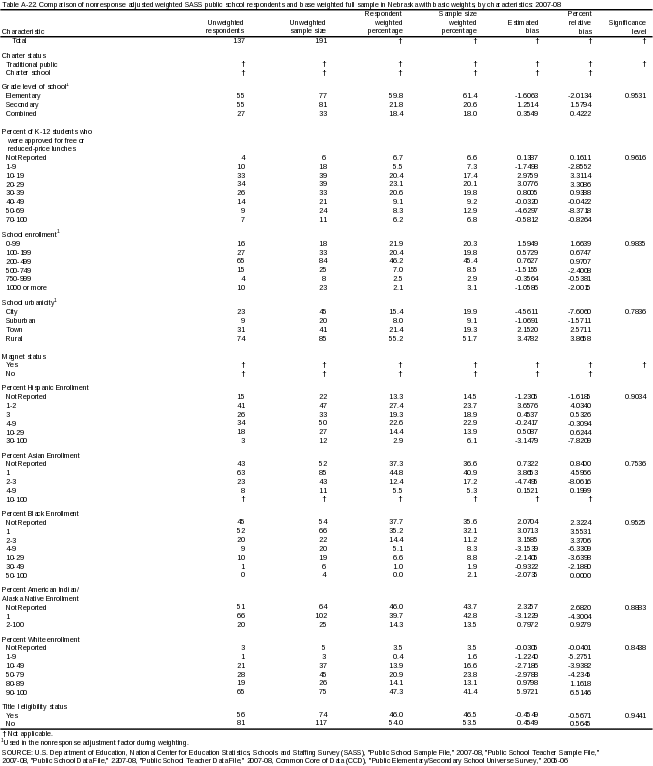
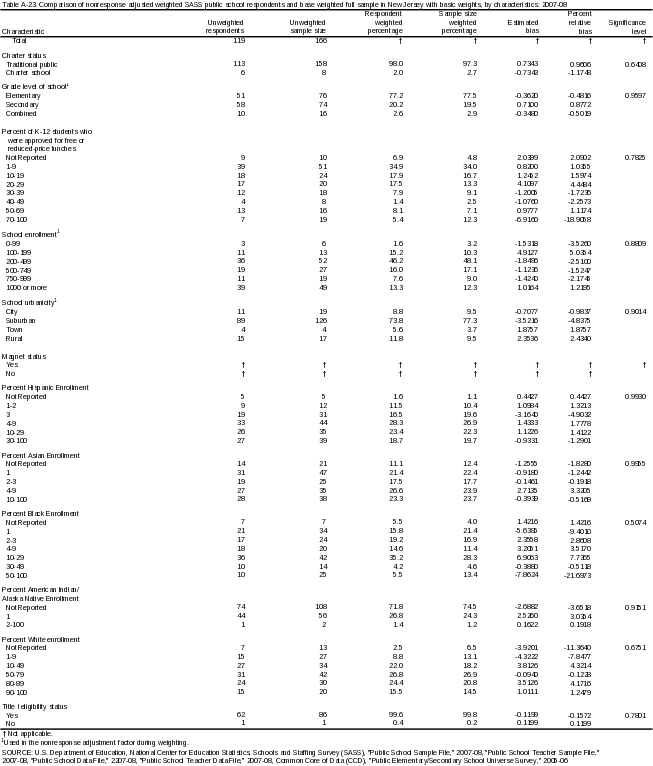
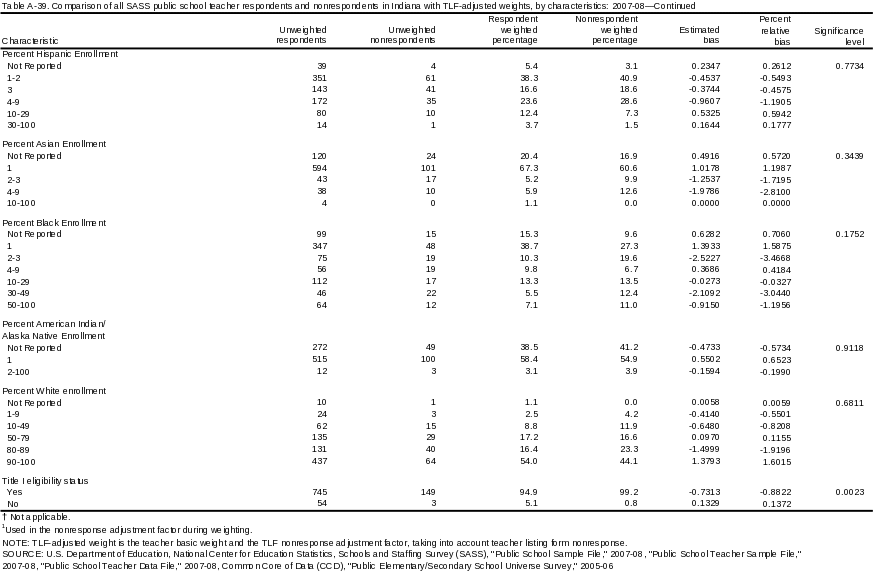
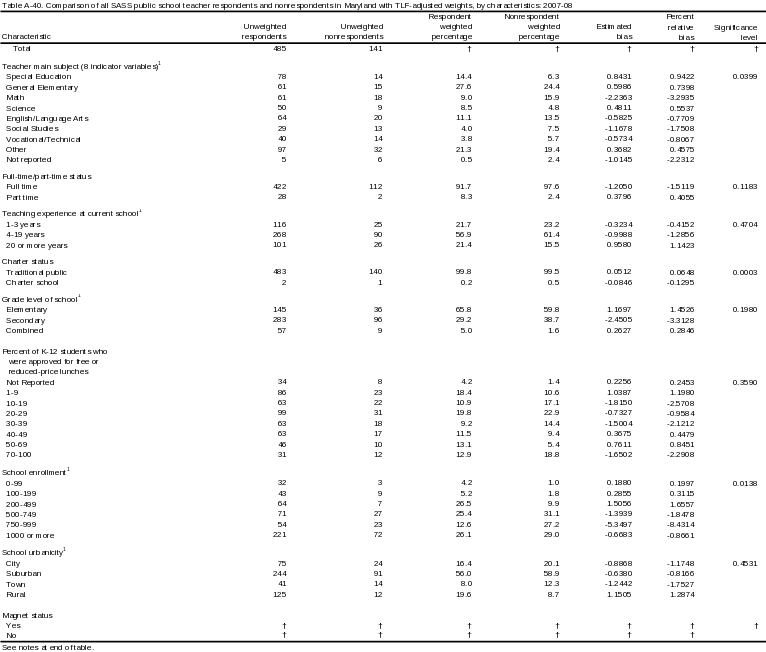
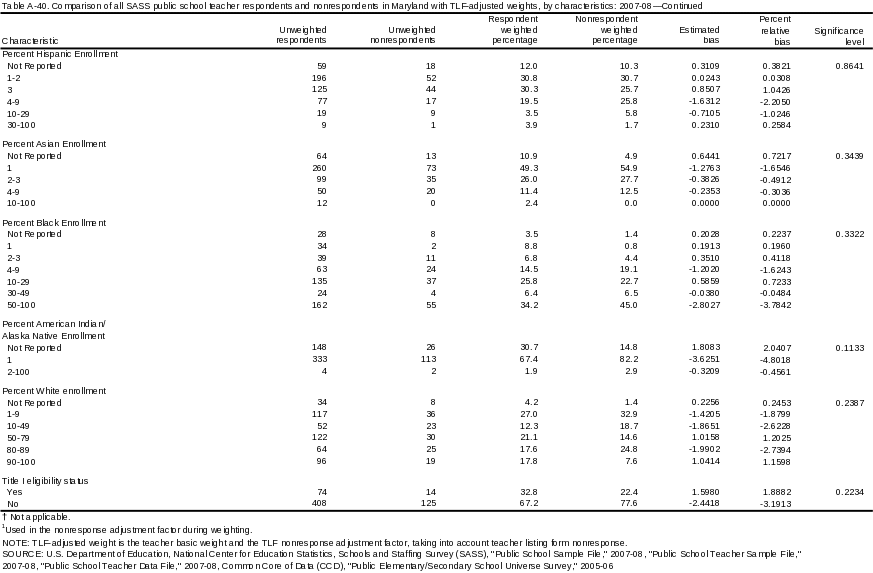
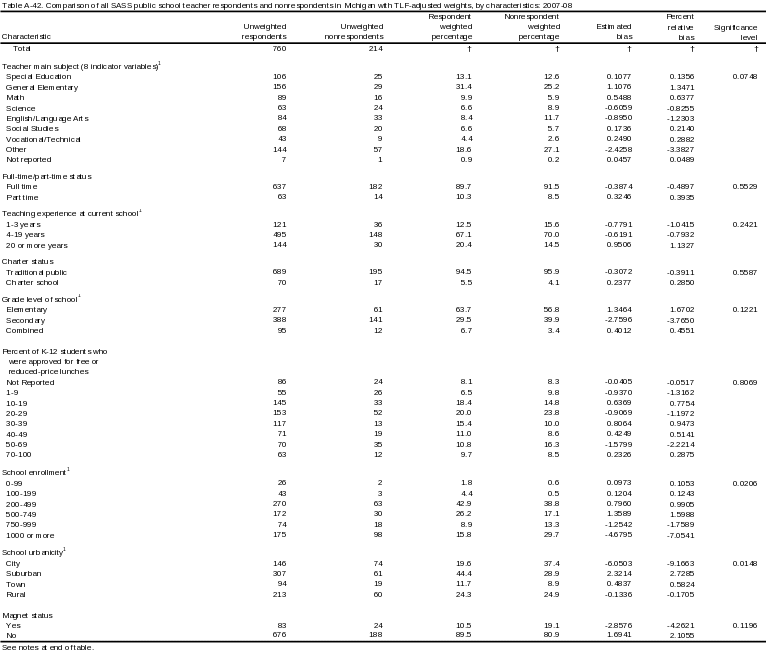
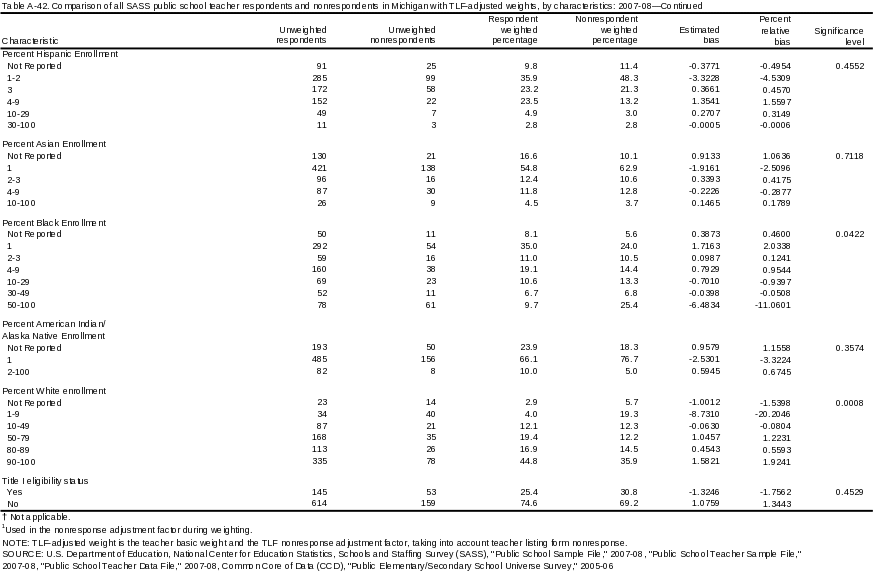
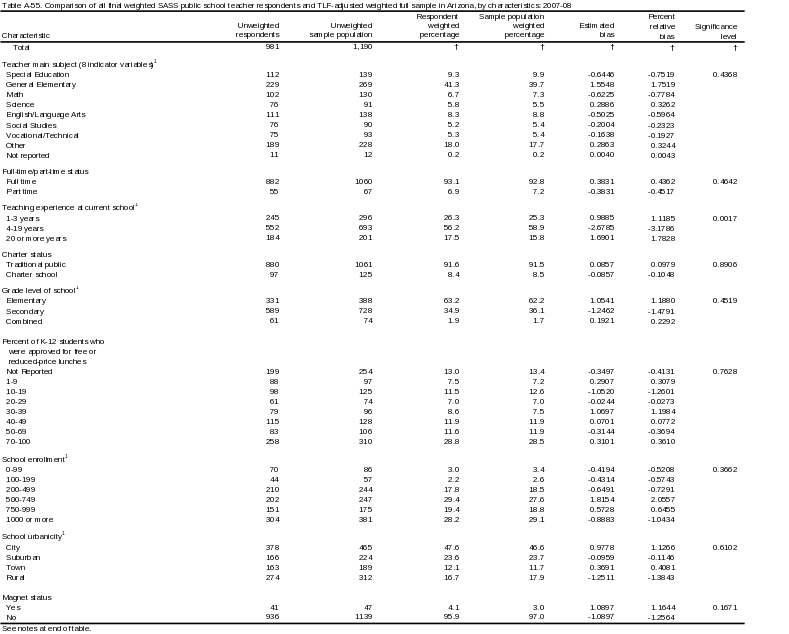
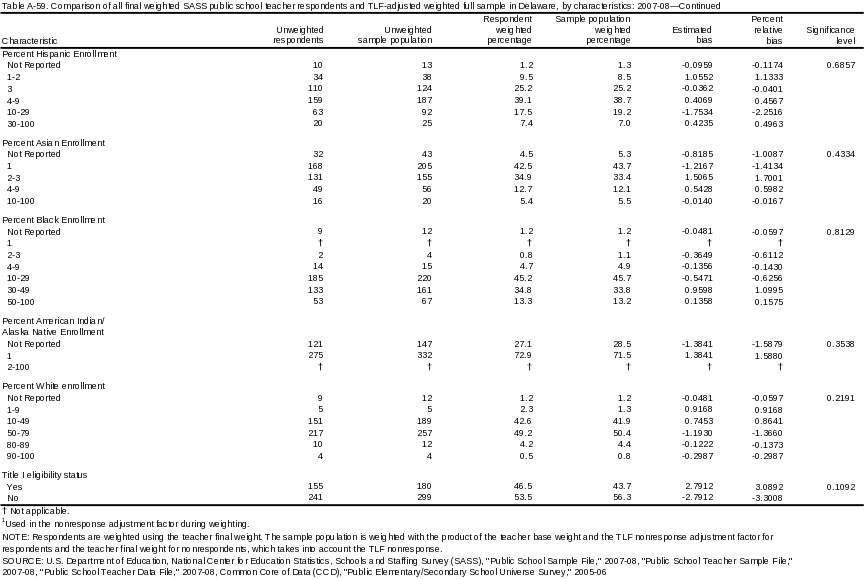
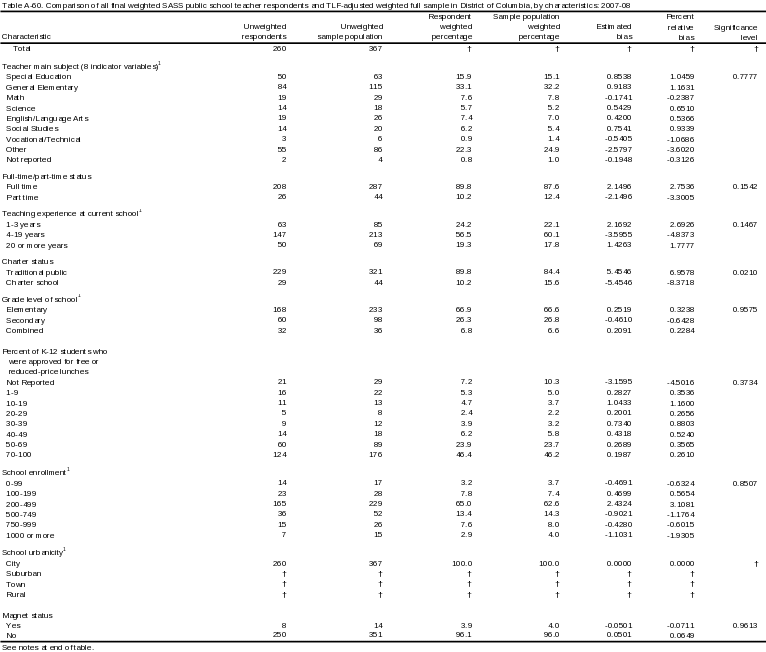
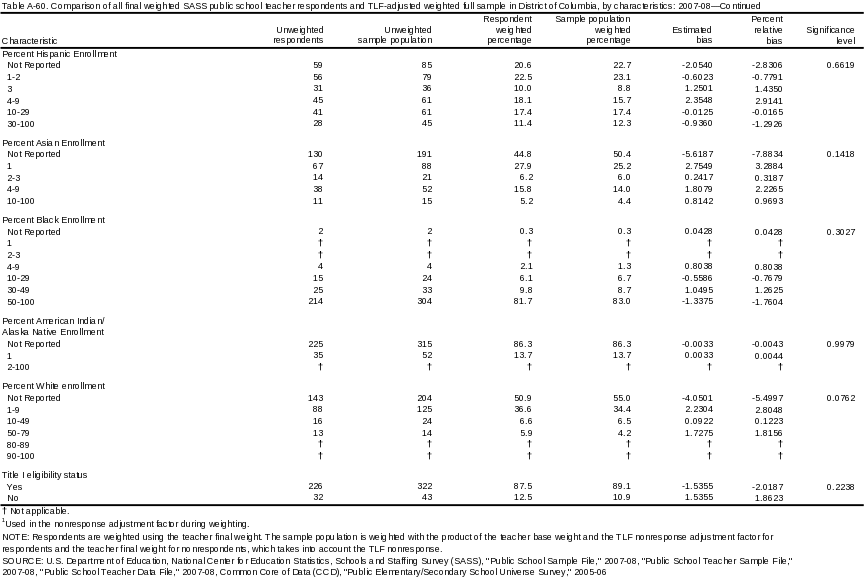
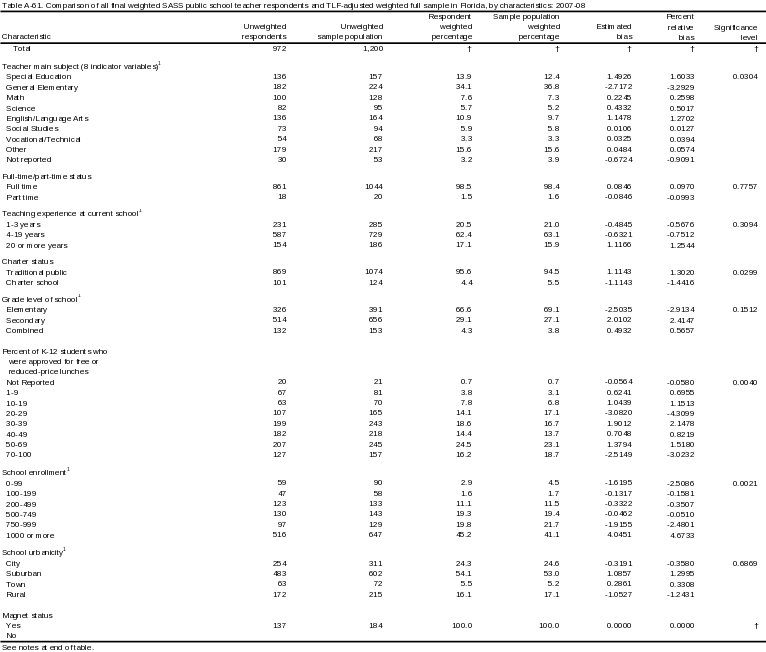
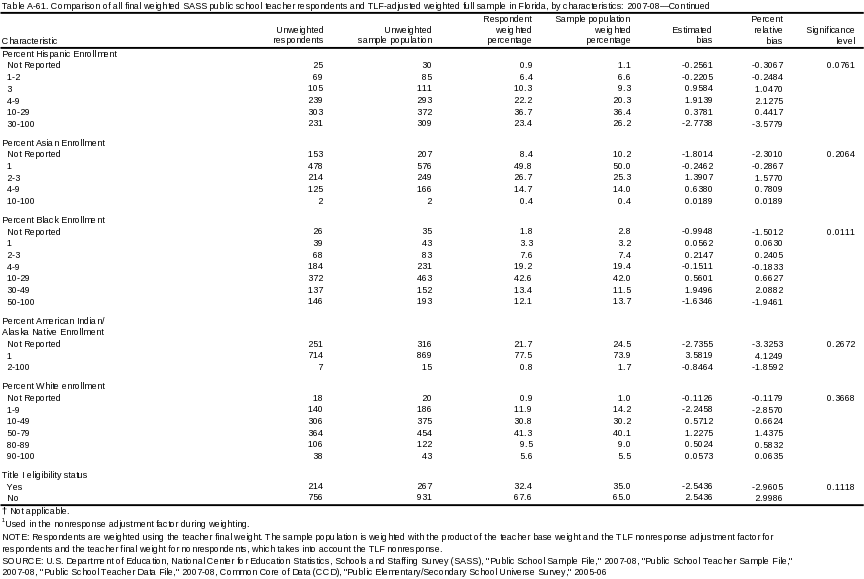
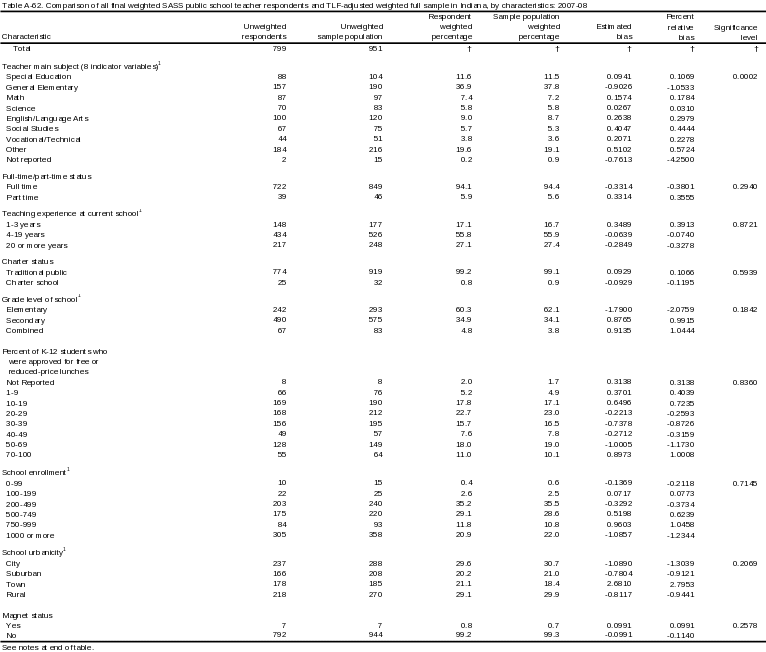
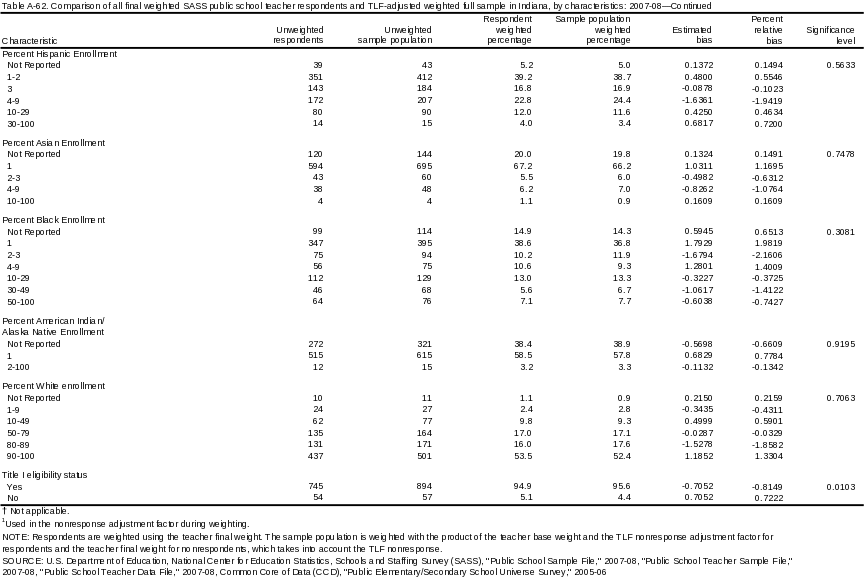
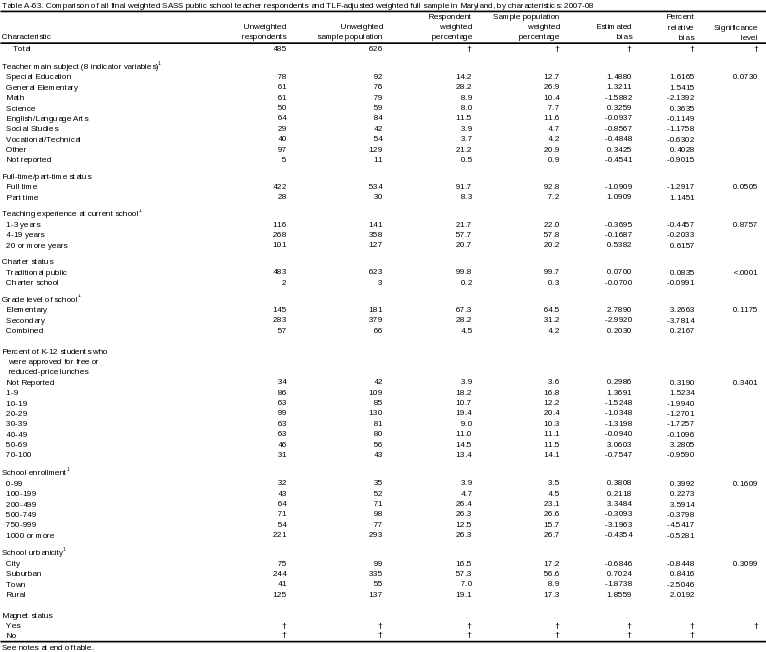
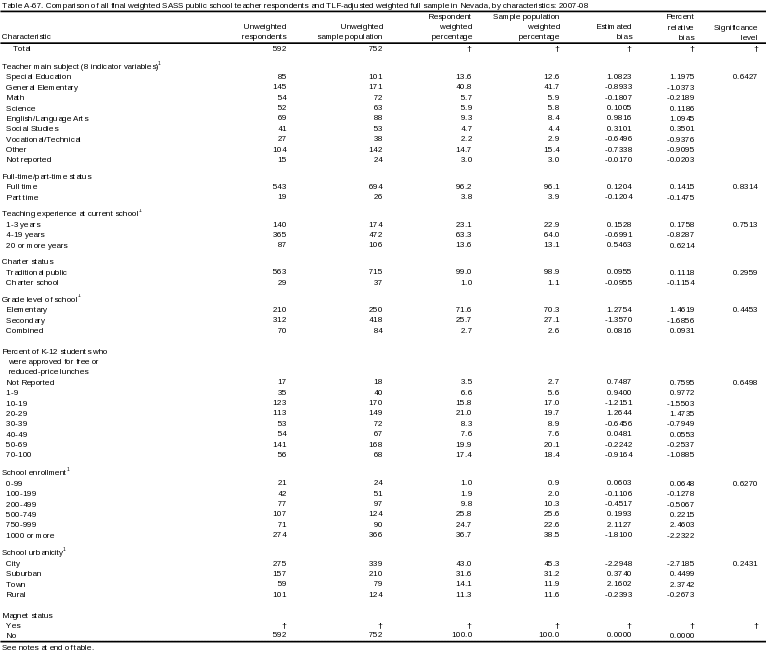
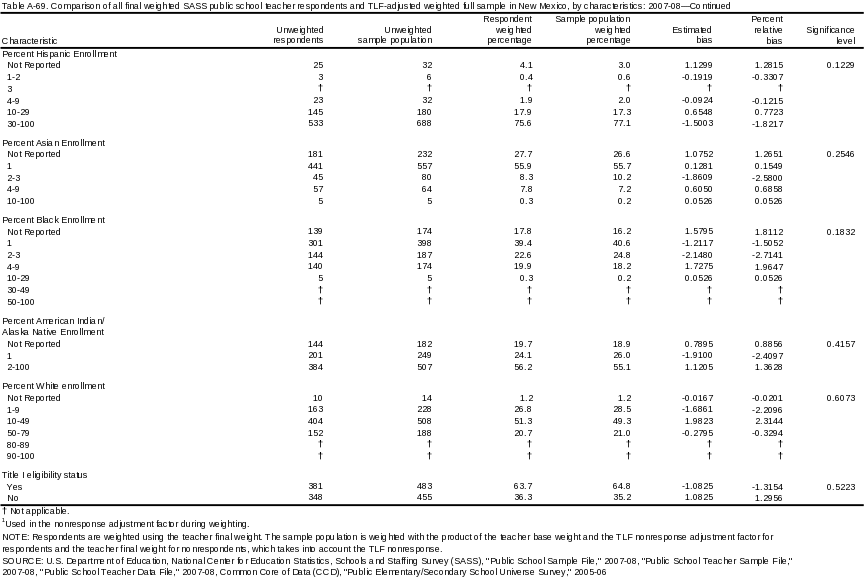
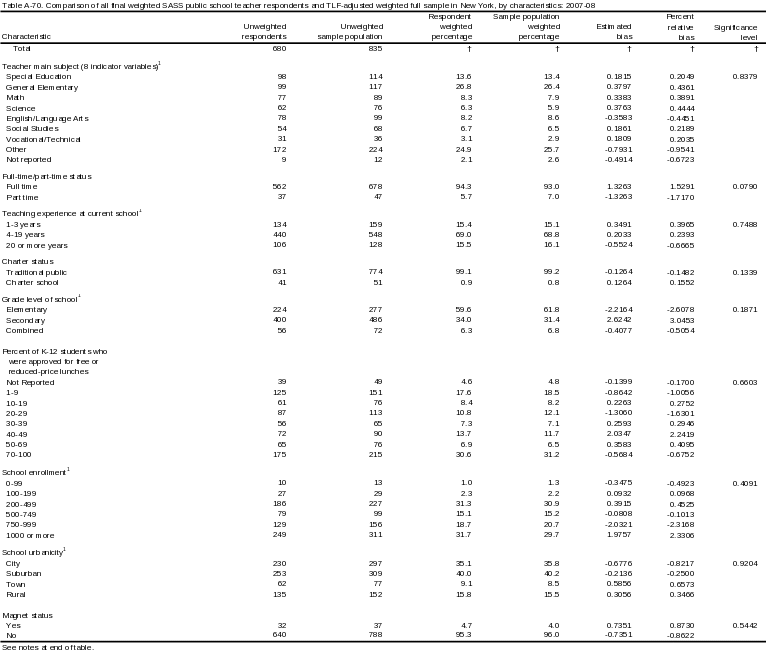
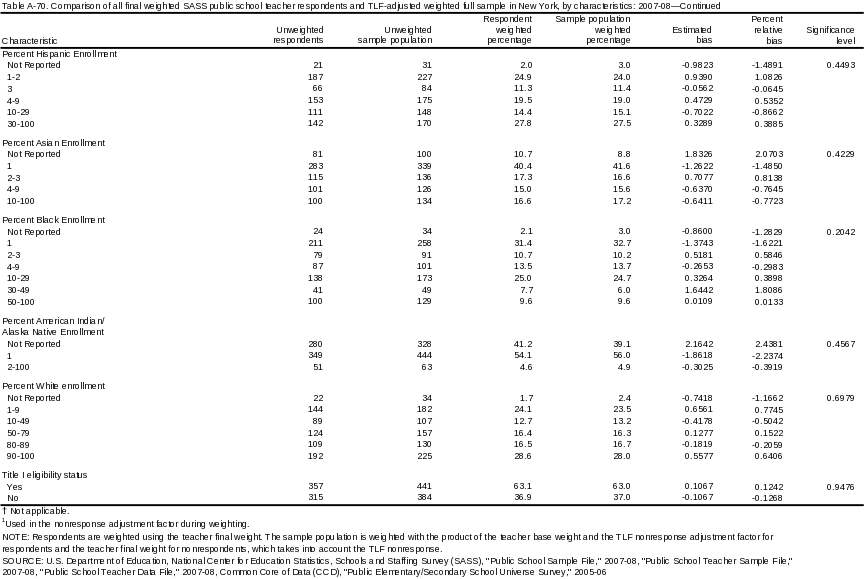
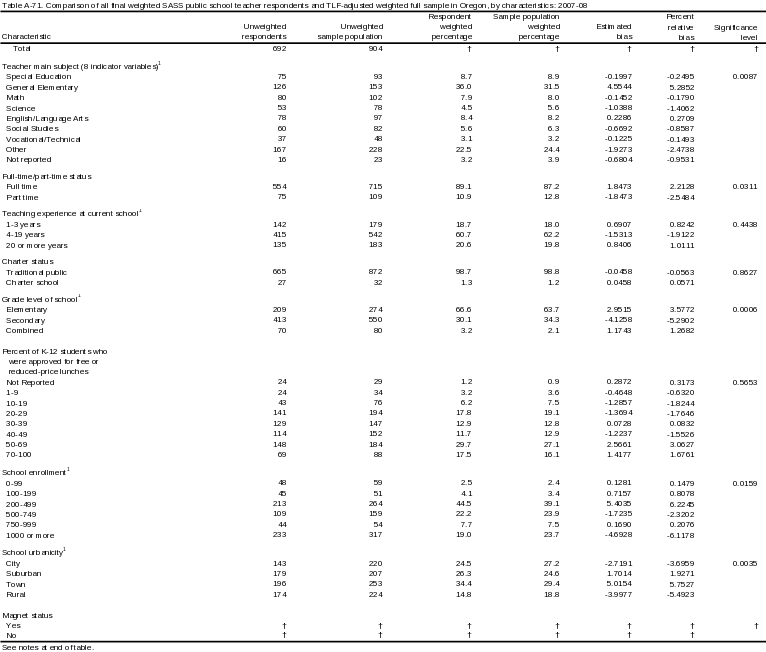
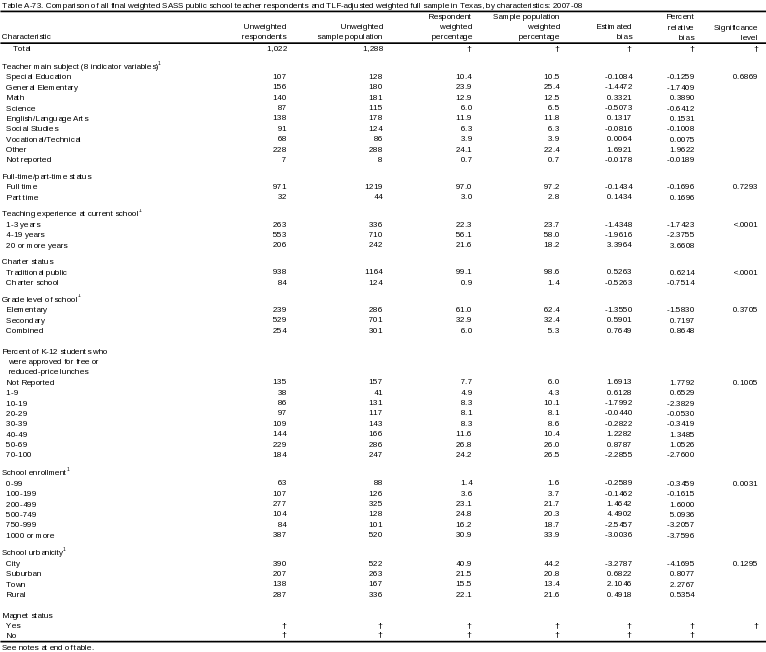
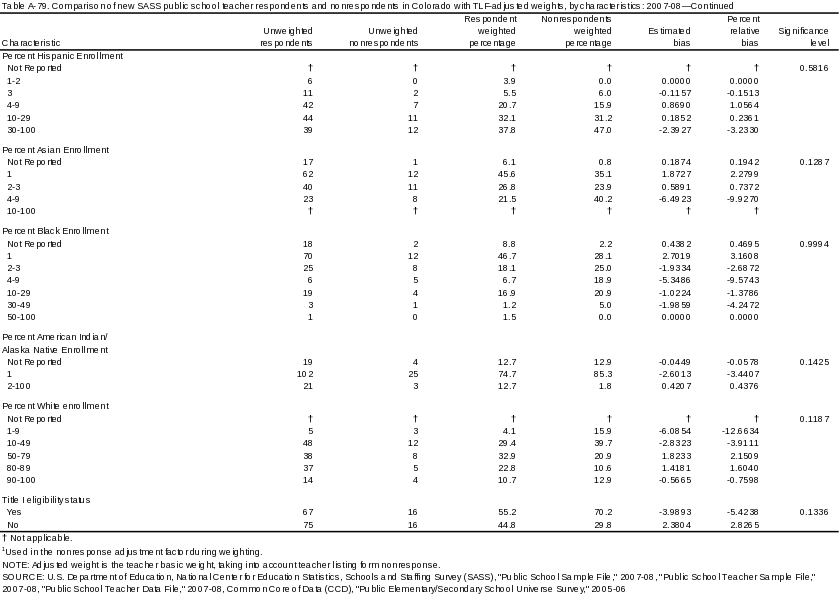
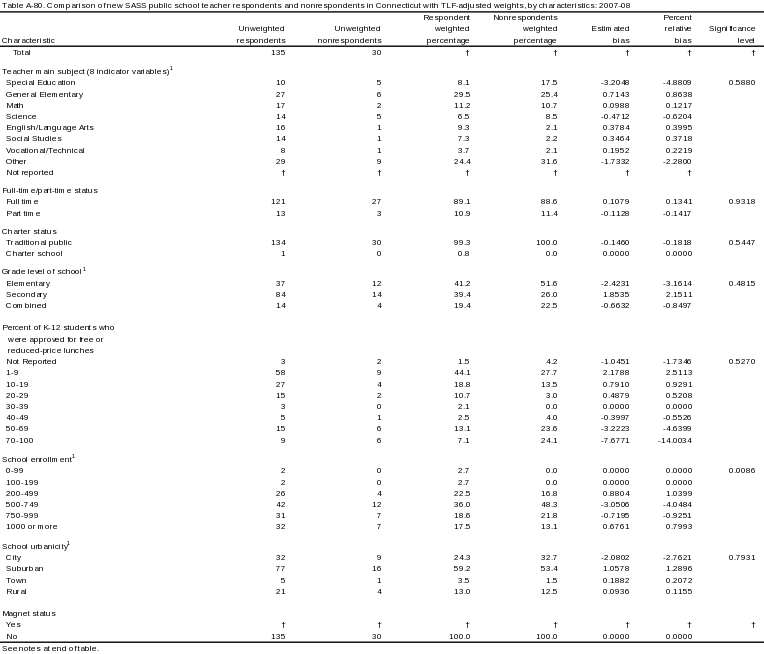
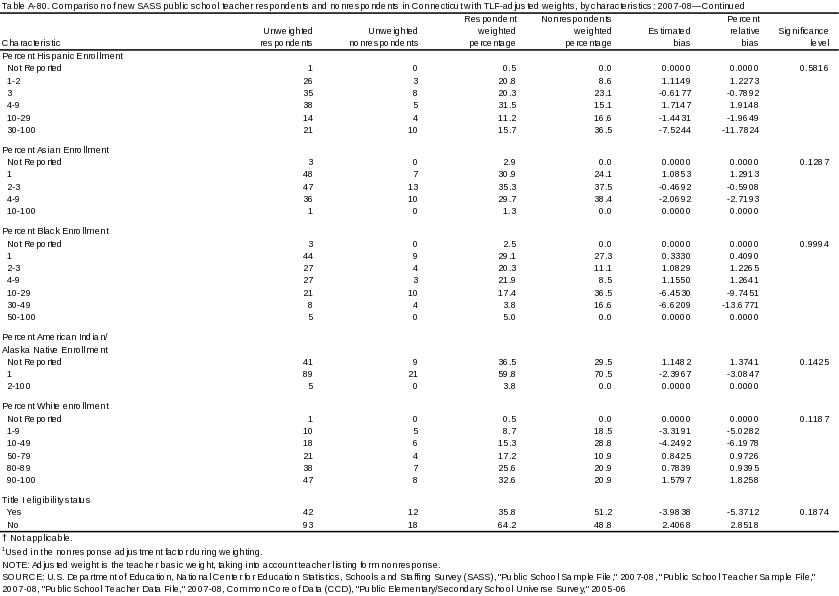
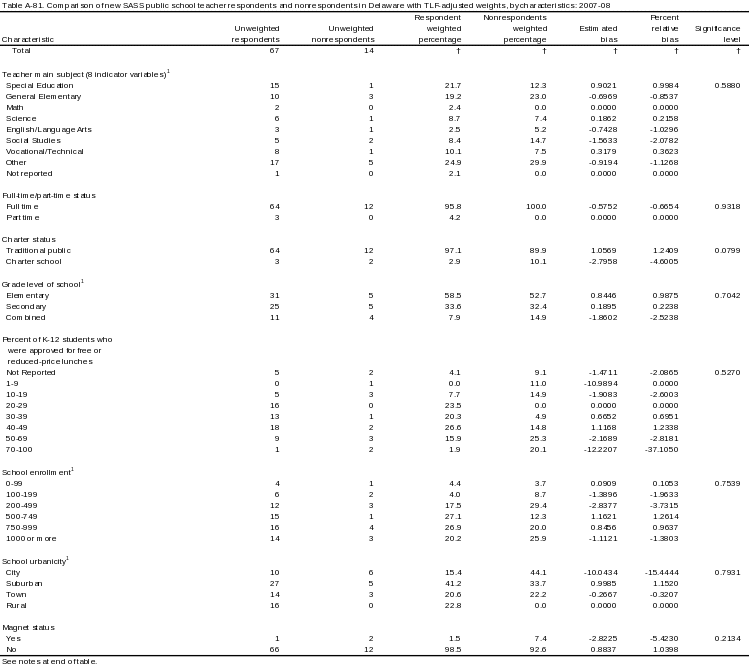
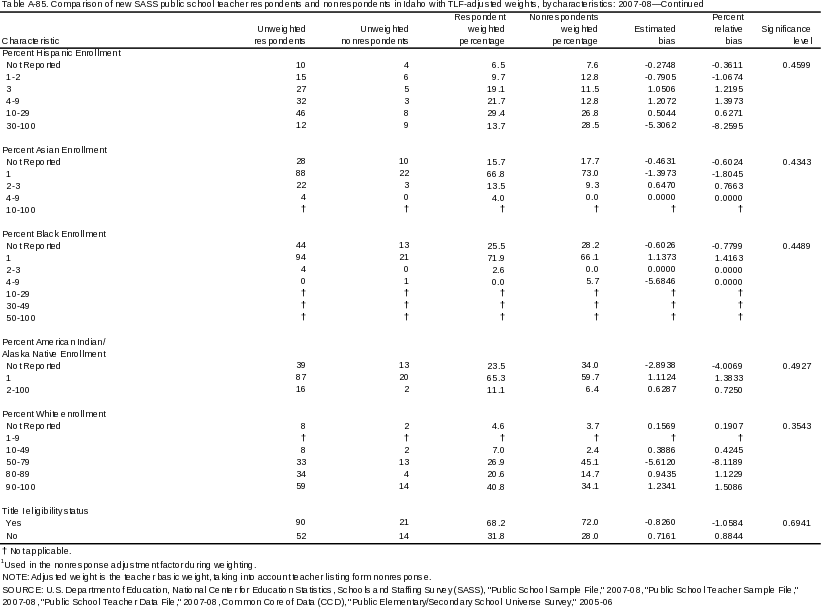
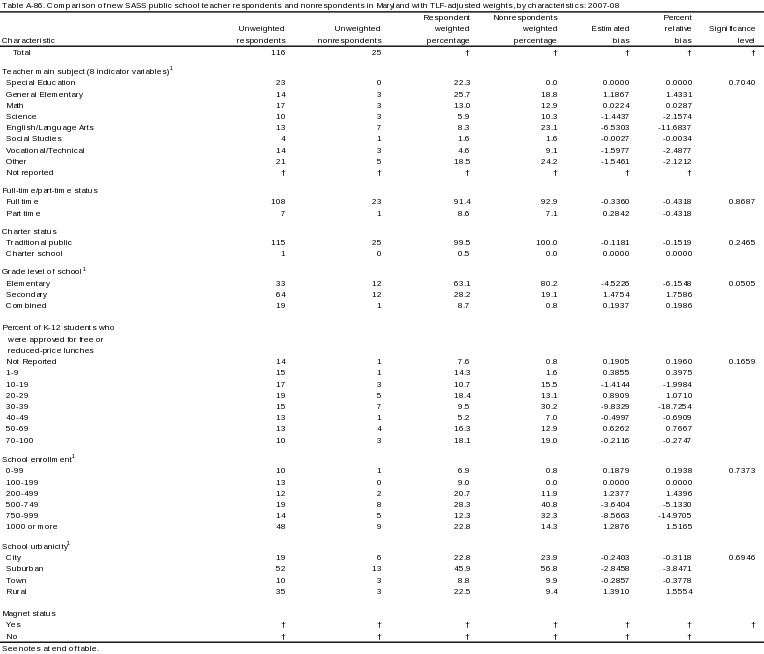
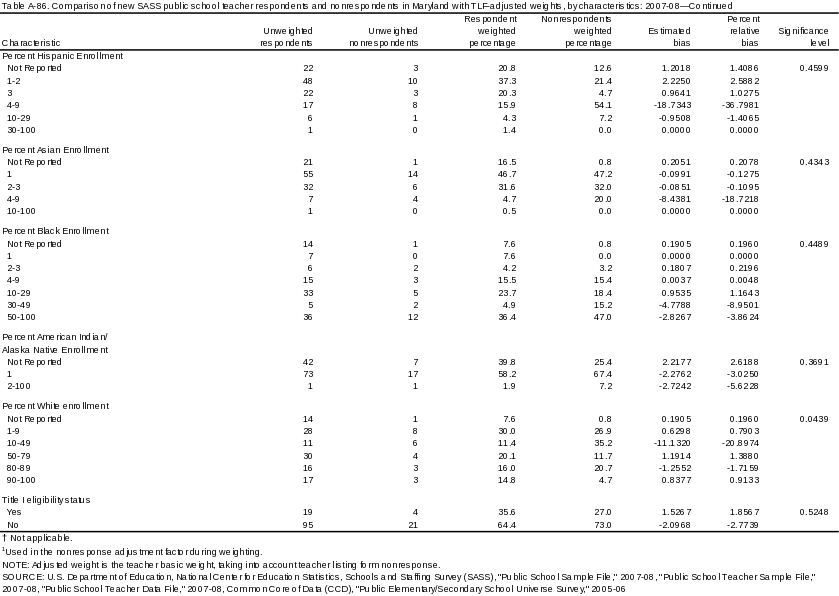
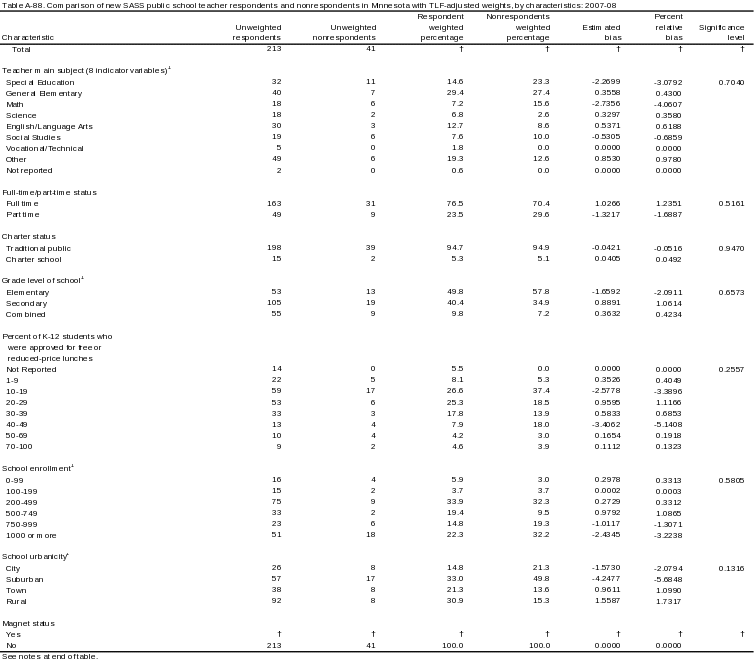
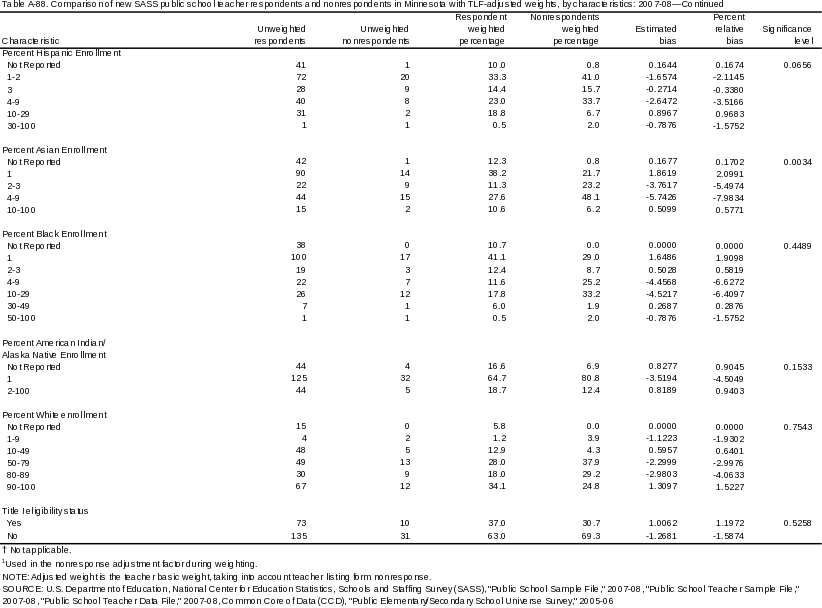
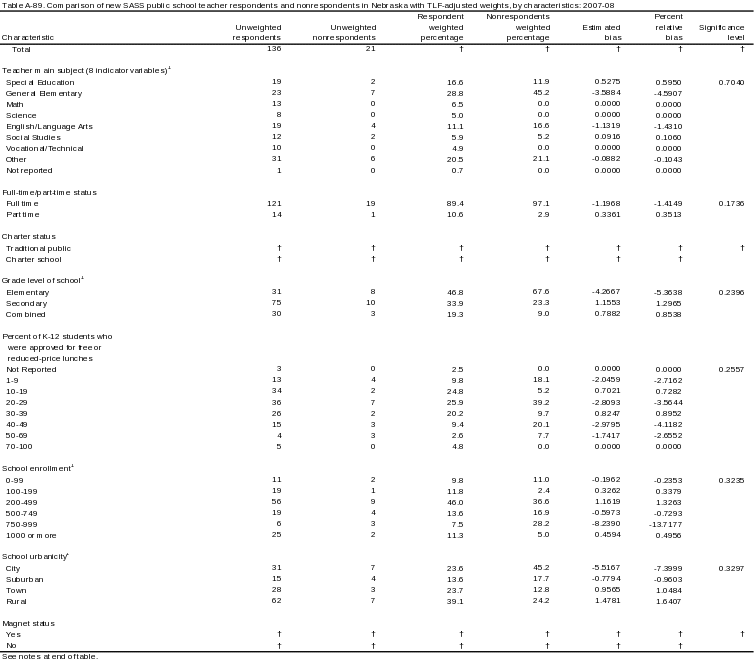
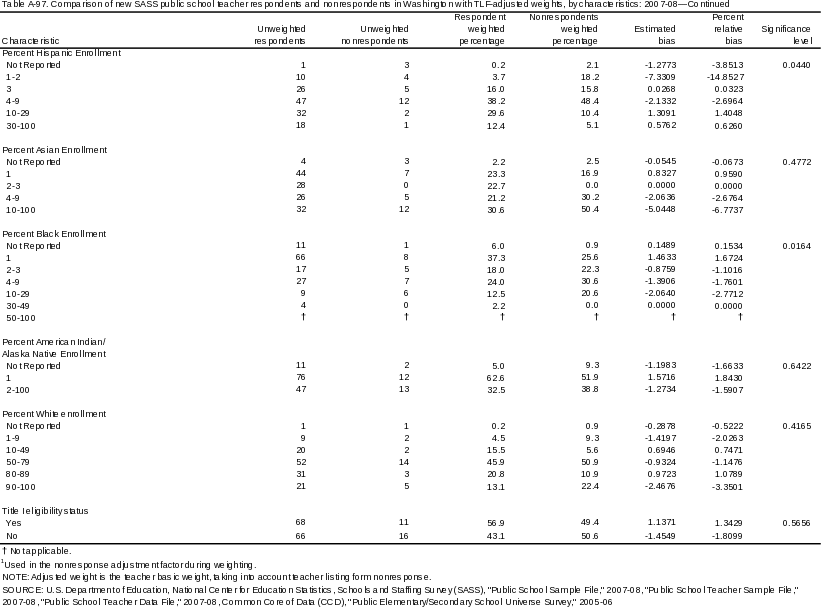
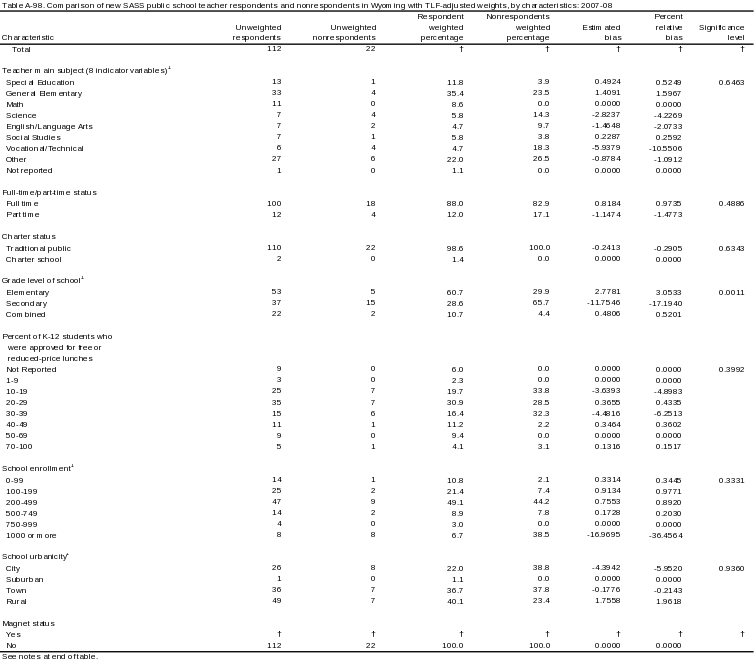
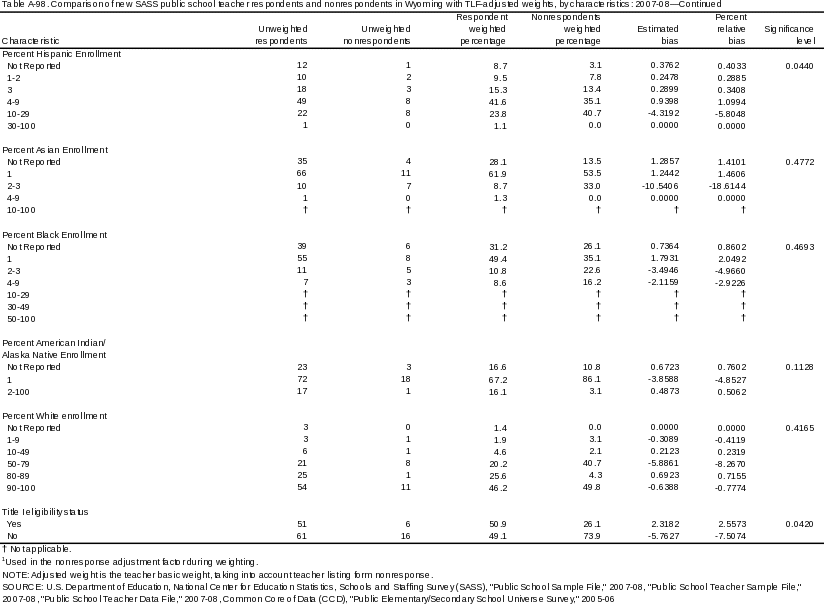
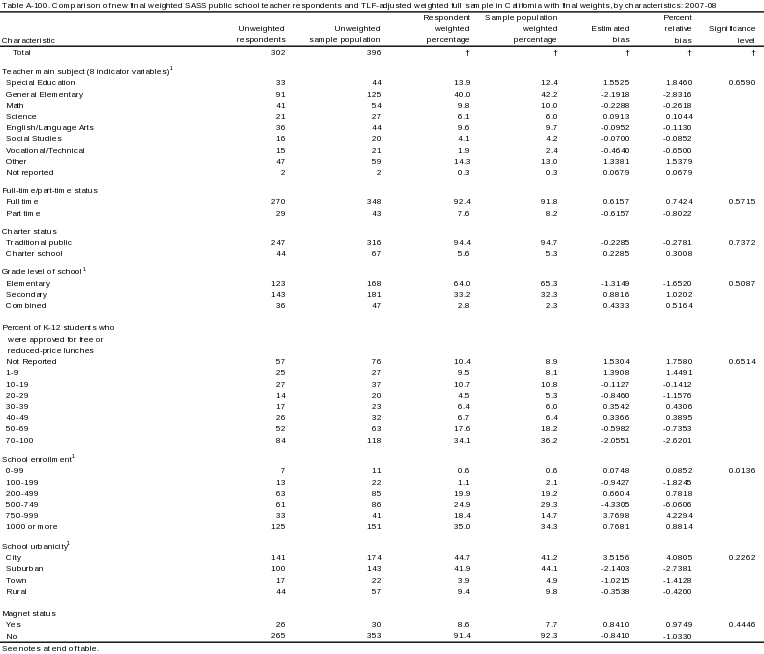
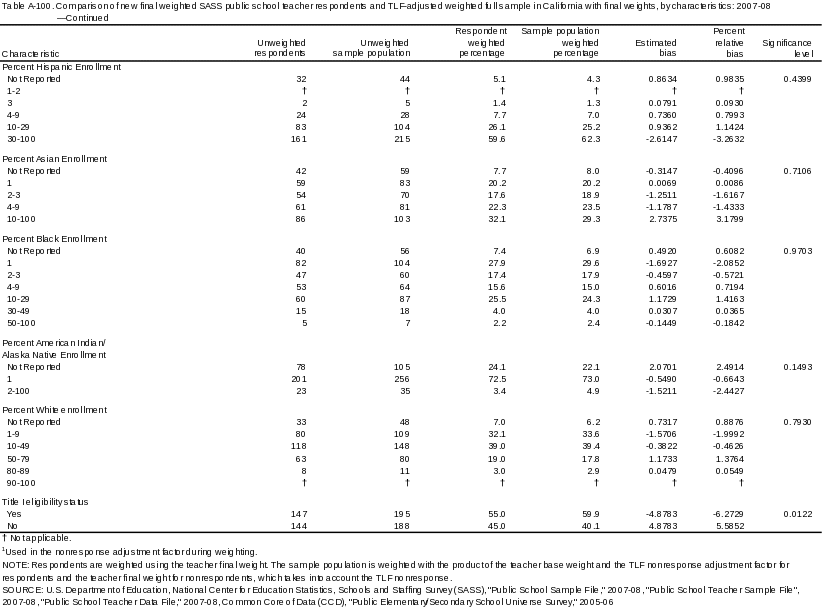
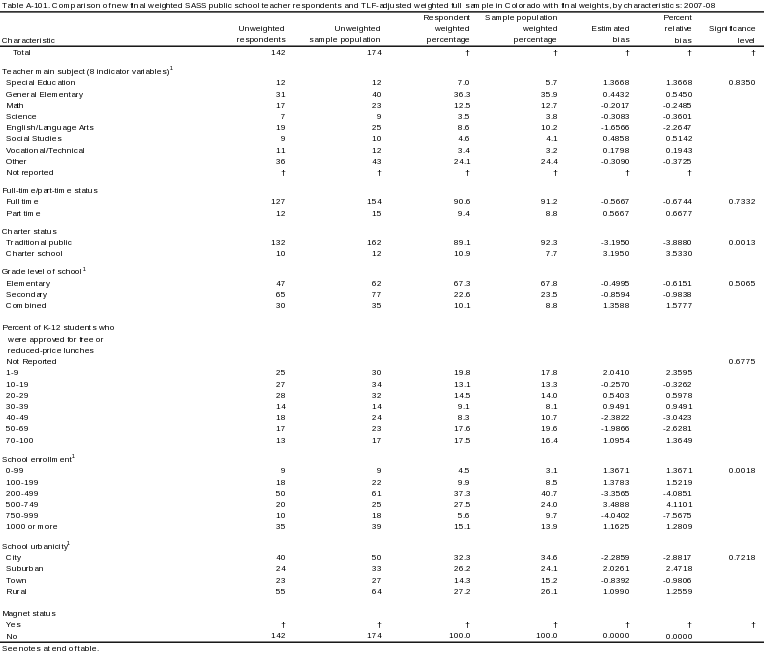
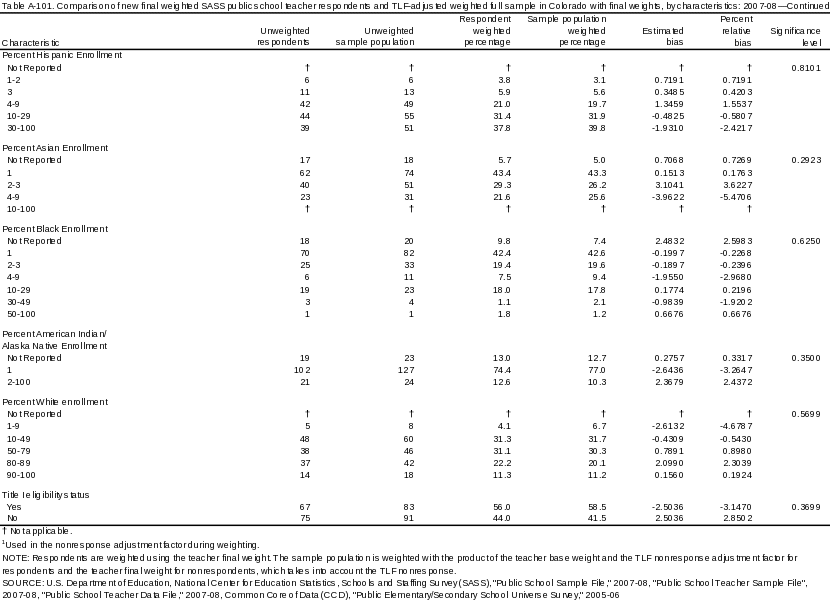
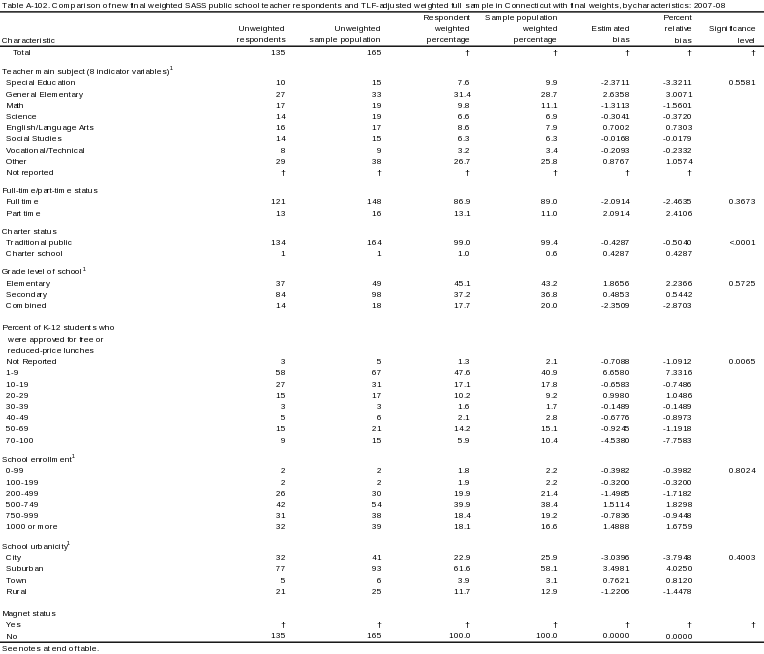
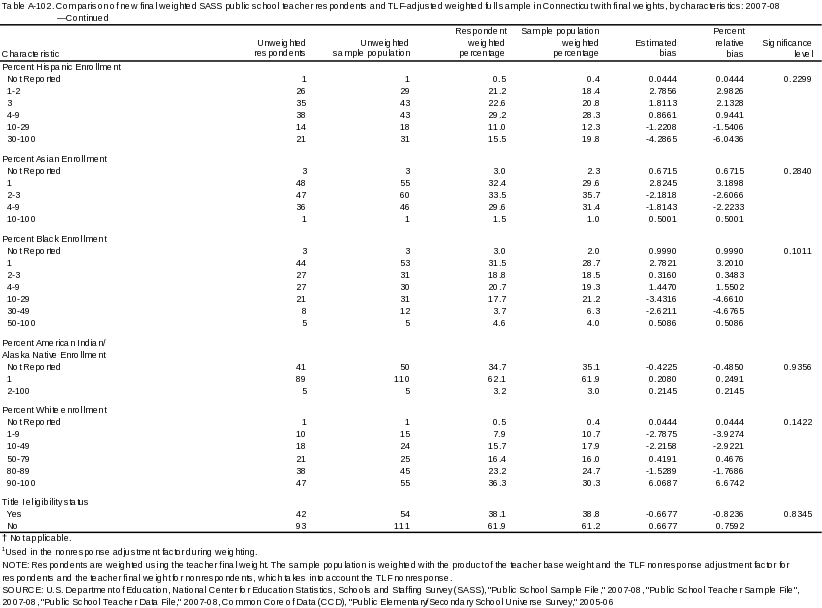
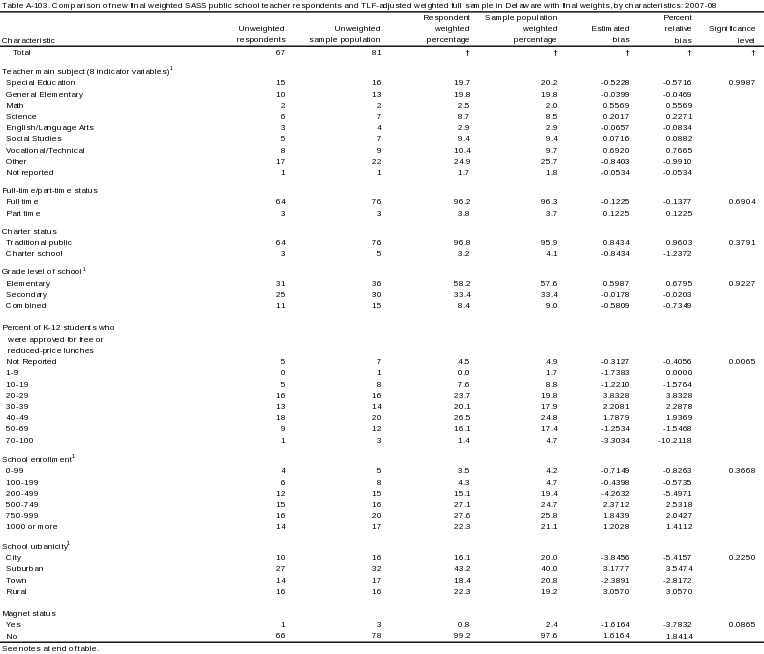
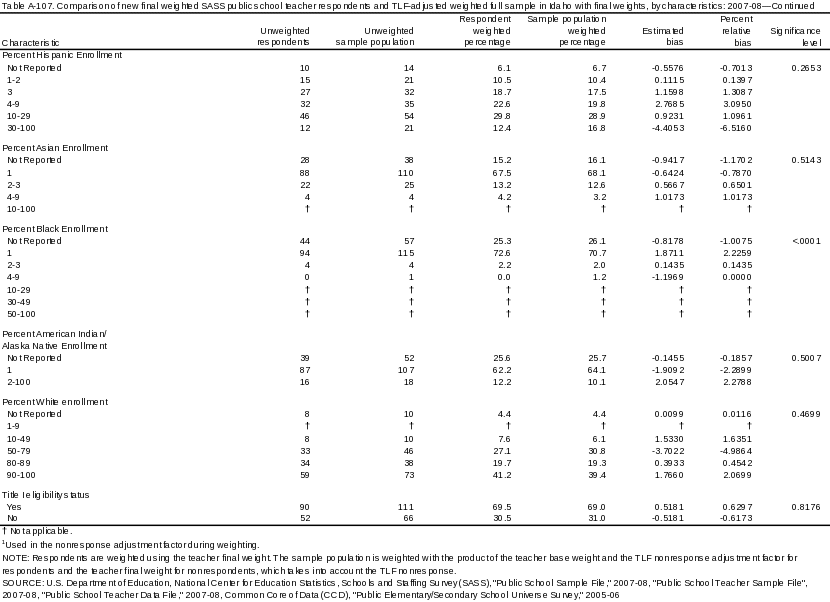
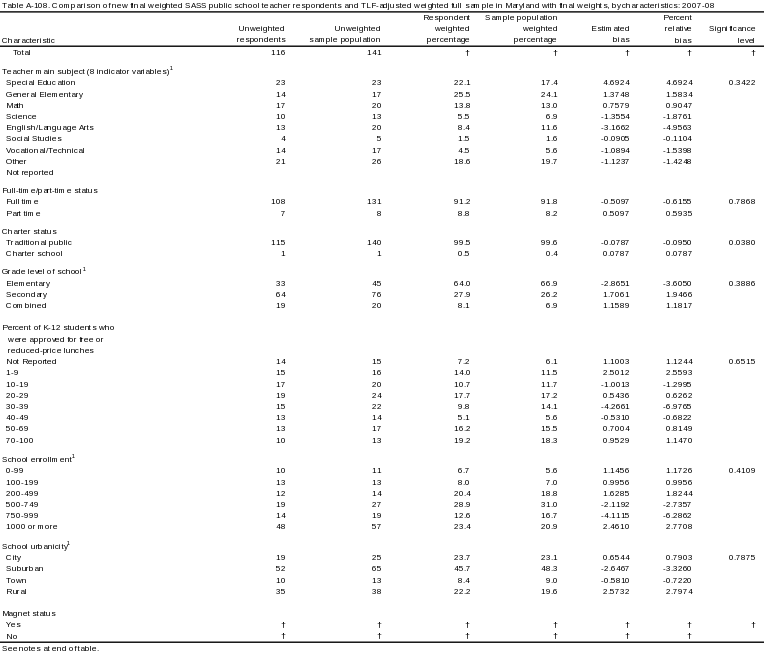
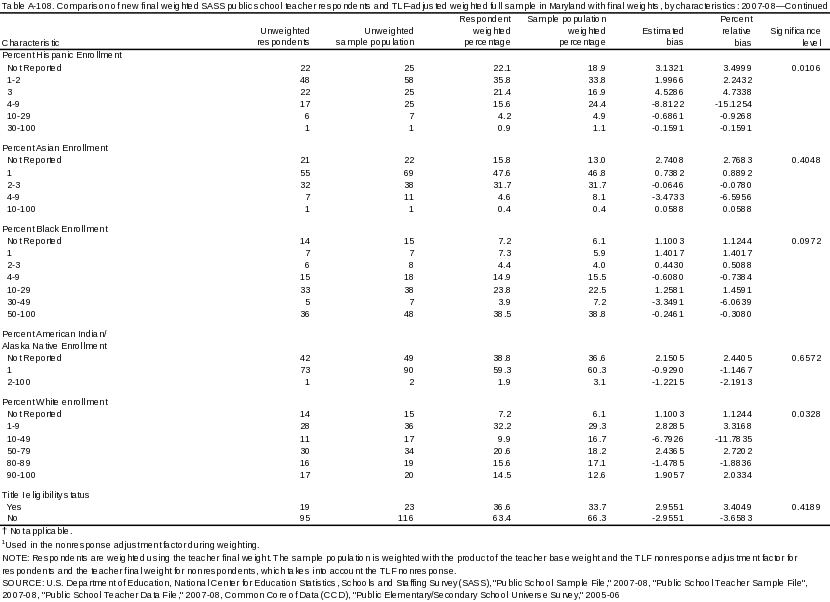
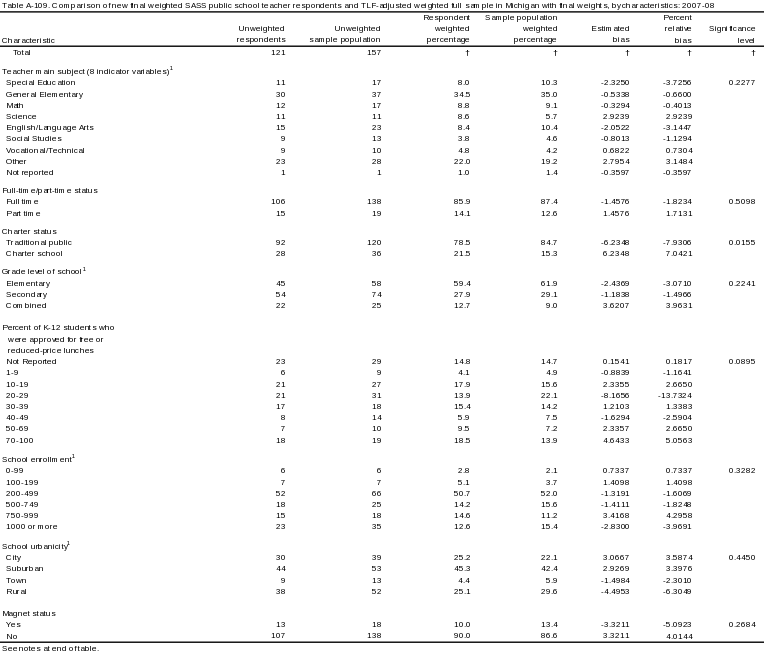
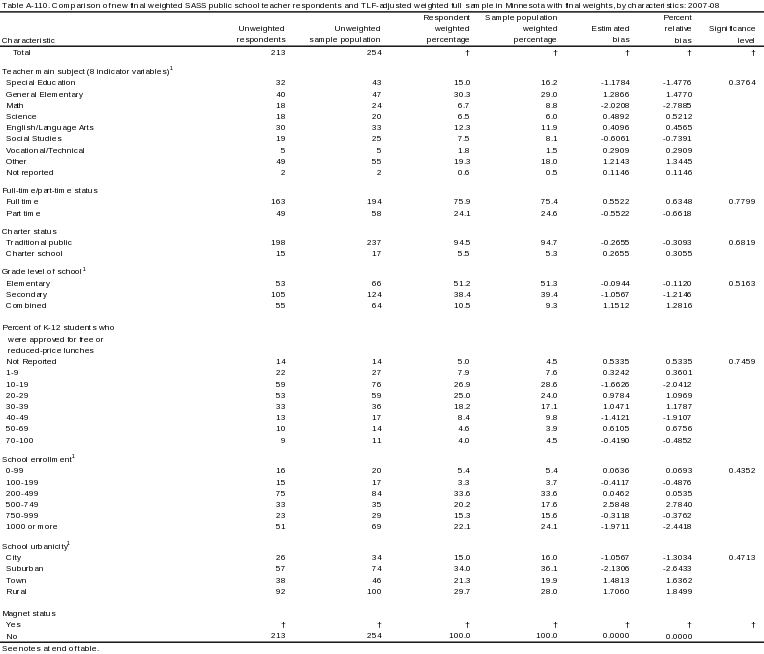
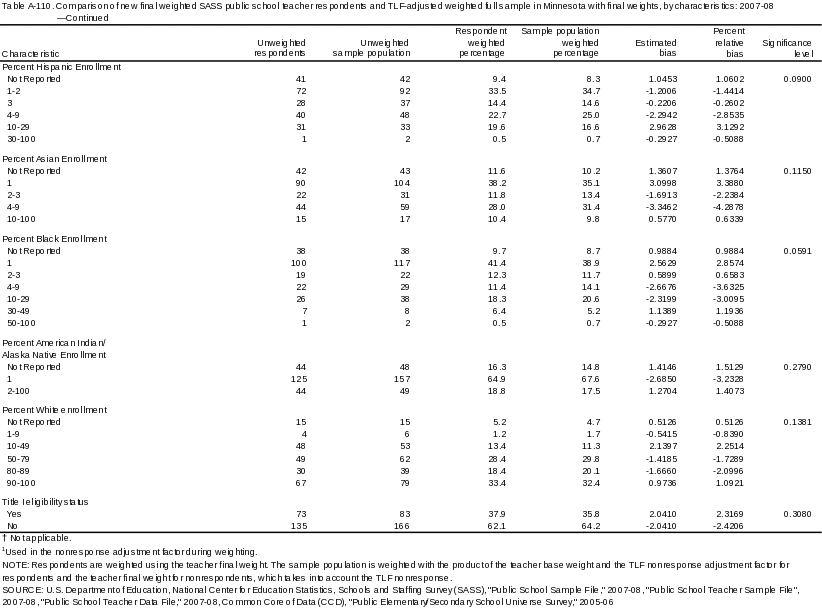
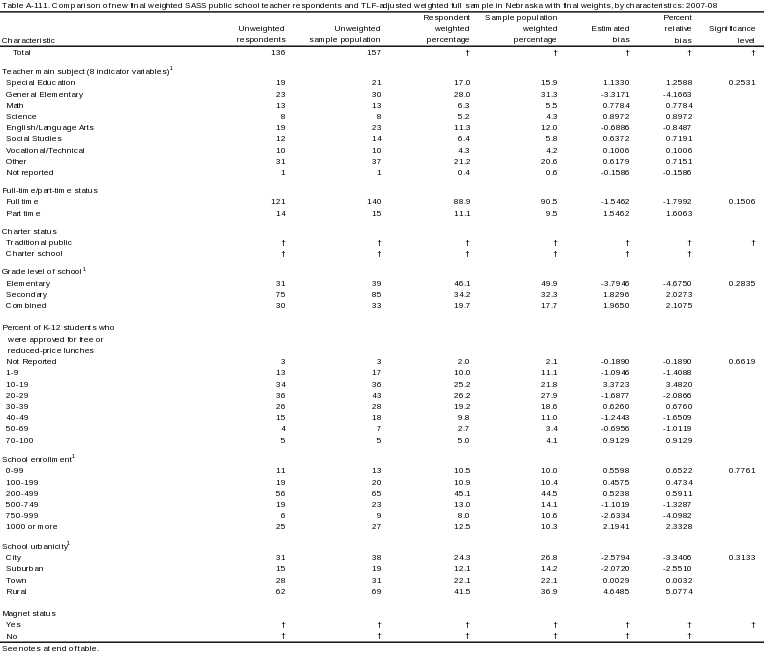
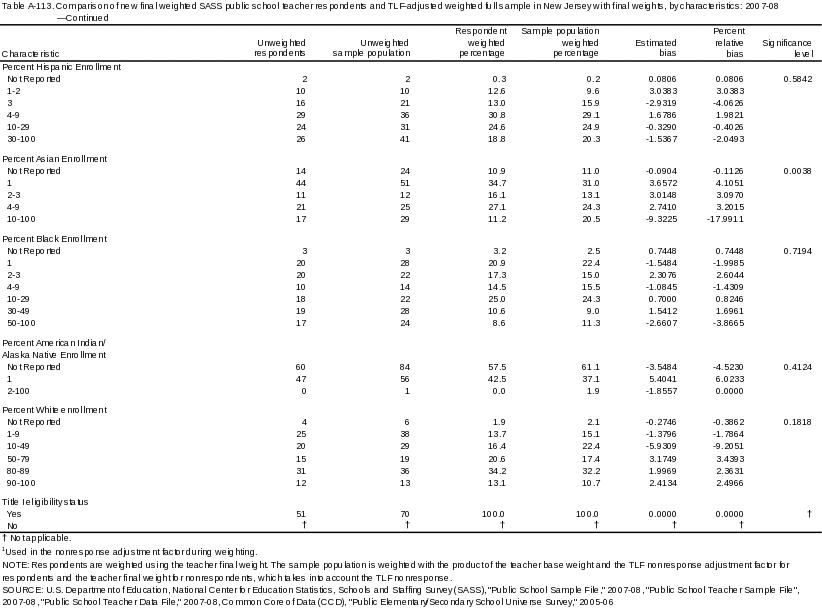
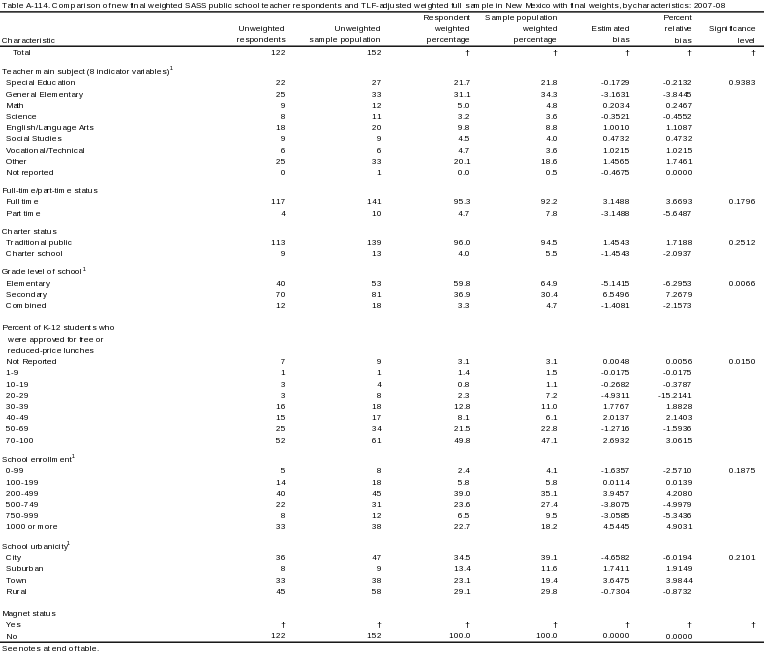
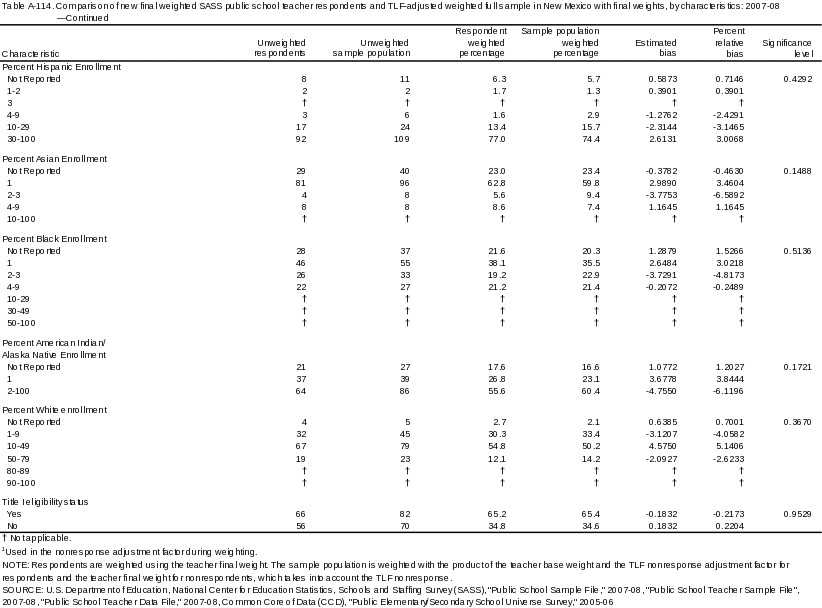
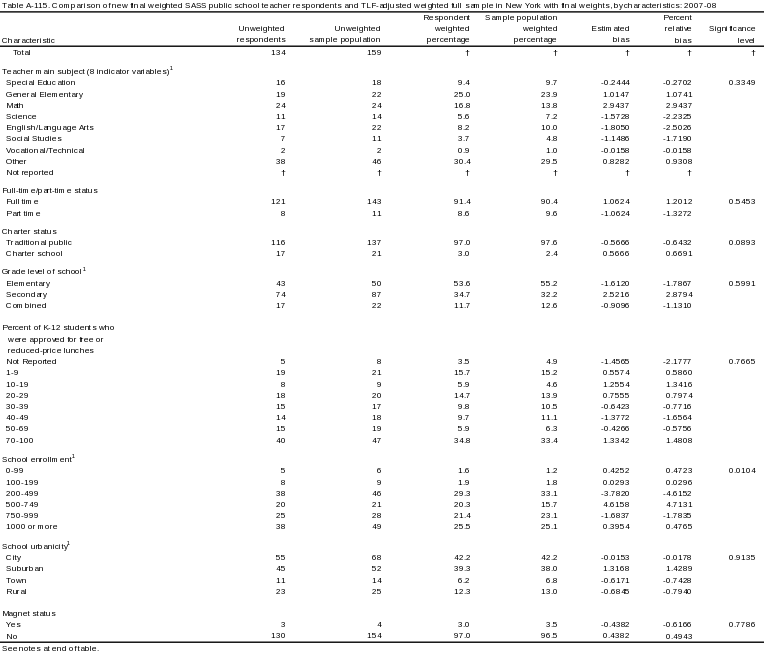
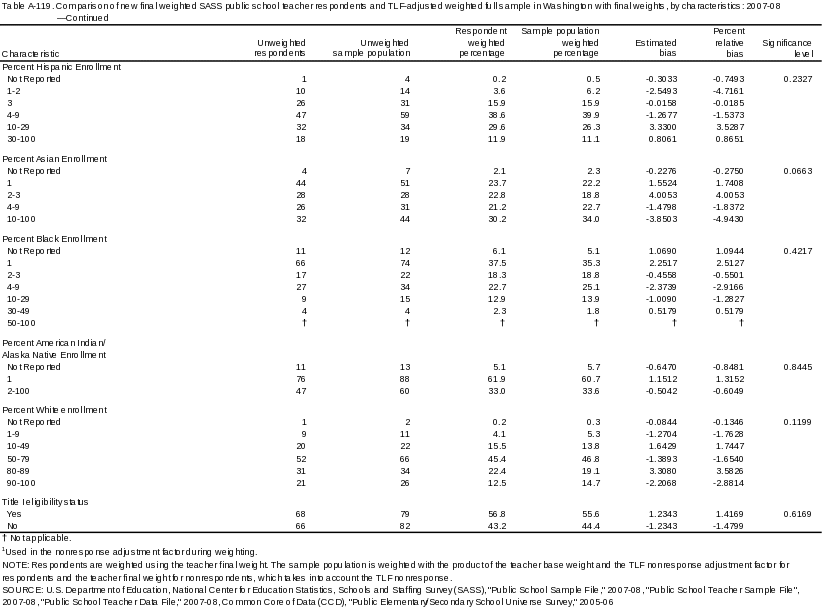
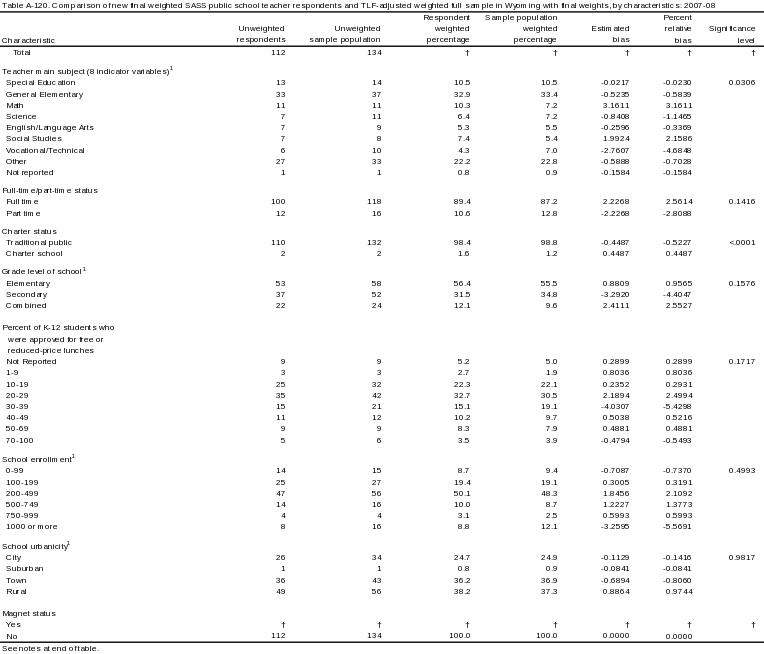
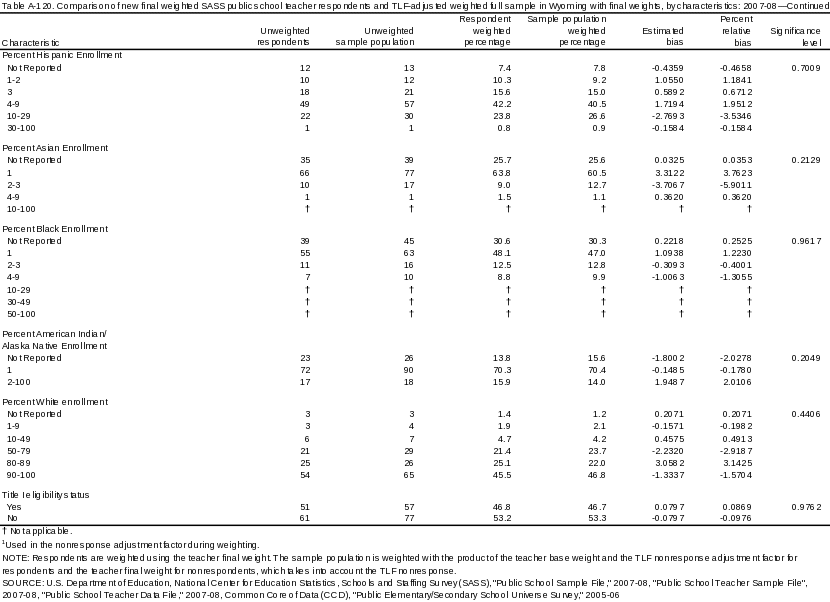
The first two columns of data show the unweighted count of schools or teachers in the relevant characteristic category for respondents and nonrespondents (for base-weighted tables) or the eligible sample population (for nonresponse-adjusted or final-weighted tables), respectively. These two columns show the unweighted response and nonrespondent or sample numbers for each characteristic category. These columns show the cell size for each category.
The third and fourth columns of data show the weighted proportions of each characteristic category for the respondent and nonrespondent or sample populations, respectively. These columns show the proportion of the total population that each category represents. Differing proportions between the respondent and nonrespondent or sample populations suggest nonresponse bias. These proportions are used in the calculation of the next two columns, estimated and percent relative bias.
The estimated and percent relative bias columns show the result of the nonresponse bias analysis for each characteristic category. The formulas for these two bias calculations can be found in the methodology section above. For the base-weighted tables, estimated bias is the difference of proportions between the weighted respondent and nonrespondent, which is then multiplied by the weighted nonresponse rate. For the final-weighted tables, estimated bias is the difference of proportions between the weighted respondent and sample populations. This shows the magnitude of difference between the respondent and nonrespondent or sample populations, or in other words, how different the respondent and nonrespondent or sample populations are, based on a particular characteristic. Percent relative bias is the estimated bias divided by the weighted respondent proportion. This shows the magnitude of bias on a percent scale, which can then be compared against the percent relative bias values of other characteristics. For instance, if one characteristic has a percent relative bias value of 0.5 and another characteristic’s value is 0.3, we can say that there is a higher level of bias based on characteristic one than characteristic two. We considered any percent relative bias with an absolute value of 5 or greater to be significantly high and an absolute value of 2.0-4.9 as moderate.
Finally, the last column of data shows the results of the chi-square test for each characteristic. This test compared the distribution of schools or teachers across each characteristic for the respondent and nonrespondent or sample populations. The value reported is the significance level of the test. Any value less than or equal to .05 is considered significant, and thus the distribution of the respondents and nonrespondent or sample population is significantly different. This means that, based on the chi-square distribution, the difference between the characteristics of the respondent and nonrespondent or sample populations is statistically significant (i.e., not random noise) and therefore suggests possible nonresponse bias.
Attachment 1: TLF State-Level Nonresponse Bias Tables
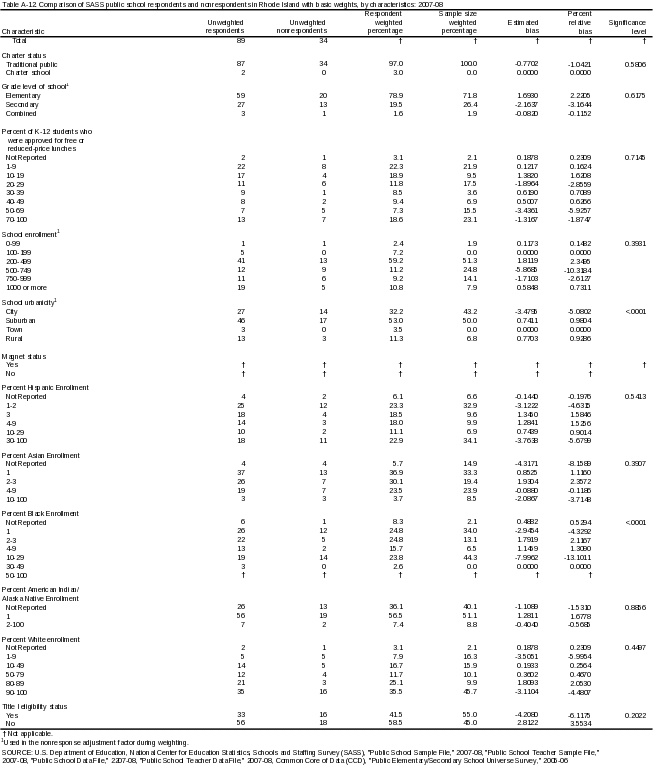
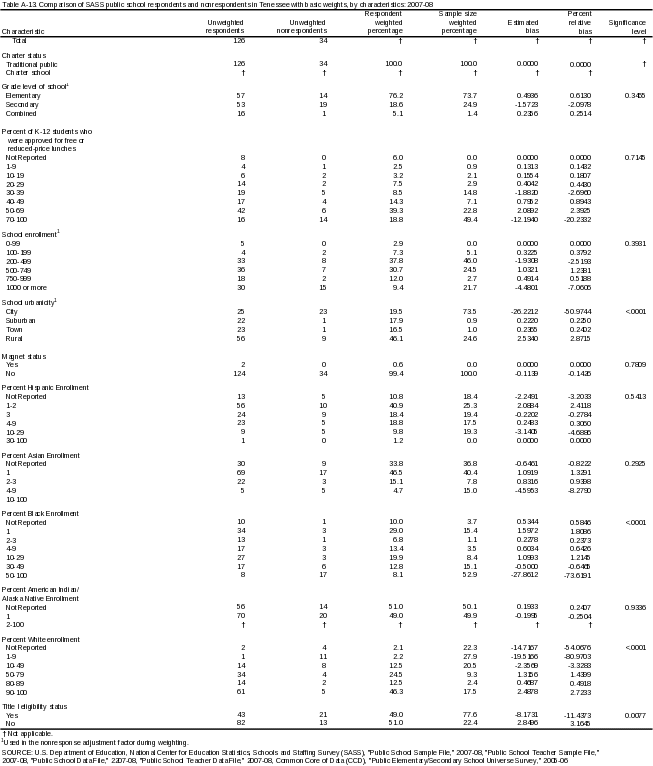
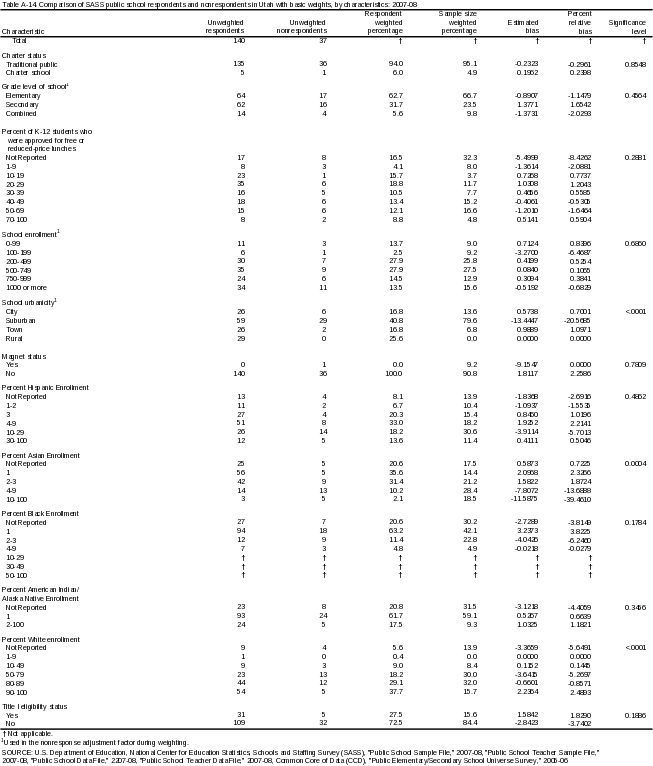
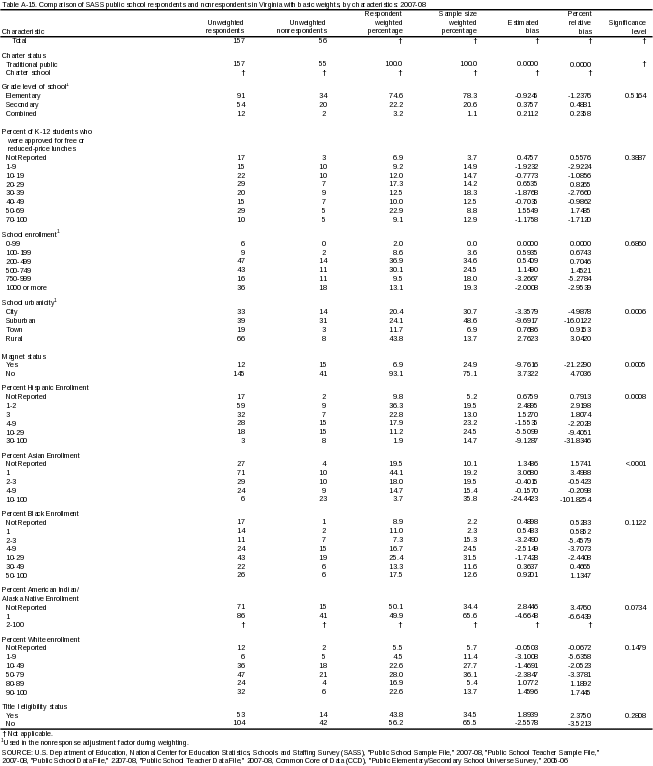
Attachment 2: Final-Weighted TLF State-Level Nonresponse Bias Tables
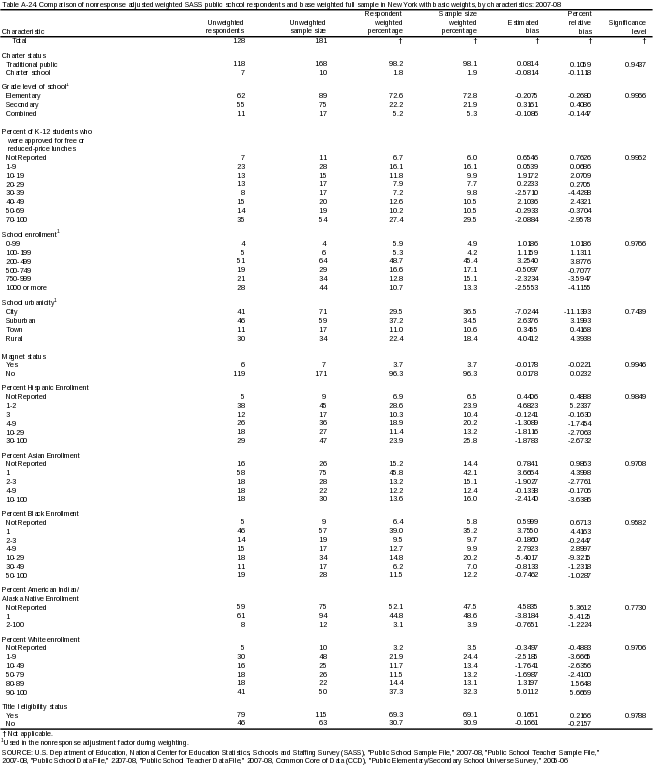
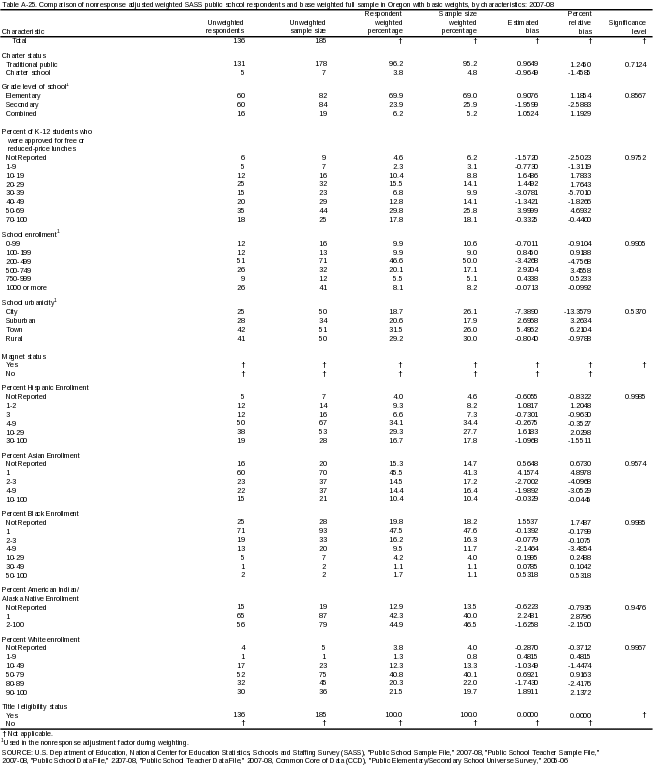
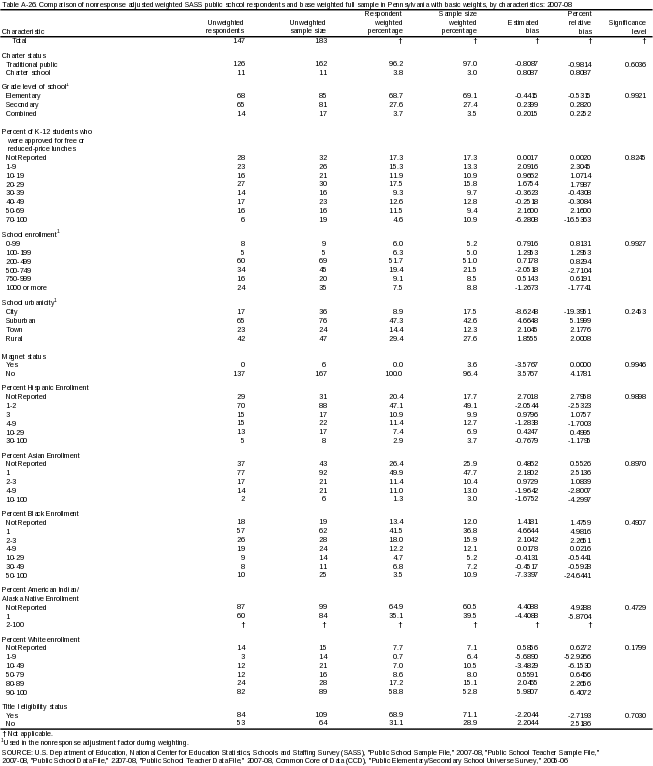
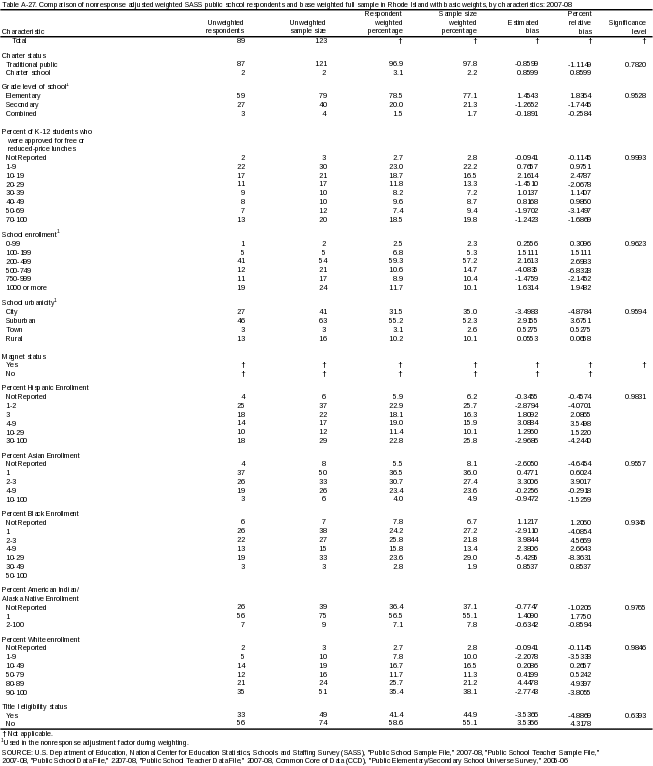
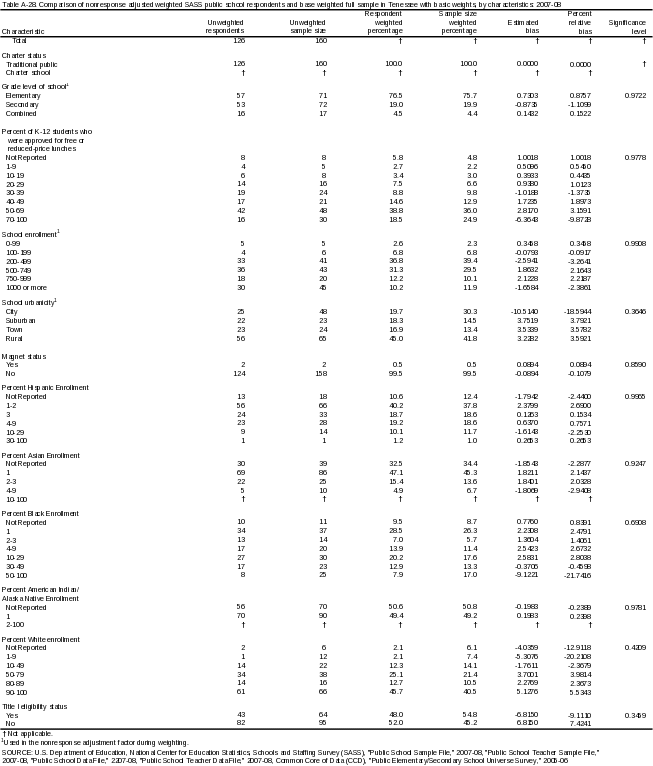
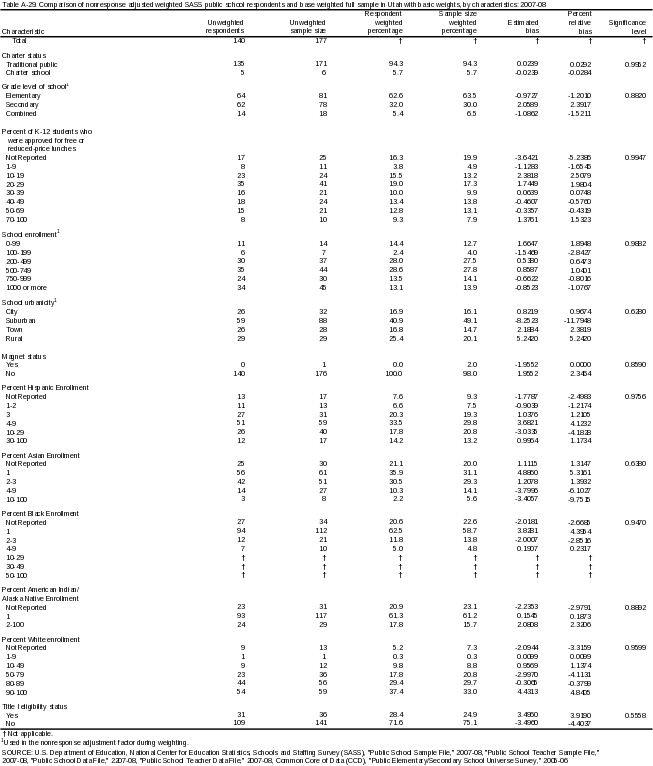
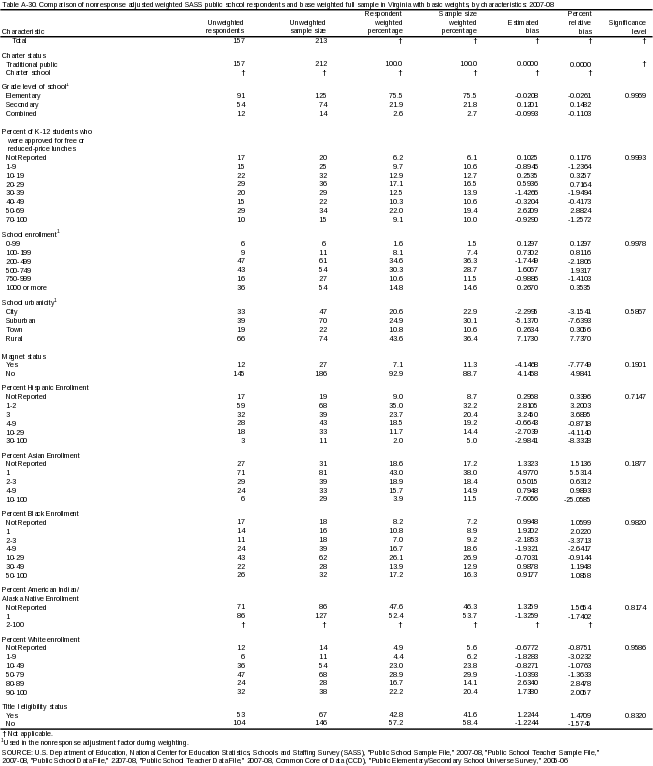
Attachment 3: Basic-Weighted SASS Public School Teacher State-Level Nonresponse Bias Tables
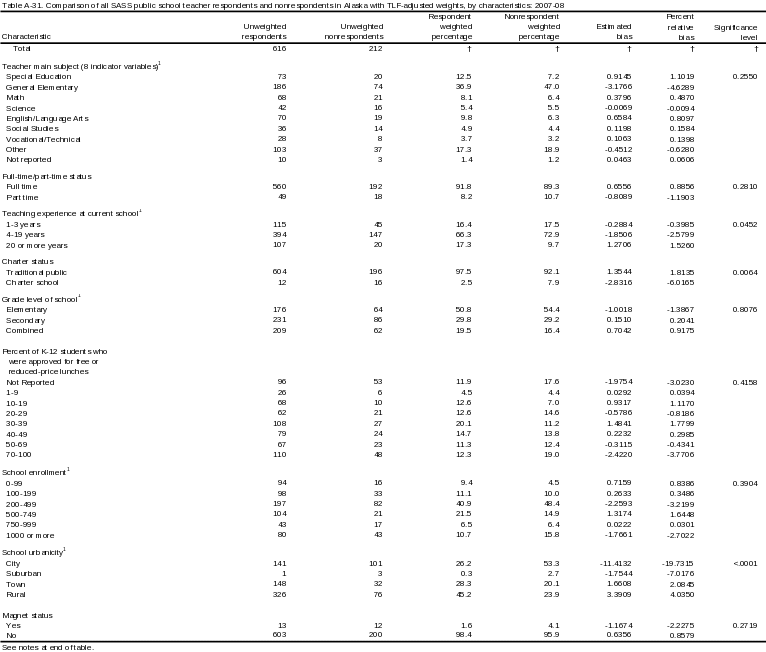
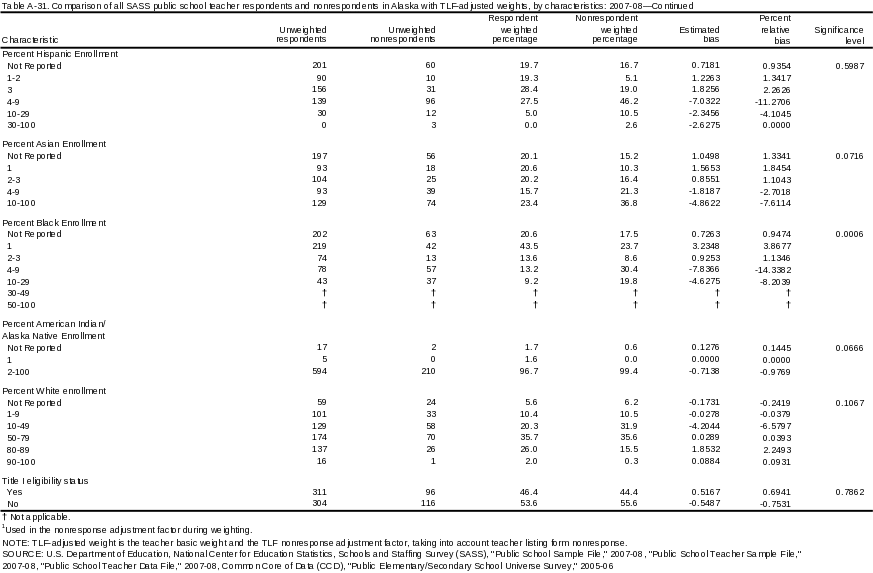
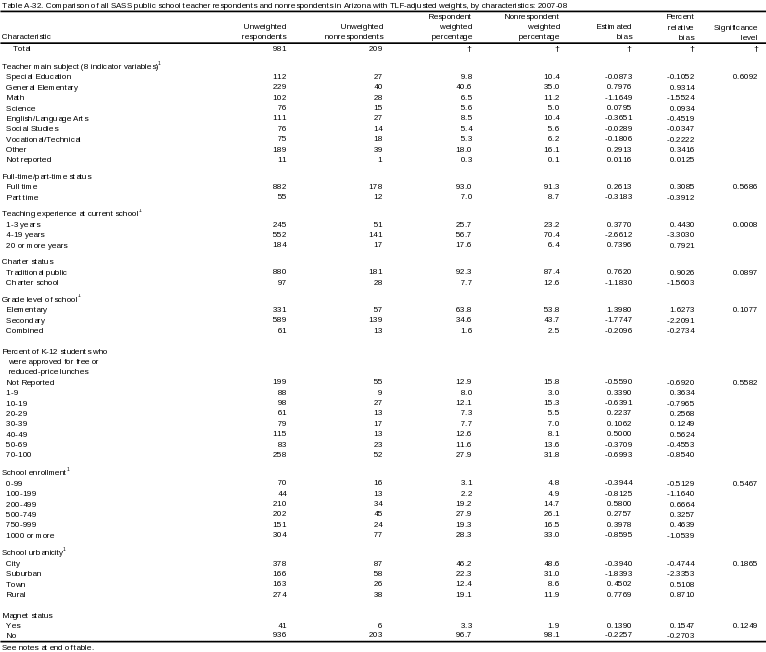
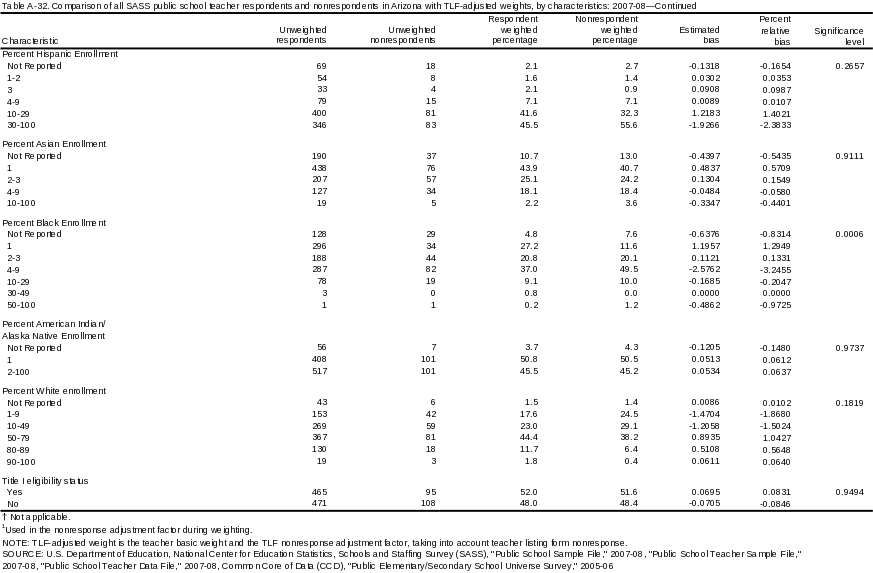
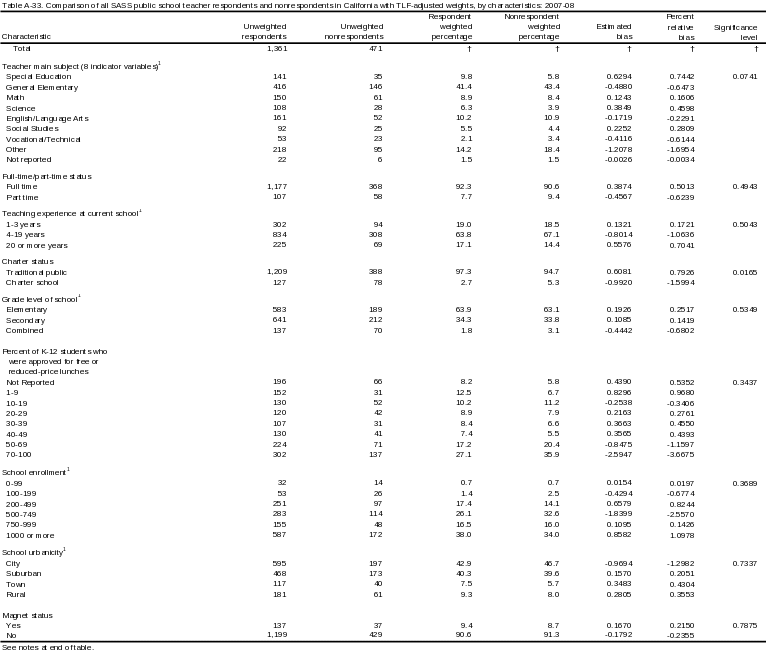
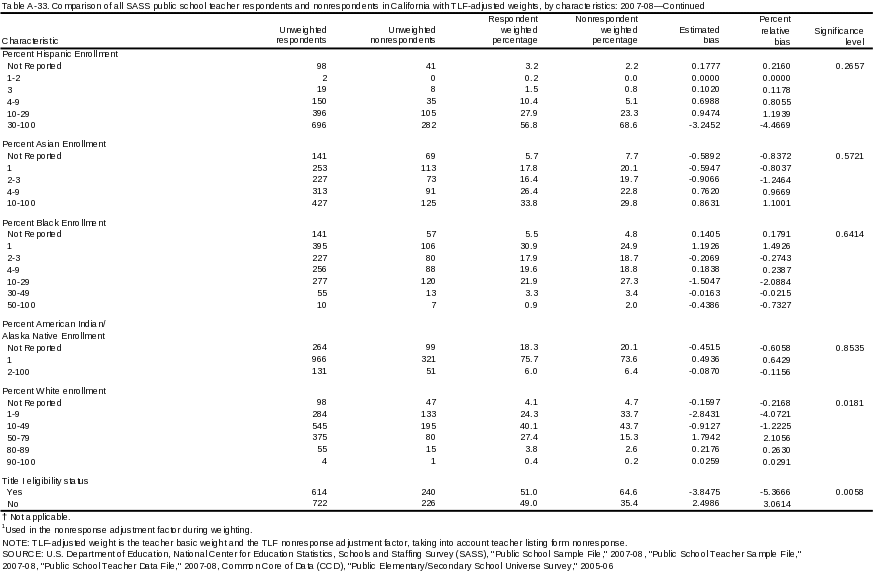
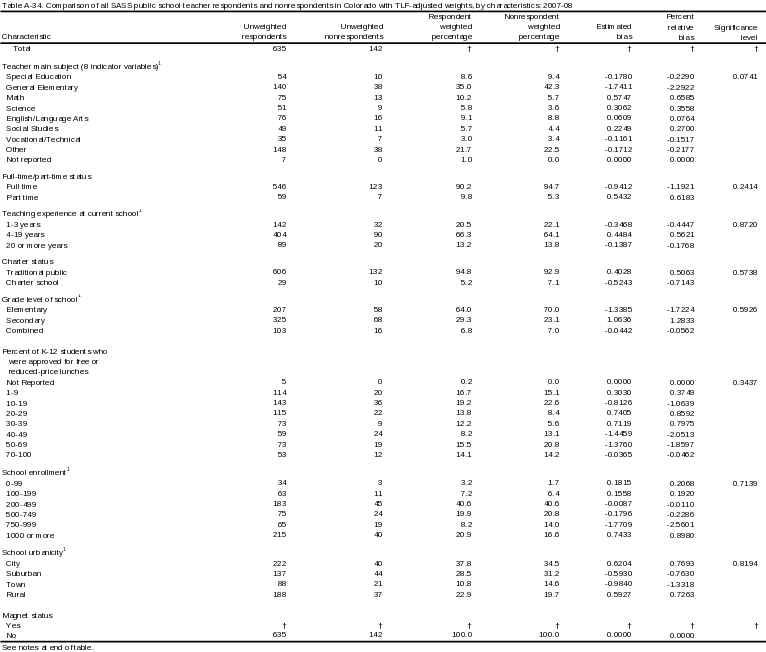
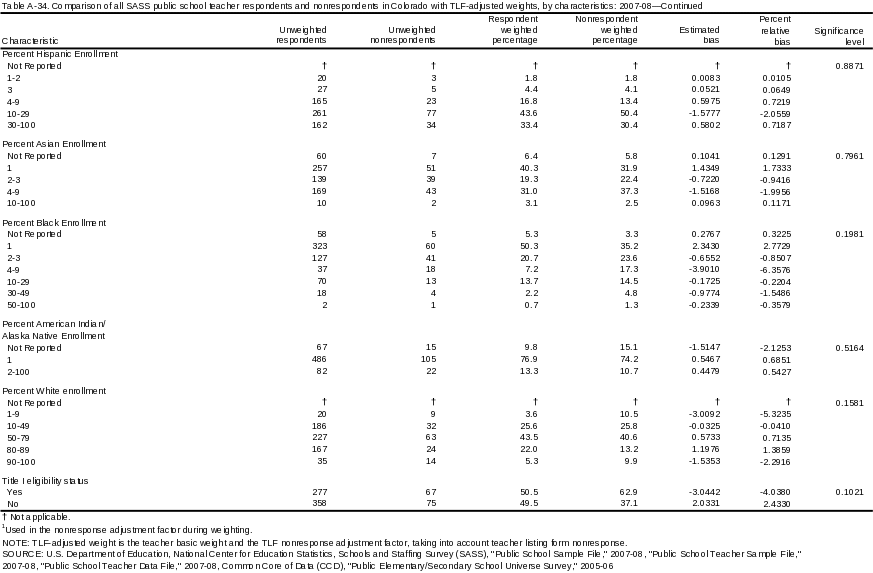
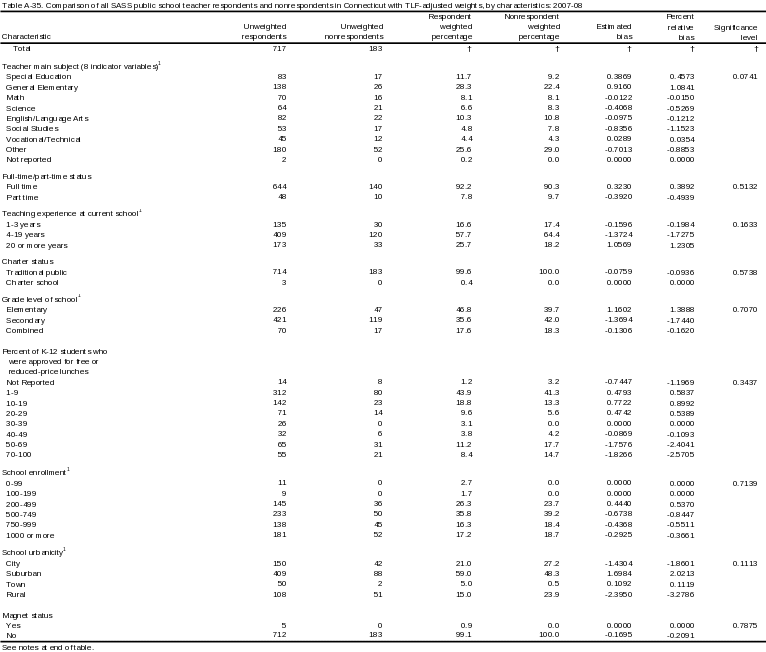
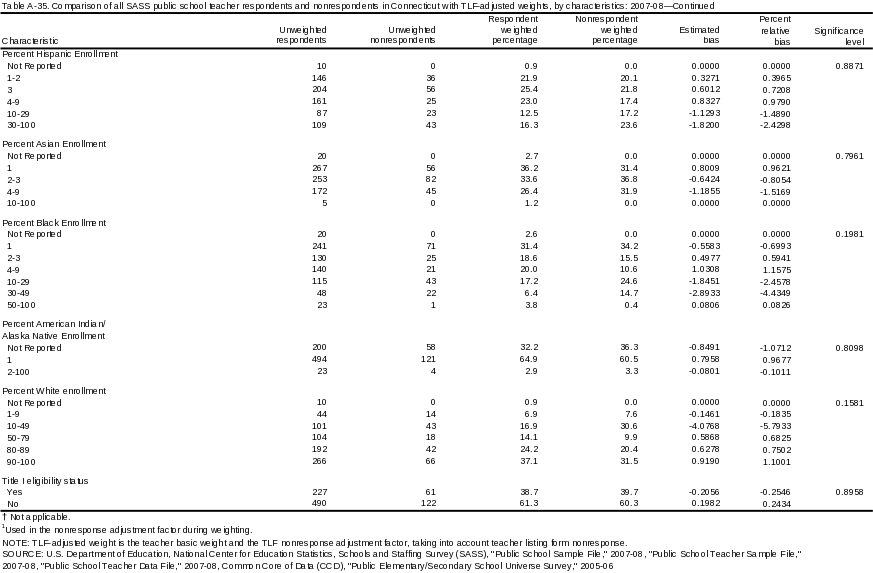
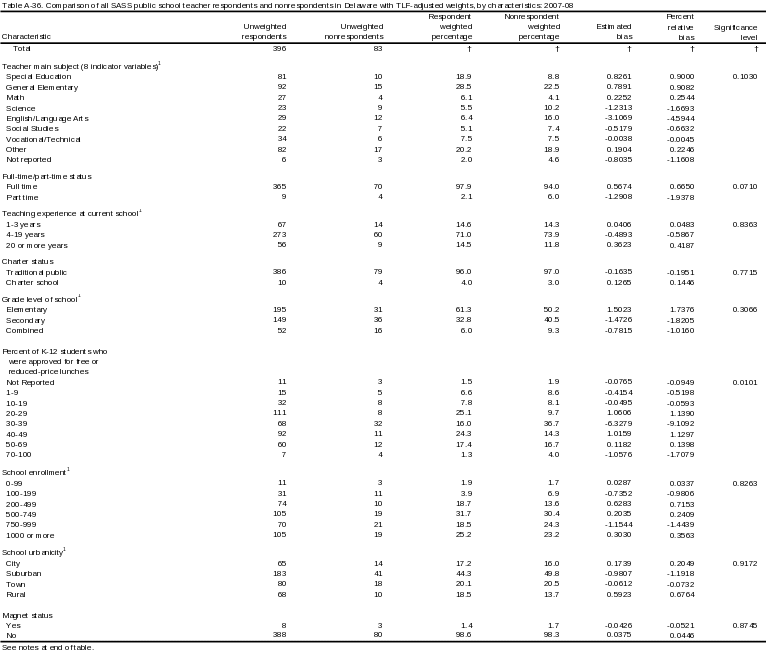
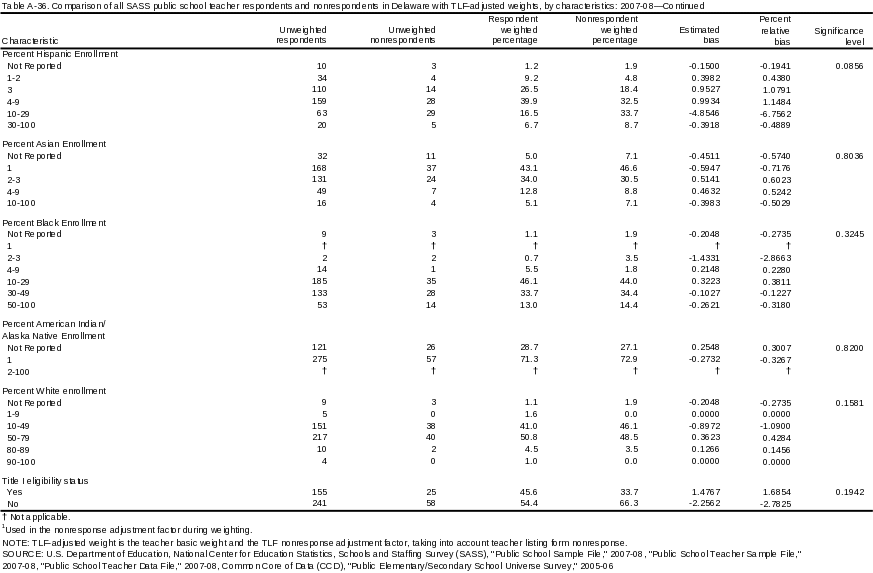
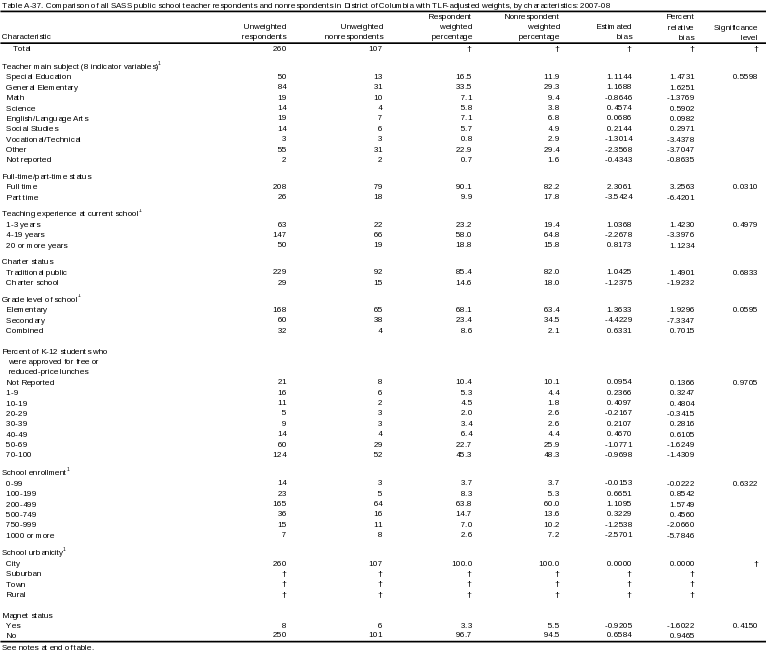
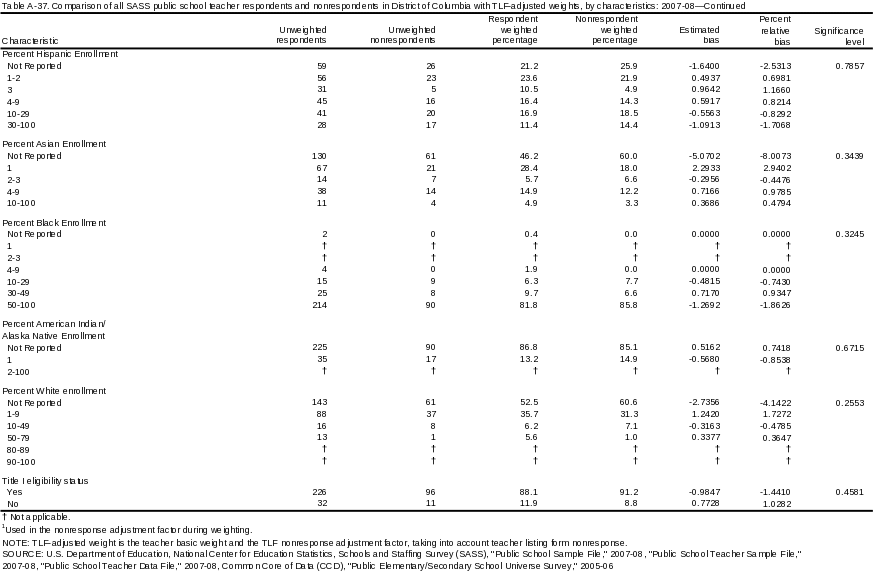
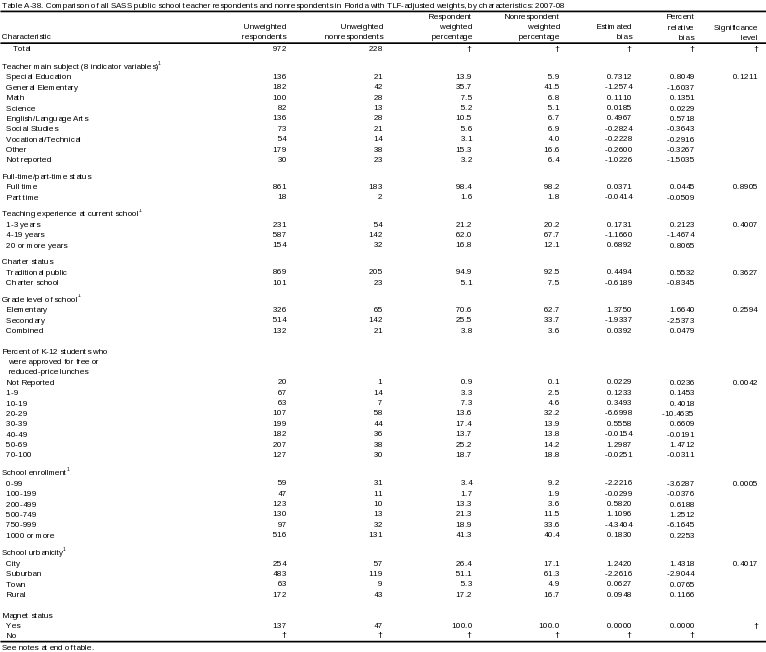
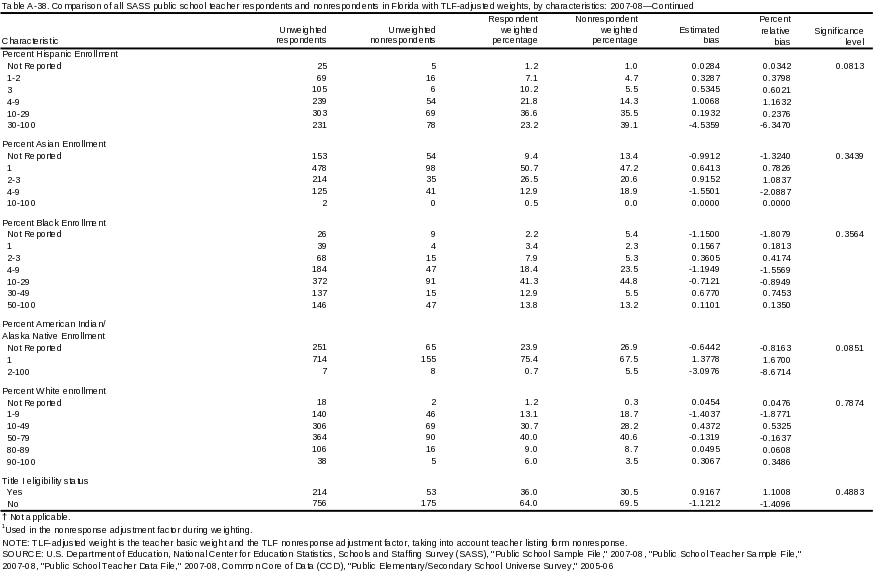
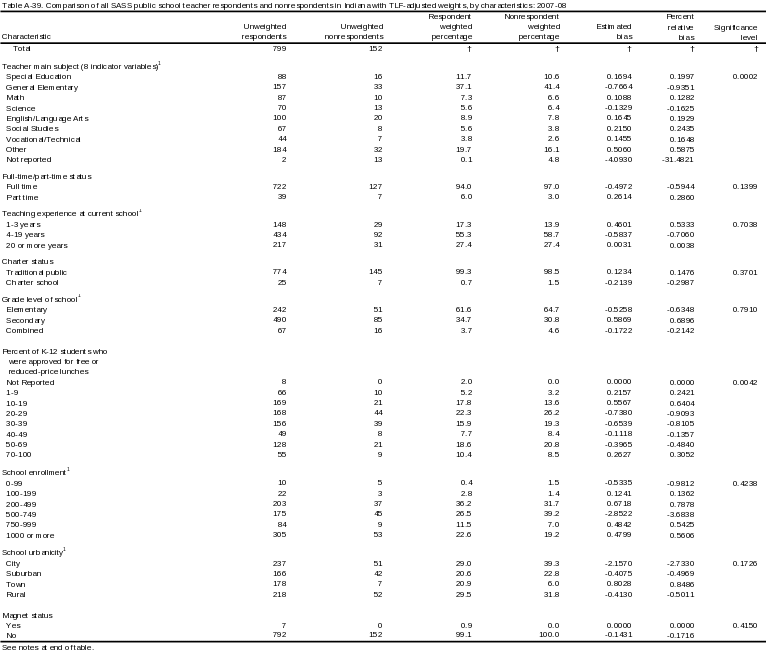
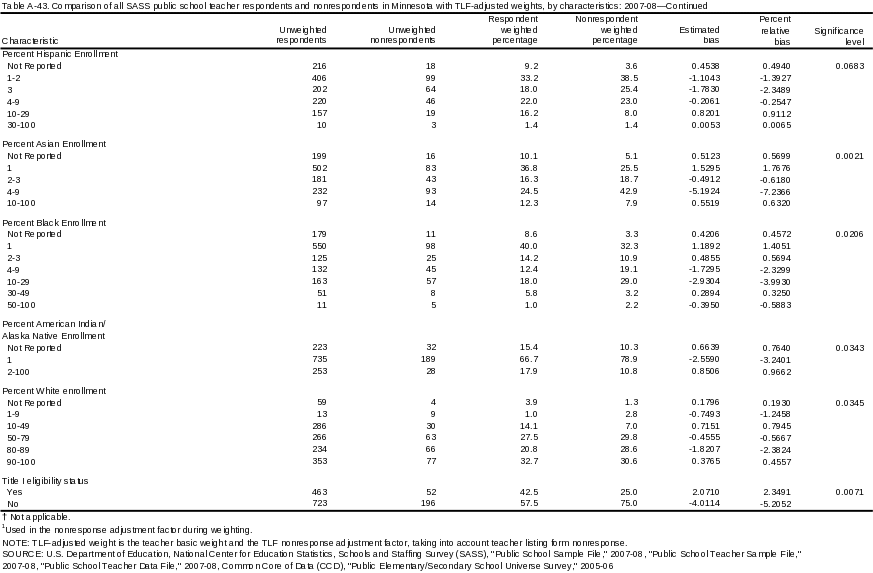
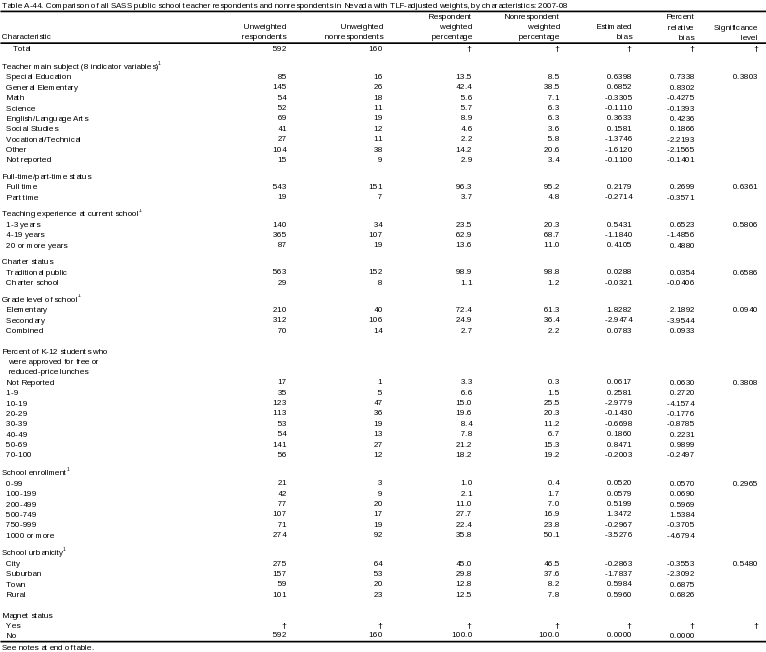
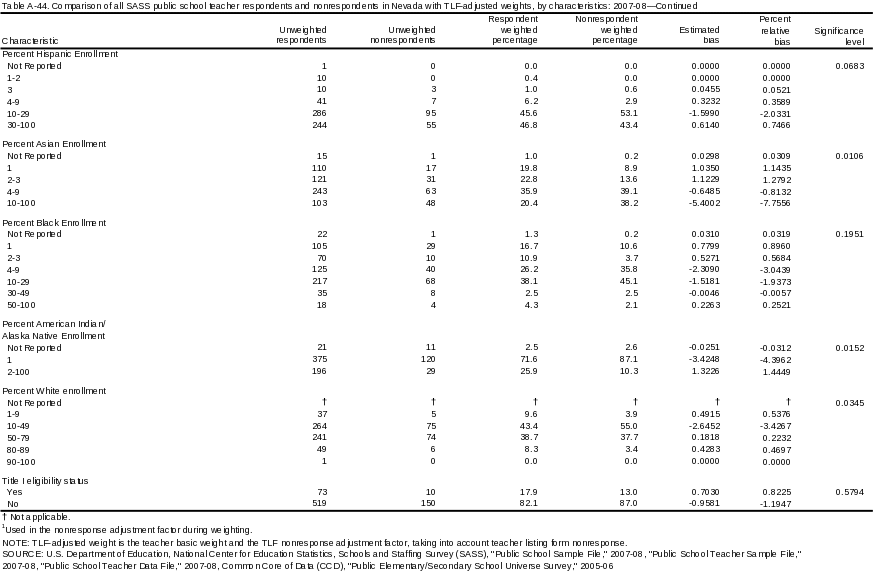
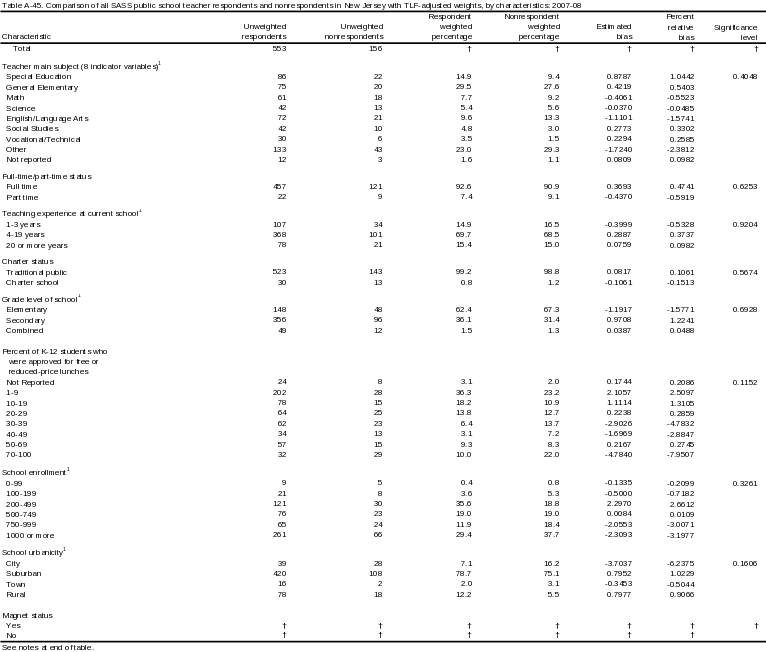
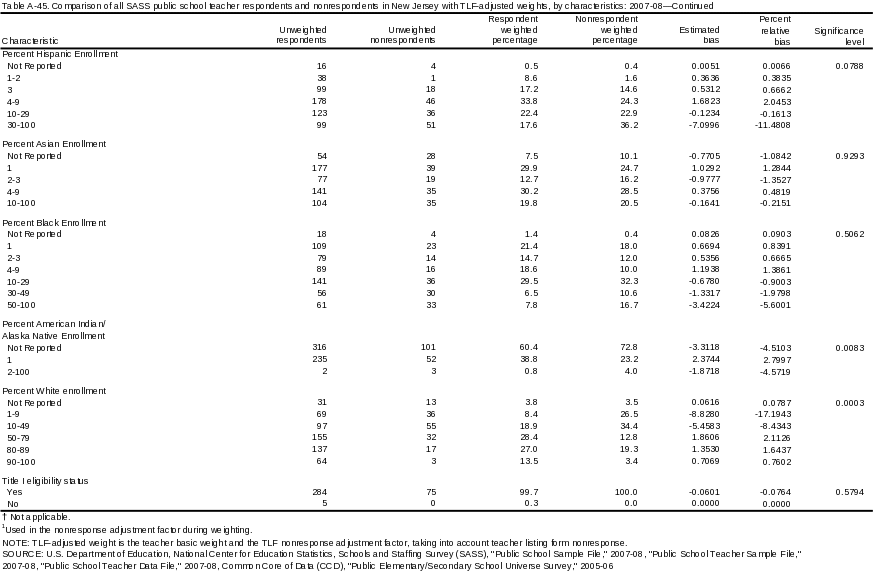
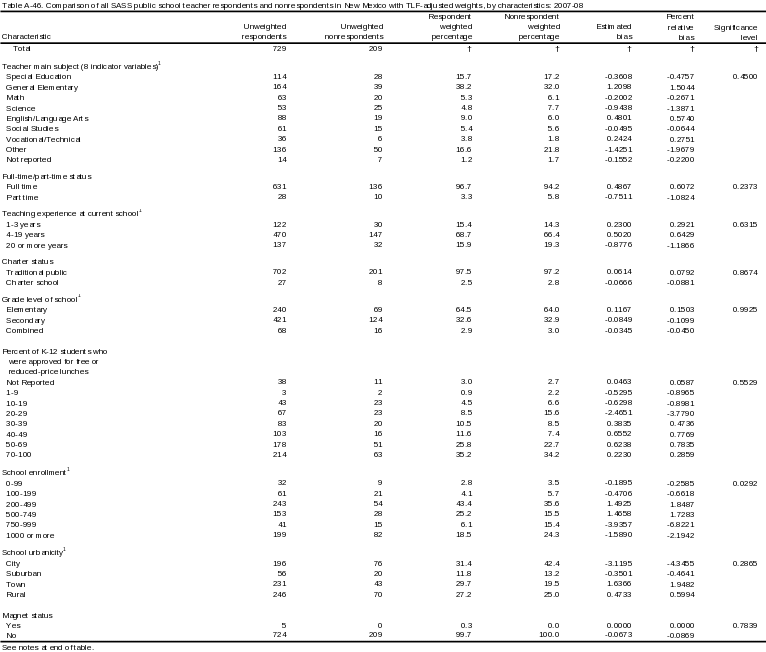
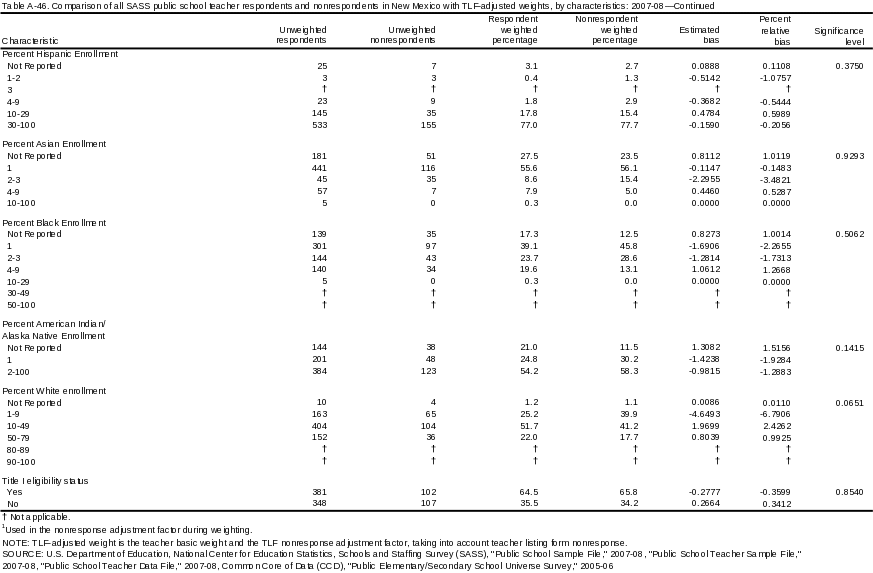
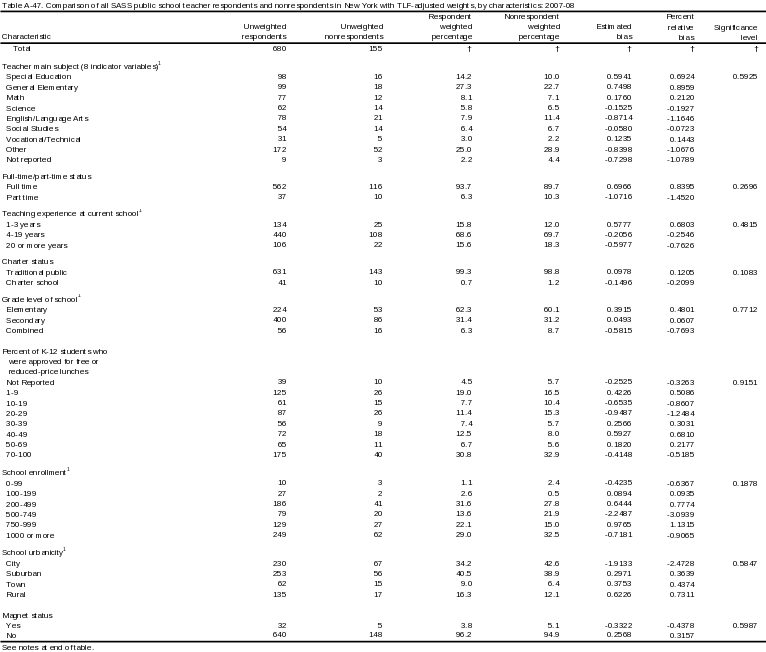
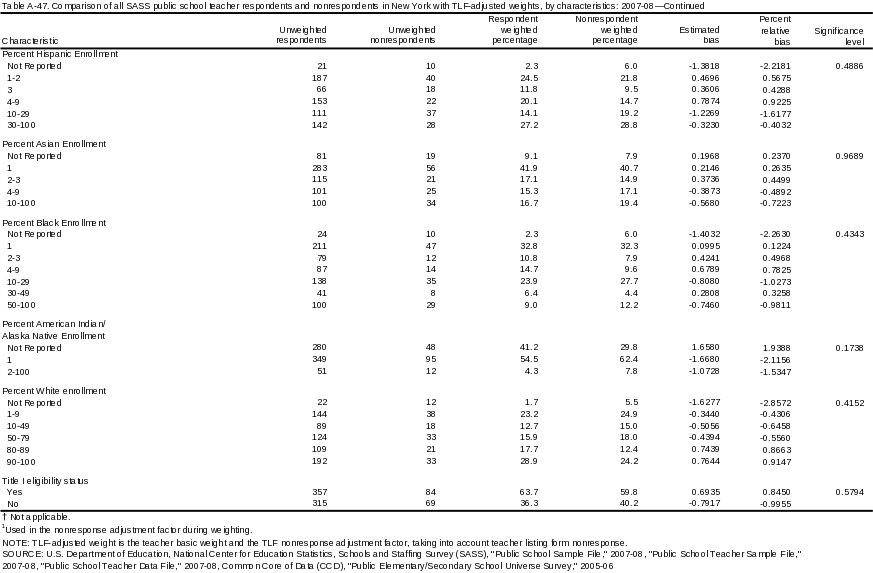
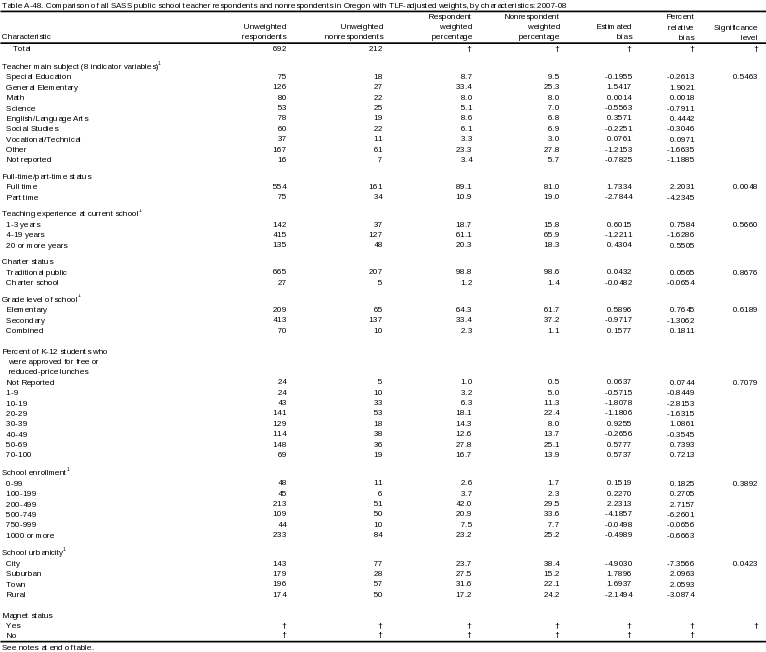
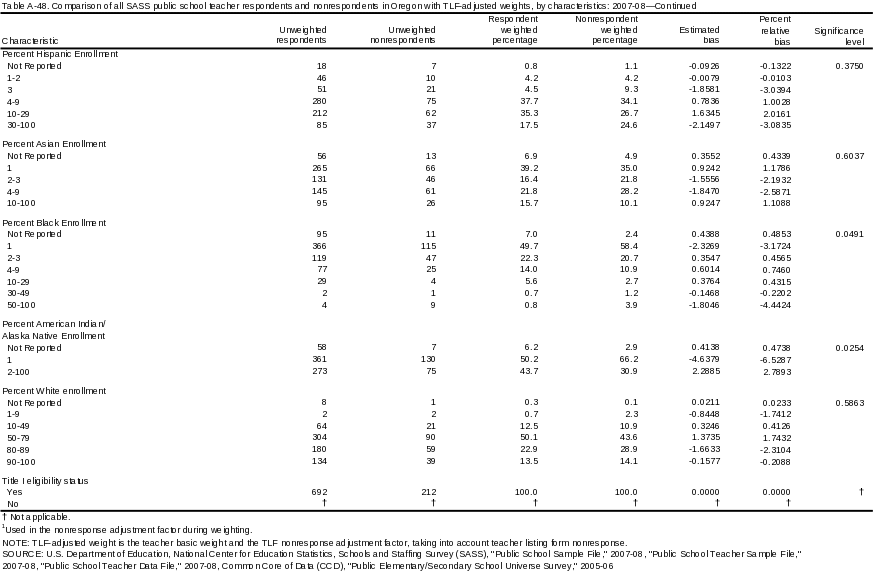
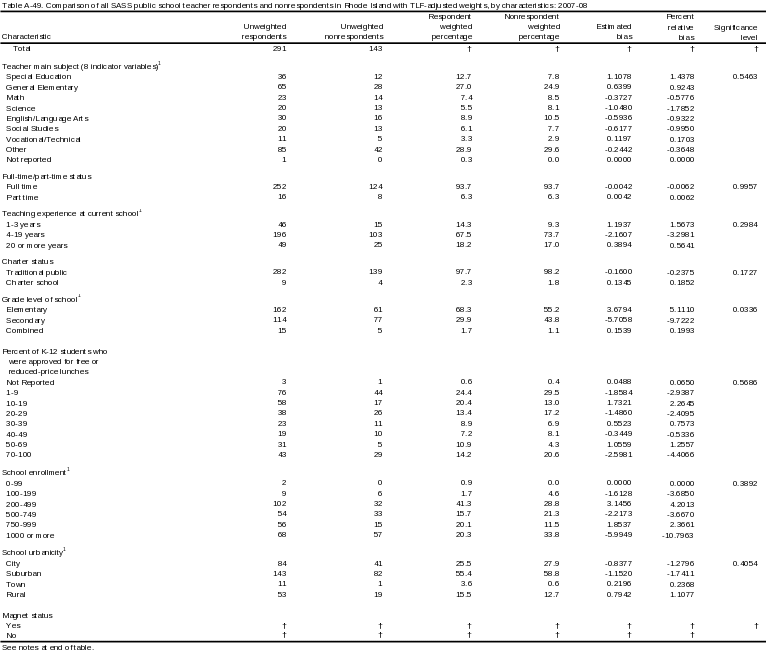
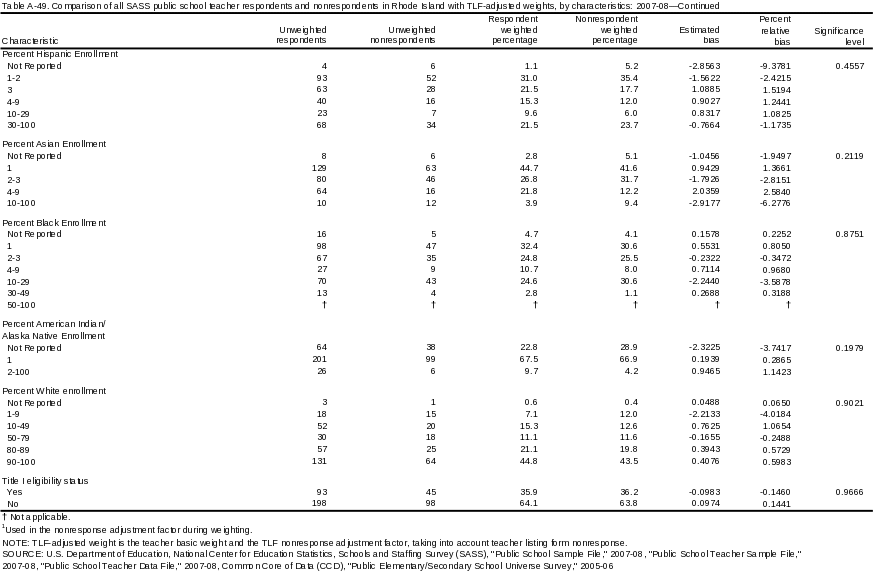
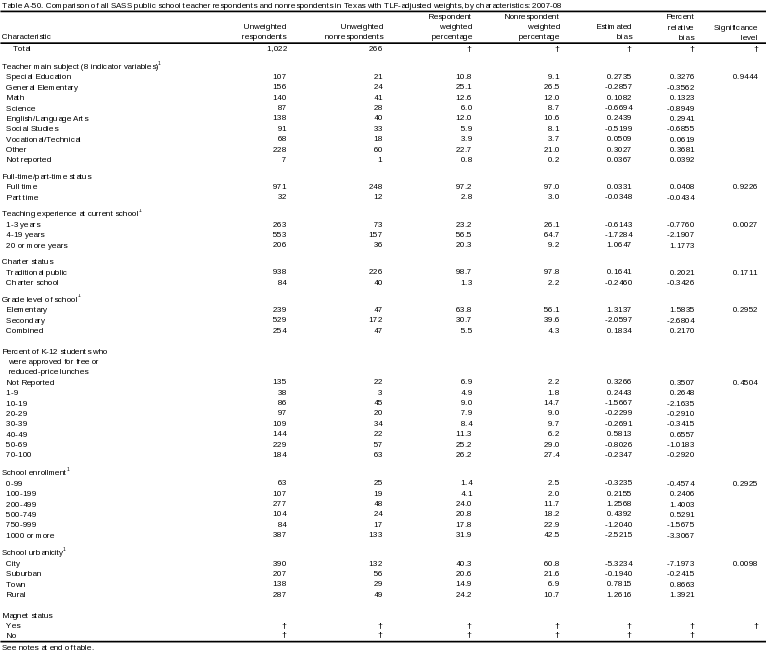
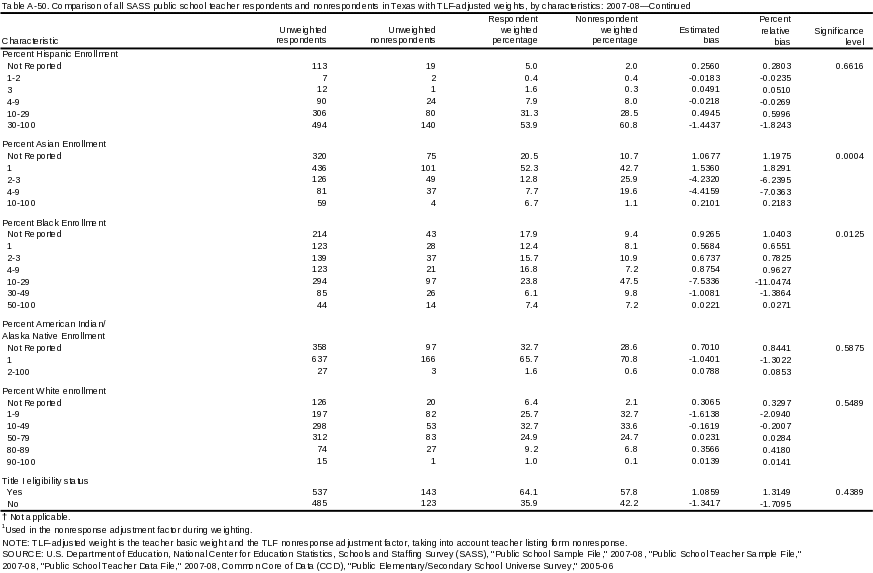
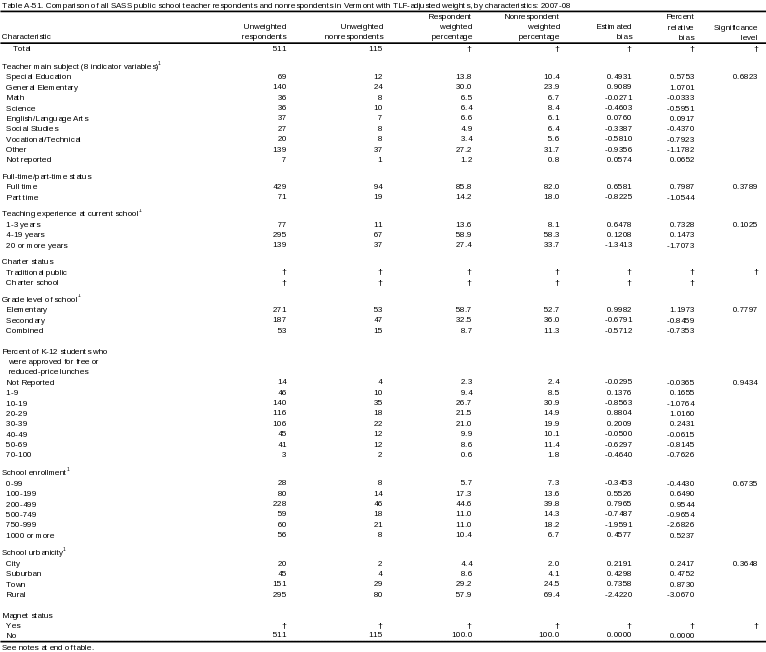
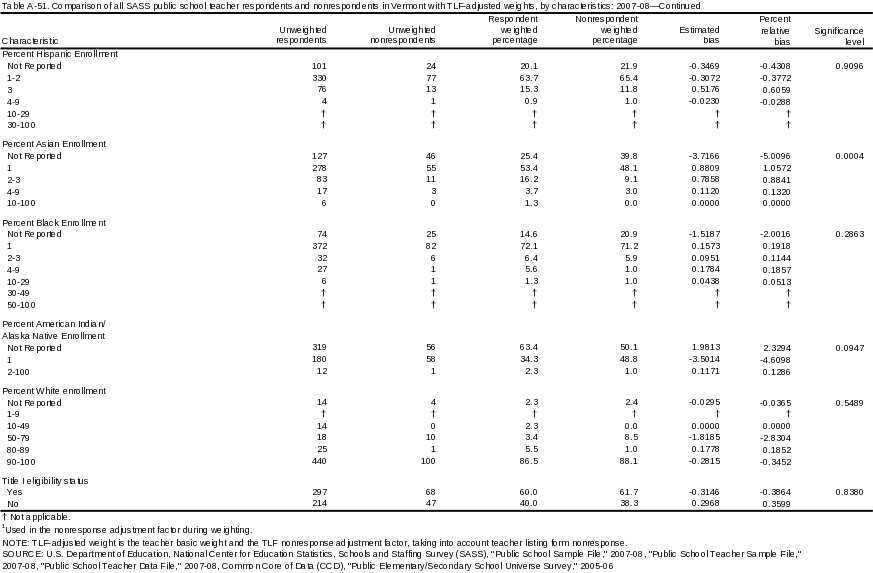
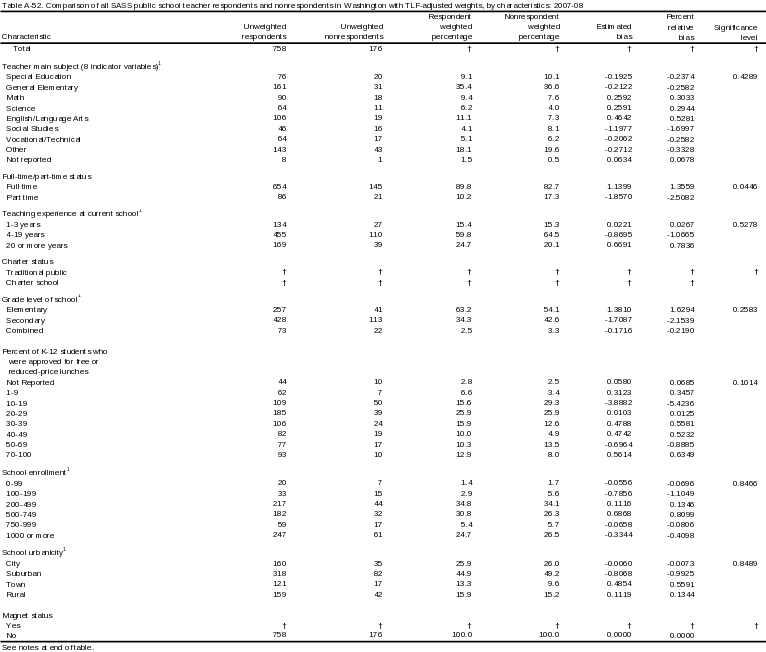
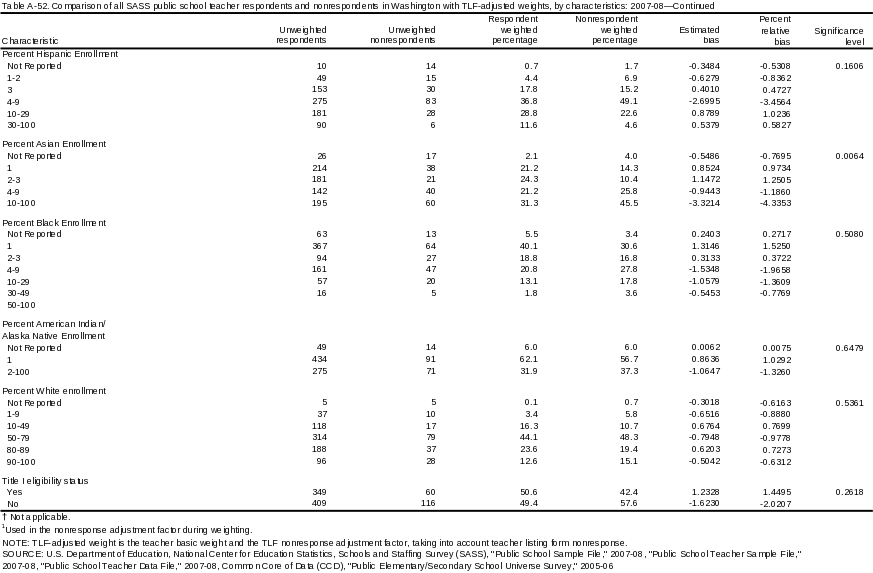
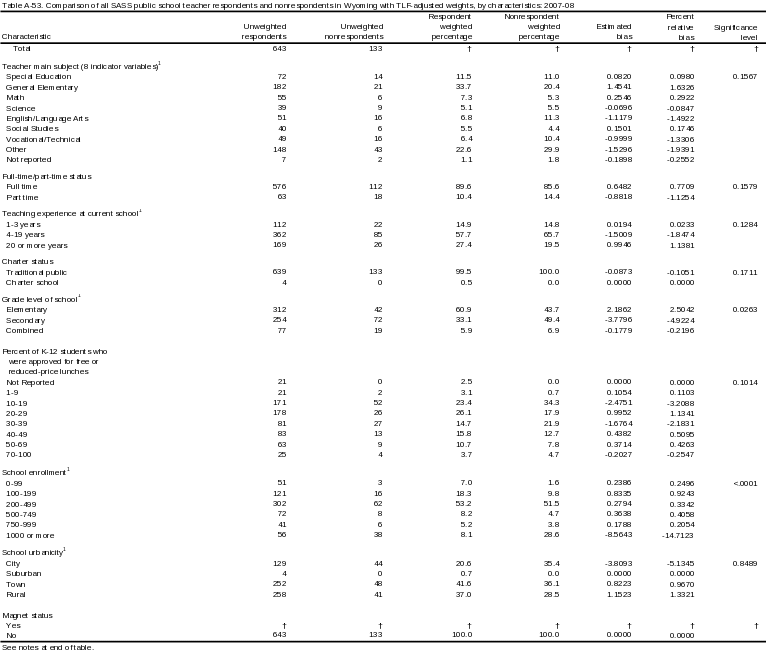
Attachment 4: Final-Weighted SASS Public School Teacher State-Level Nonresponse Bias Tables
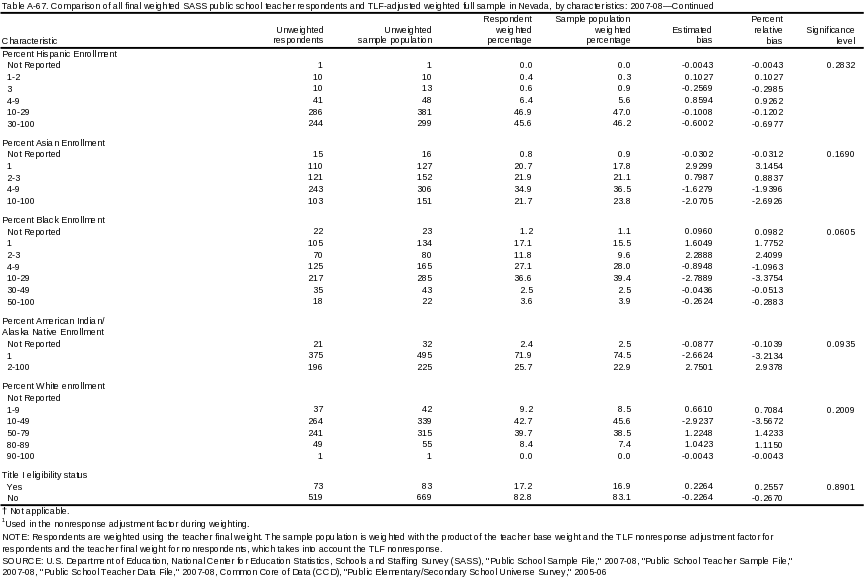
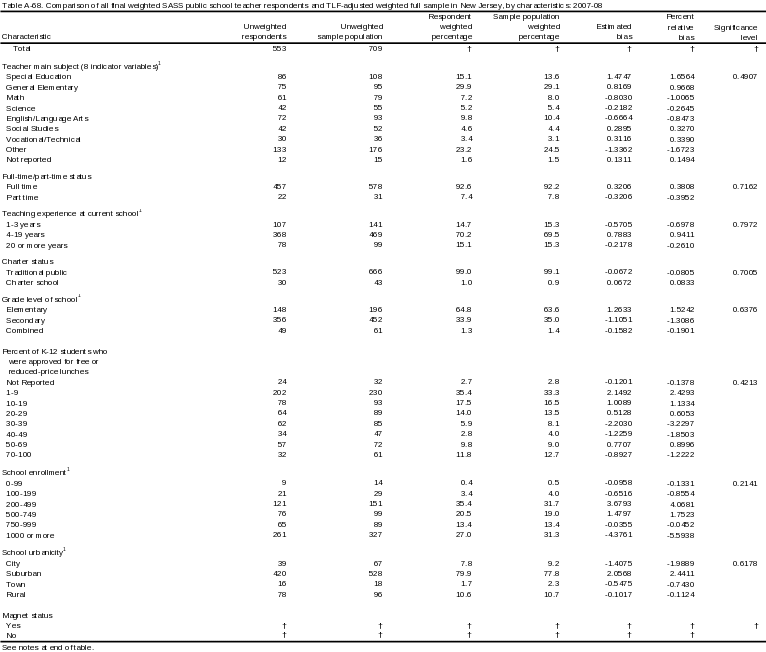
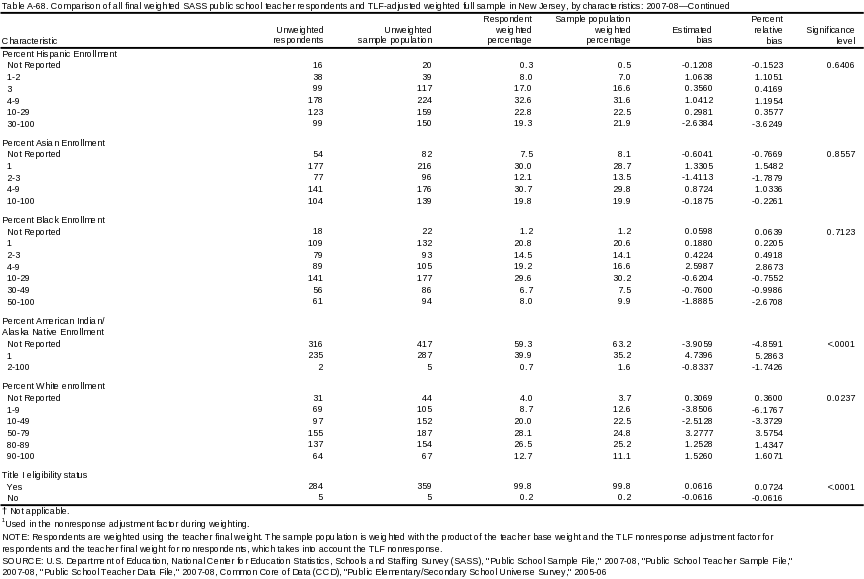
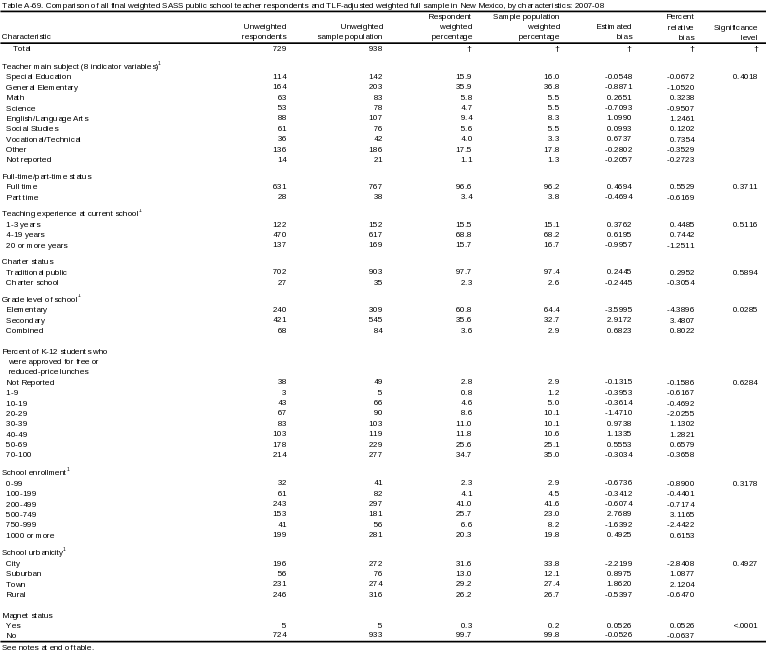
Attachment 5: Basic-Weighted New SASS Public School Teacher State-Level Nonresponse Bias Tables
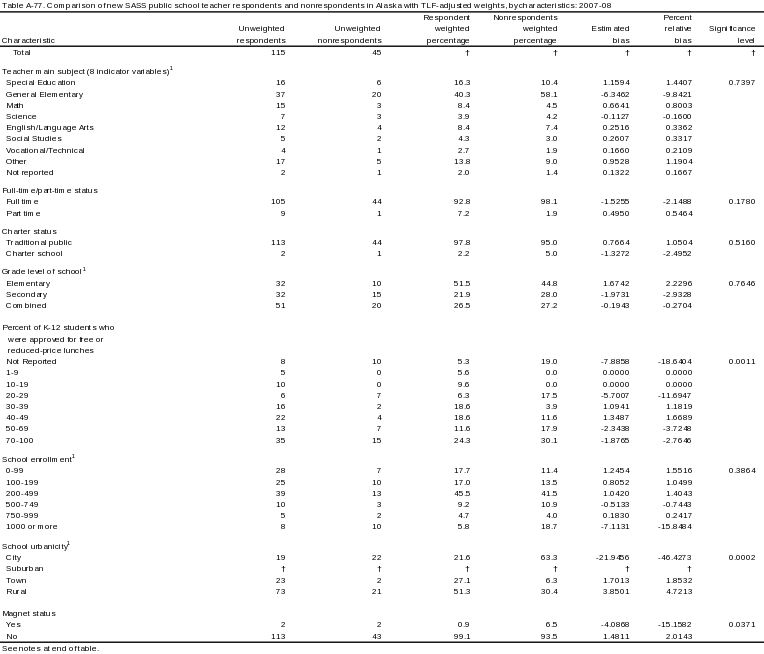
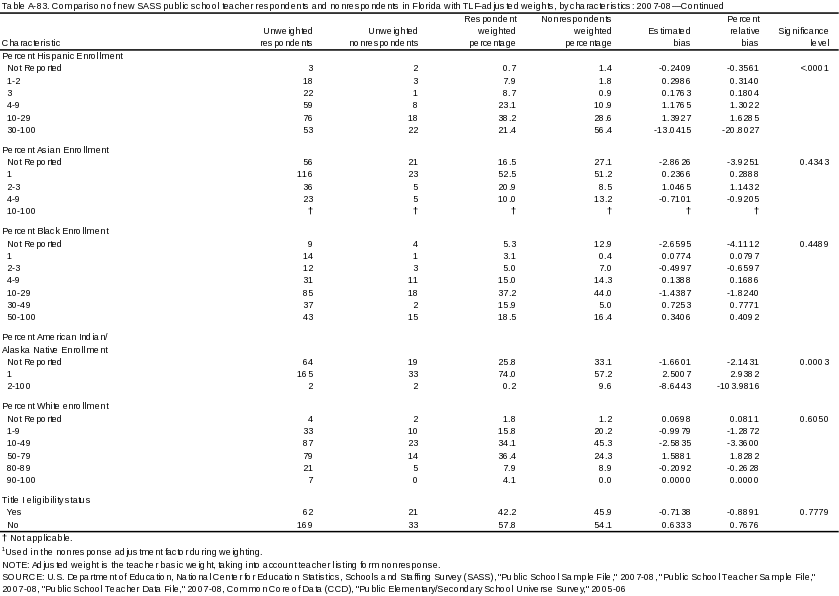
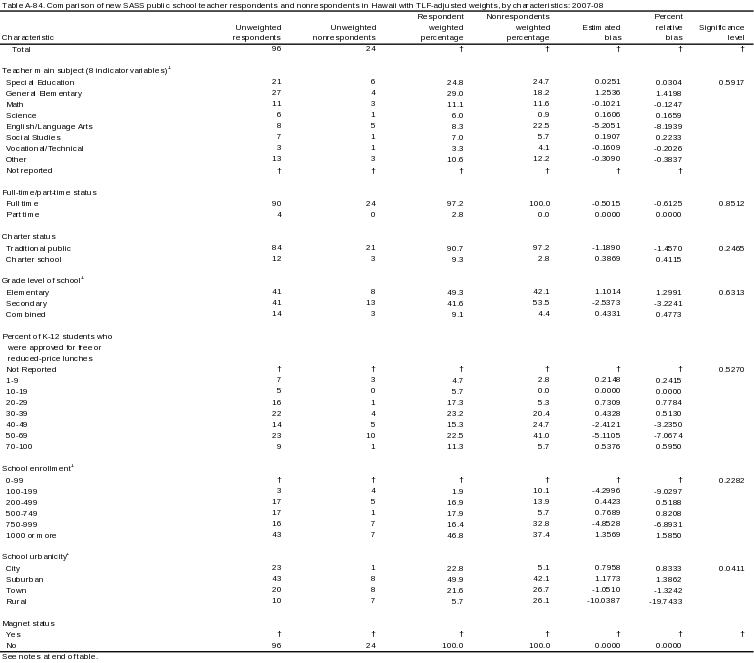
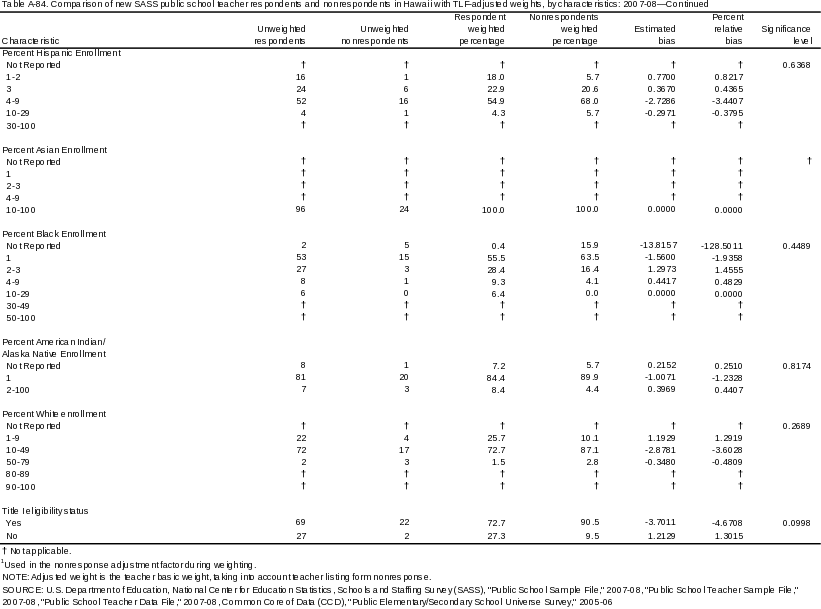
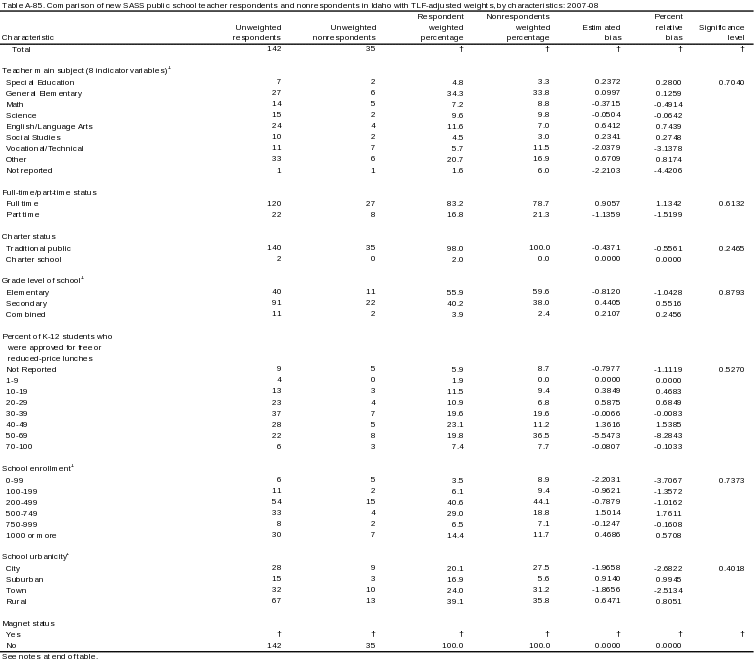
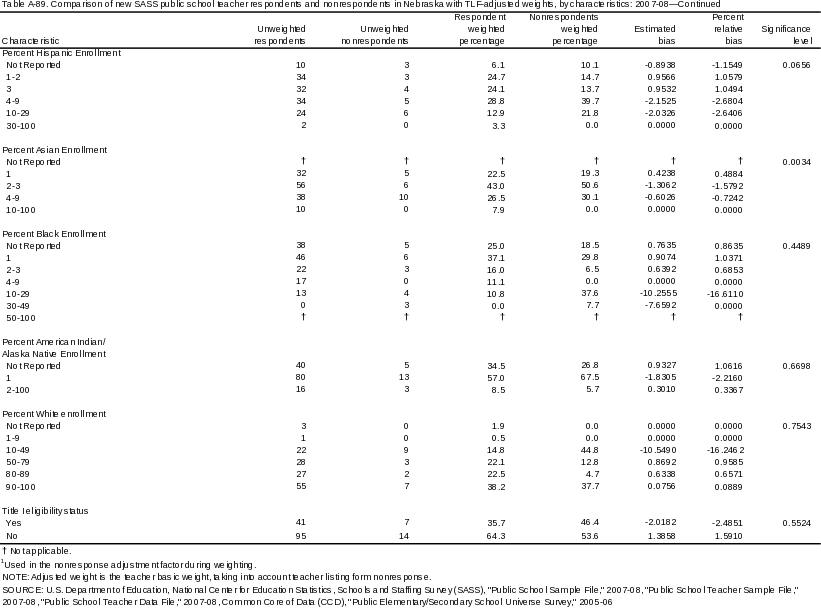
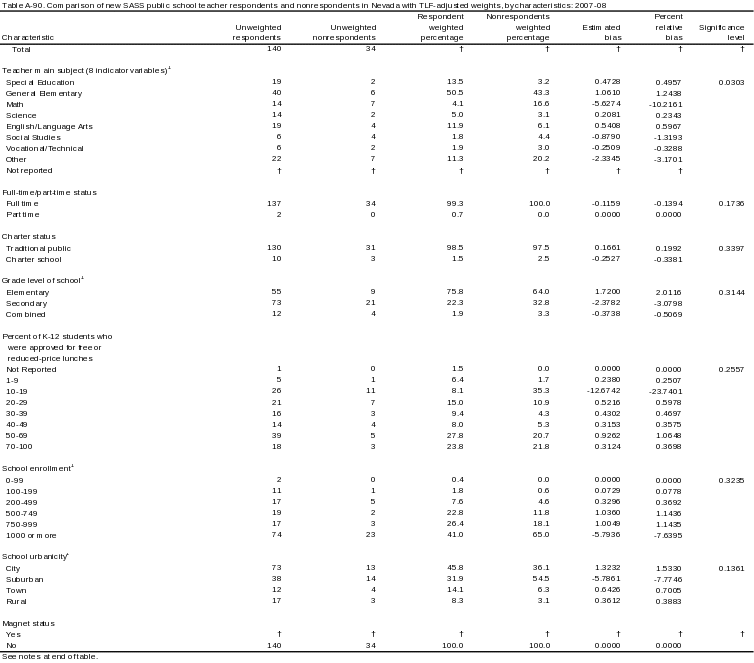
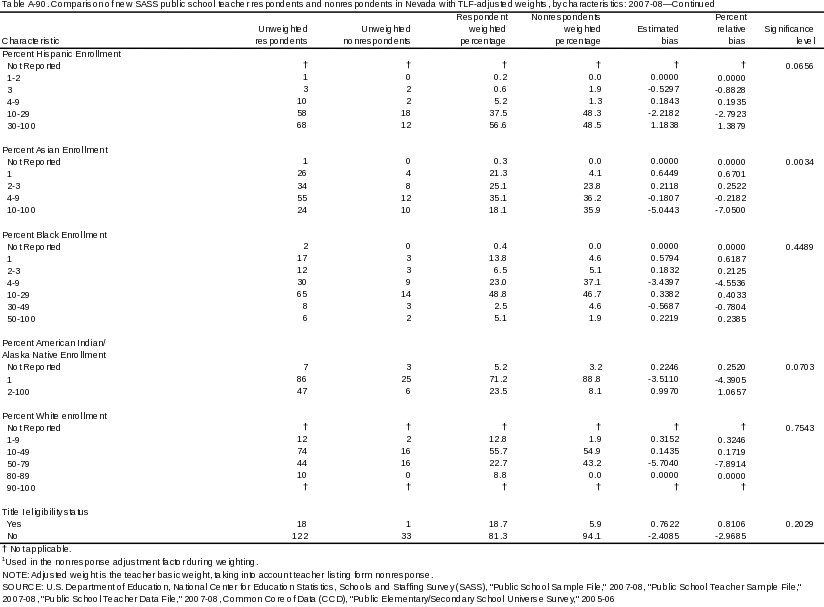
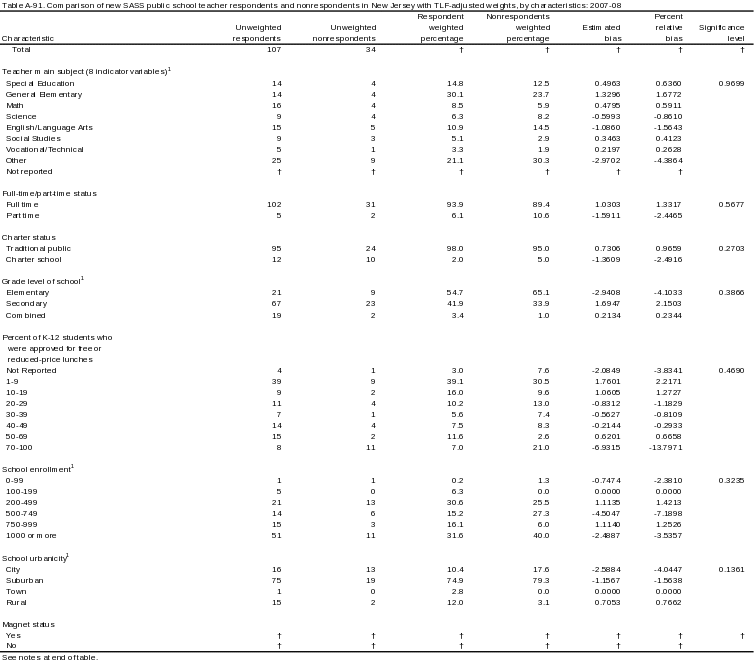
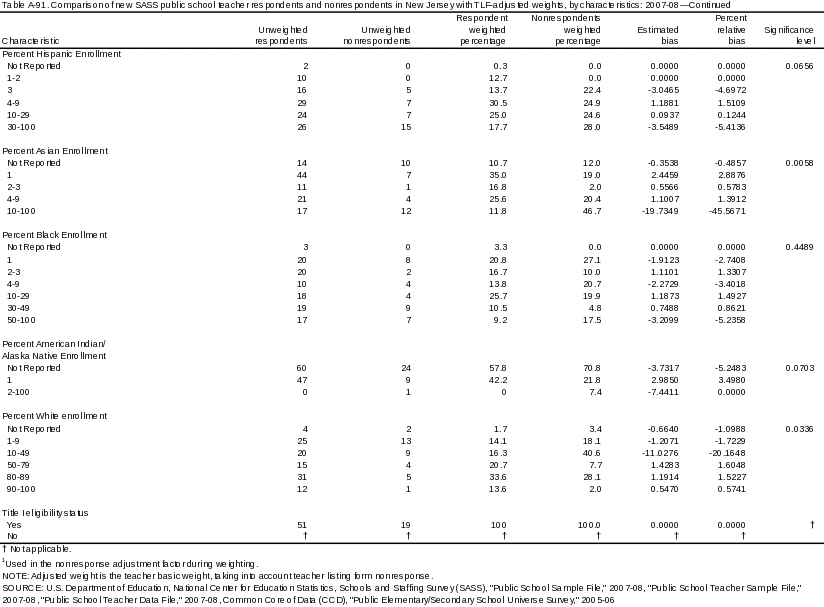
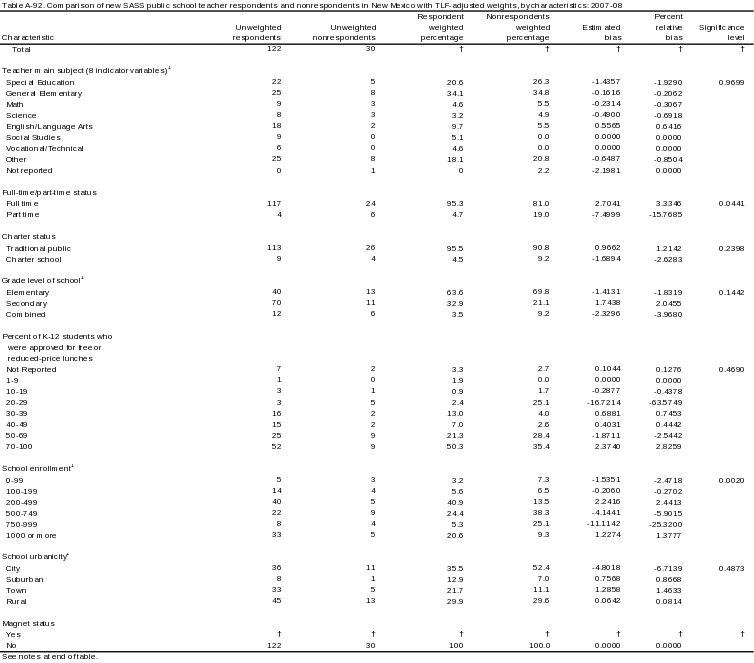
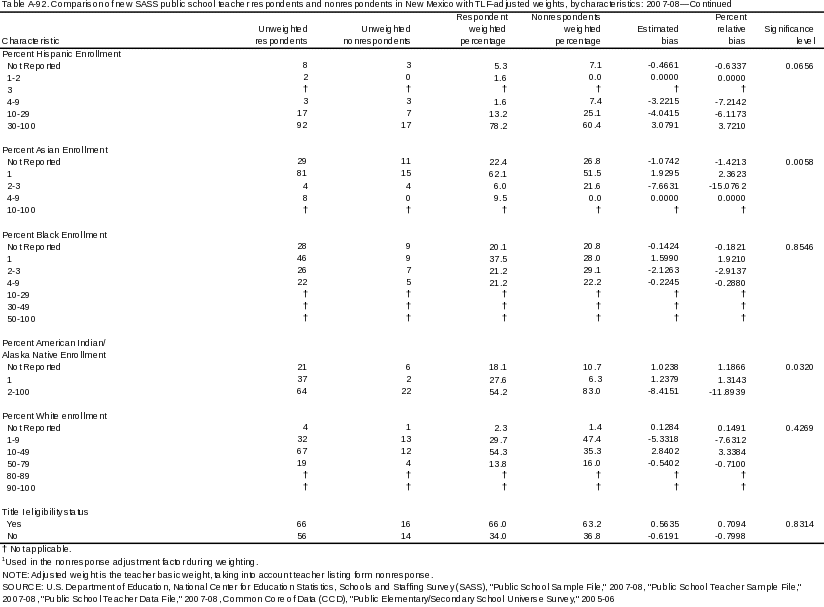
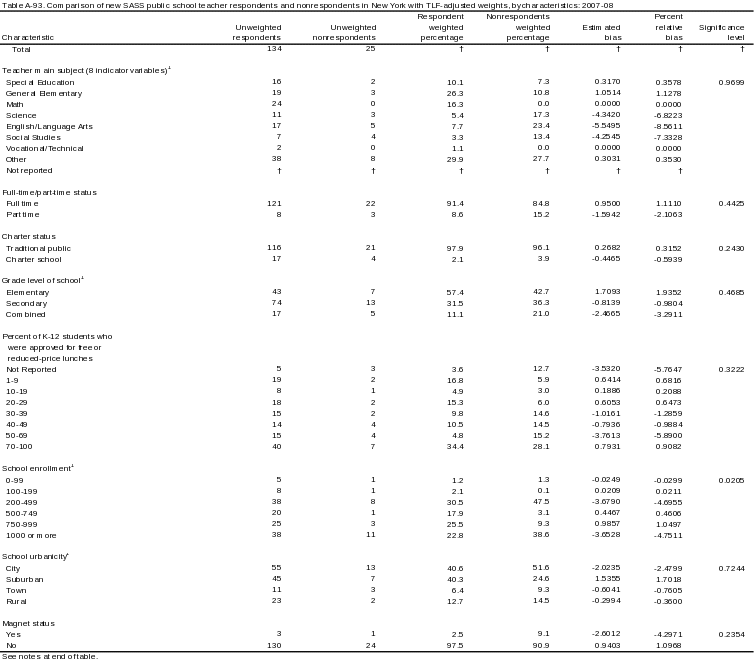
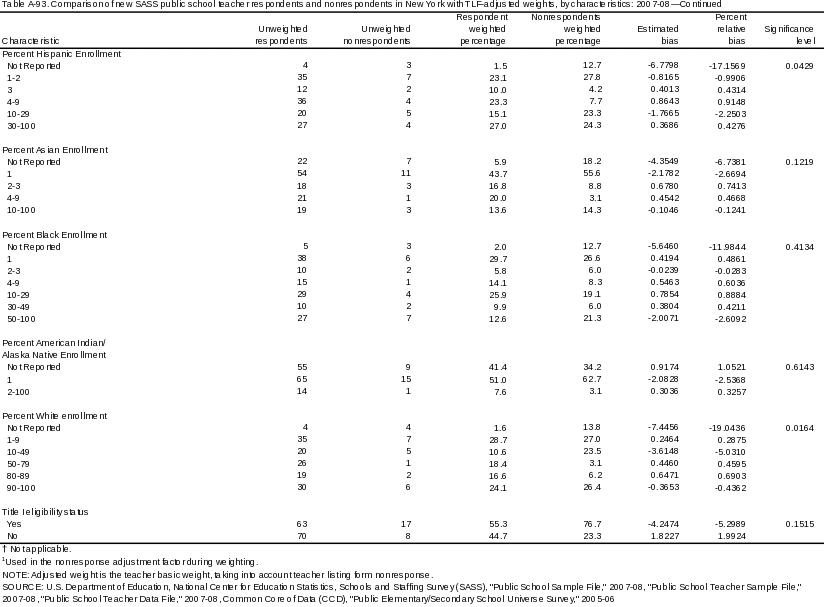
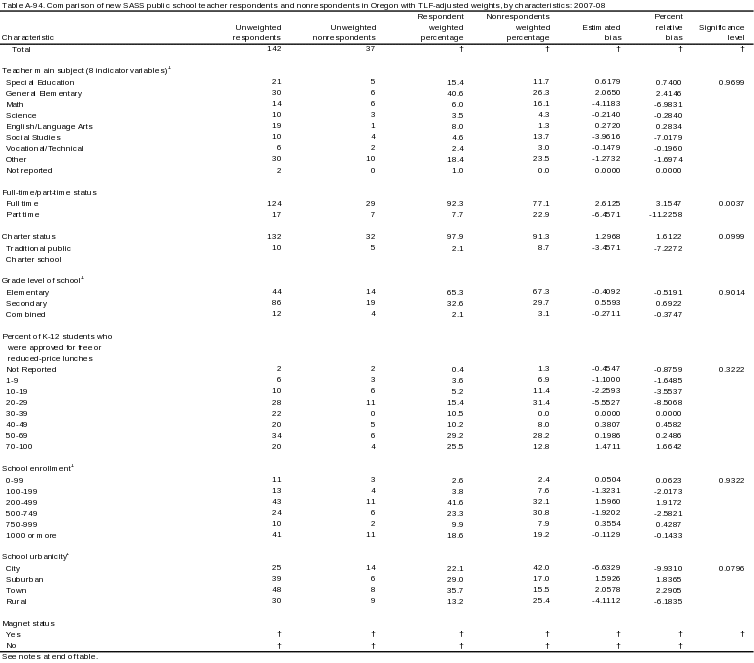
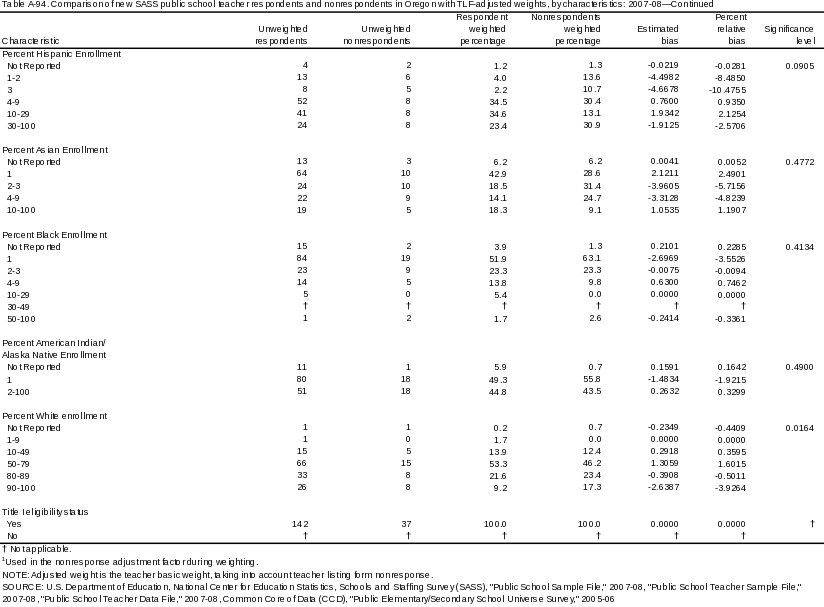
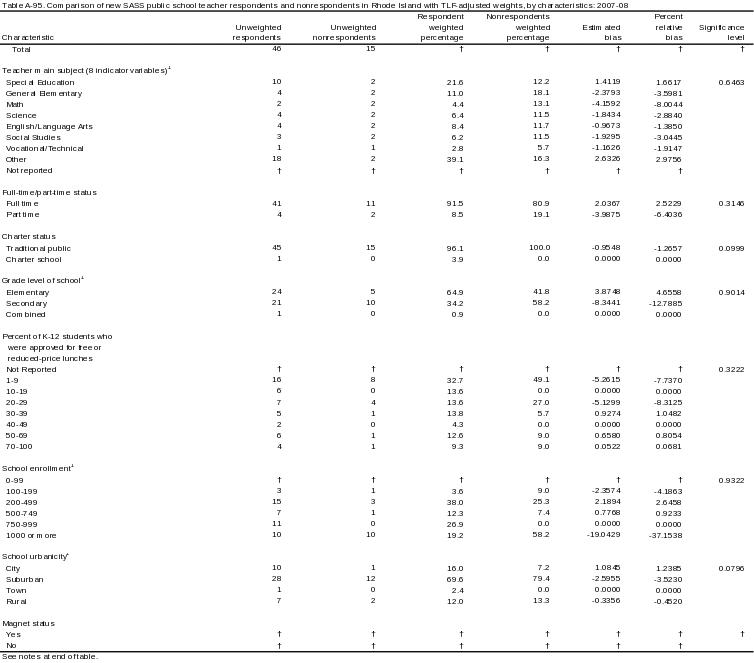
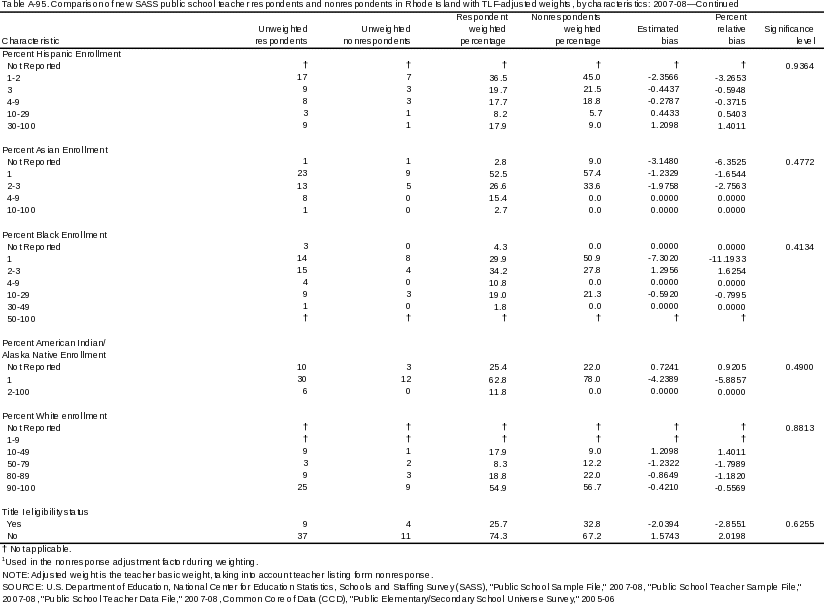
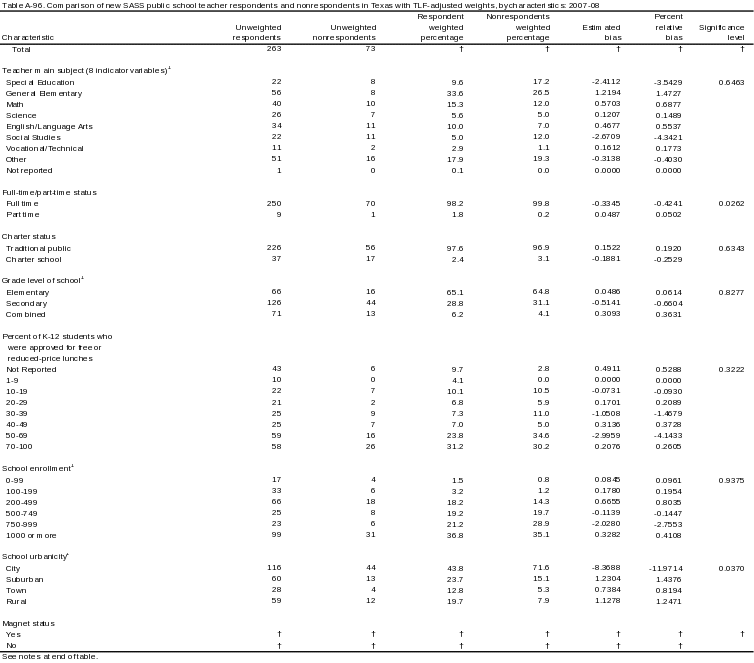
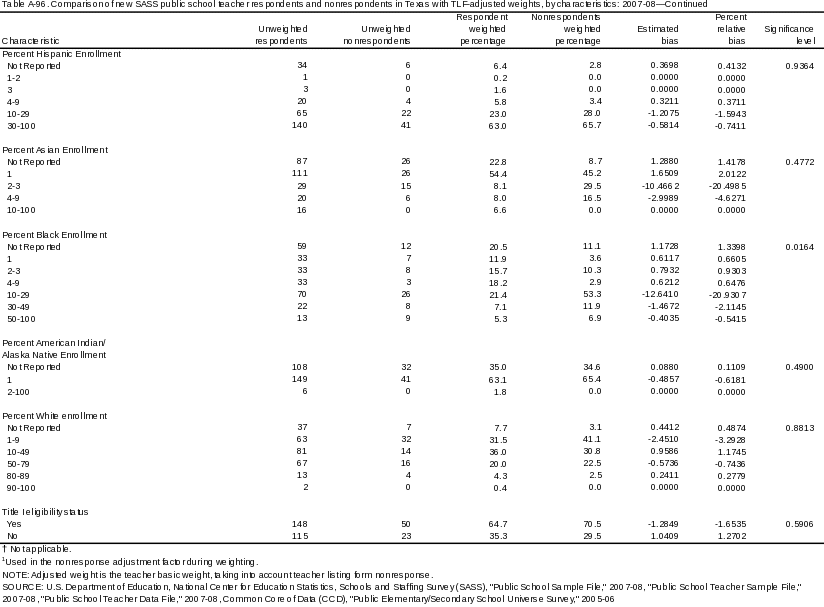
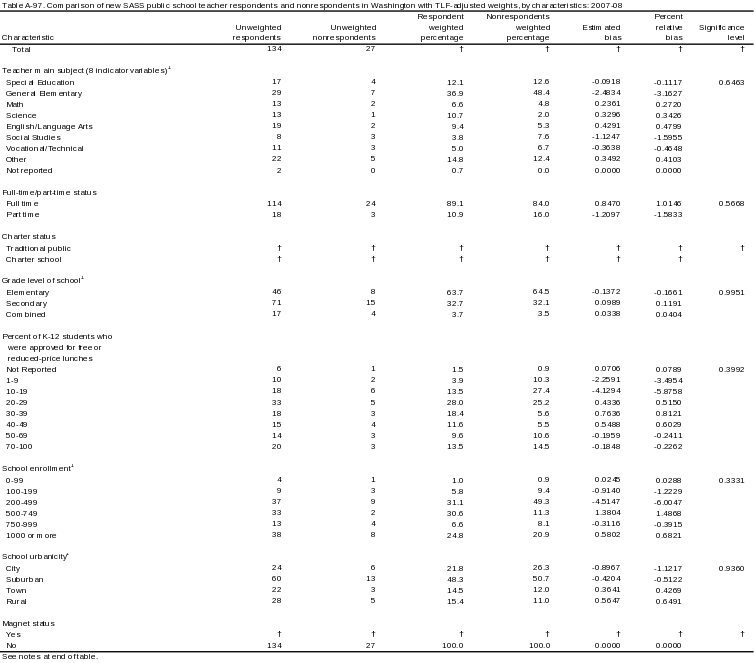
Attachment 6: Final-Weighted New SASS Public School Teacher State-Level Nonresponse Bias Tables
| File Type | application/msword |
| Author | Jared Coopersmith |
| Last Modified By | Jason Hill |
| File Modified | 2009-10-05 |
| File Created | 2009-10-05 |
© 2026 OMB.report | Privacy Policy