Appendix D
Appendix D - BTLS W4 2011 Video Reminder Experiment Results.doc
Beginning Teacher Longitudinal Study (BTLS) 2009-2012
Appendix D
OMB: 1850-0868
Appendix D
BTLS 2010-11 video Reminder experiment
This memo summarizes the results of the video experiment conducted as part of the 2010-11 Beginning Teacher Longitudinal Study (BTLS), approved December 30, 2010, under OMB# 1850-0868 v.2. In an effort to boost response rates on the fourth wave of BTLS, NCES distributed a video reminder, along with a link to the survey instrument, to study participants who did not respond to the questionnaire by the first follow-up date (February 4, 2011). Because little research exists on the use of a video reminder in increasing response rates, NCES conducted an experiment to evaluate the impact of the video on response rates. The following memo outlines the study design and results of the experiment. It includes literature on the use of multimedia appeals in survey research, the description of the video reminder, the study population, results, and recommendations.
Literature on use of multimedia appeals in survey research
A review of recent literature shows that little research has been done regarding the direct impact of using multimedia appeals, such as a video reminder, on survey response rates. However, some research has indirect implications for the current study. First, studies have found that video can be effective for branding purposes. Romaniuk (2009) demonstrates that visual and verbal branding tactics are associated with higher likelihood that an individual will recall and identify with a particular brand. Likewise, Spalding, Cole, and Fayer (2009) found that online advertising campaigns that used videos were more effective than other types of online advertising campaigns. Secondly, research has found that video can be used to induce attitude change. Robertson et al (2009) found that after viewing a video, participants in their study showed positive attitude change toward considering an option previously viewed as unappealing. Additional research has shown a correlation between positive attitudes and survey responses. Heerwegh and Loosveldt (2009) found that individuals express greater intentions to respond to web-based surveys if they possess a more positive behavioral attitude about the survey, and if they feel a greater moral obligation to respond to the survey. These studies indicate that a video reminder could potentially increase an individual’s brand recognition, and also prompt positive attitude change toward responding to the survey. This experiment aimed to explore whether a video reminder is more effective than a regular reminder to increase initial nonrespondents’ survey responses.
Research questions and methodology
The 2010-11 BTLS data were primarily collected through a web instrument. The first item and several consequent items in the instrument were required questions, and did not allow the respondent to proceed through the survey without giving answers to these questions. These required questions were used to determine teaching status of the respondent (current teacher vs. former teacher; stayer vs. mover), which determine the paths the respondent takes in the survey. The log data produced in the web instrument during the data collection contains dates and the following indicators of completion:
complete (respondent/interviewer completed the required items),
partial-complete – with required items (respondent/interviewer completed the required items),
partial-complete – without required items (respondent/interviewer didn’t complete the required items), or
opened with no answers (respondent/interviewer didn’t answer any questions).
To increase survey responses, NCES created a two minute, animated video of plastic building block characters. Ed, the feature character, explains the content of the survey and the importance of completing the BTLS to a sampled participant who has not yet responded. Ed explains to the initial nonrespondent:
“We’re [the Department of Education] interested in what you’ve been doing since the 2007-08 school year… As a teacher or a former teacher, you are in a special position to provide us vital information about your teaching experiences. With your help we can develop better programs that help teachers and schools find success together.”
Figure 1 below shows a screenshot of the video used for this experiment.
Figure 1. Screenshot of Ed talking to a survey nonrespondent

A list of initial nonrespondents by the telephone follow-up date was obtained through the survey system. These initial nonrespondents were eligible for the experiment if they had working e-mail addresses and were not study refusals. They were randomly assigned to one of two groups – 1) a treatment group which received the reminder email with the link to the video and a link to the survey, or 2) a control group which received the reminder email with only a link to the survey. One consideration during the assignment of the sample was the impact of cash incentives from the previous, the third, wave of BTLS. At that time, half of all participants received a $10 cash incentive and the other half received a $20 cash incentive prior to receiving the survey instrument. The results of the experiment showed that the $20 incentive was more effective. To mitigate this, Census created two experimental groups with the balanced number of initial nonrespondents who received different incentives in the previous administration by merging the list of initial nonrespondents and the wave 3 incentive information before the random assignment.
The video was introduced at the beginning of the email with the short text “Have you met Ed? Would you like to? Check out the video that BTLS has prepared for you!” The introduction ensured that participants in the treatment group knew that the video was included in the reminder they received.
Based on the actual data collected, a Final Interview Status Recode (FI) file was created containing information on case status - whether a case was an interview (i.e. respondent), nonrespondent, or out-of-scope. Both complete surveys and partial-complete surveys with required items answered were considered as study interviews in BTLS processing because they contained key information on teachers’ status. The following research questions were explored:
Did the group receiving the video reminder have a greater number of survey interviews than the group receiving the non-video reminder?
Did the group receiving the video reminder respond to the survey in less average time than the group receiving the non-video reminder?
In order to test the effectiveness of the video reminder compared with the non-video reminder, the study measured the number of survey completions and the average number of days lapsed between the reminder and completion dates of two groups. Chi-square tests were carried out to examine if receiving a video reminder or not had a significant impact on the number of interviews and the average days lapsed between the reminder and the completion date. The analyses were conducted using the fourth wave FI file which included both log data from the web instrument and the final interview status of the survey participants.
Data and Analysis
All first year public school teachers who responded to 2007-08 SASS are included in the BTLS sample and their SASS responses constitute the first wave of data. In 2008-09, these same teachers were asked to complete the longitudinal version of the Teacher Follow-up Survey (TFS) — their responses constitute the second wave of BTLS. The third and fourth wave, in 2009-10 and 2010-11, respectively were conducted as their own surveys and were not part of SASS or TFS.
After the initial mail-out of the fourth wave on January 13, 2011, if sample members had not responded to the survey by the first reminder mail-out on February 7, 2011, had valid e-mail addresses, and were not study refusals at the time of the first reminder, they were assigned into two experimental groups. Group 1 received the video reminder e-mail and group 2 received a regular reminder e-mail. Both groups had a balanced number of initial nonrespondents who received different incentive amounts in the previous administration. Cases deemed out-of-scope (OOS) before the fourth wave were not included in the experiment. A total of 890 sample members were eligible for the experiment prior to assignment of the groups. One additional case was determined out-of-scope after the group assignment and was not included in the analysis. Of those 889, group 1 consisted of 444 sample members and group 2 consisted of 445 sample members.
Experiment Results
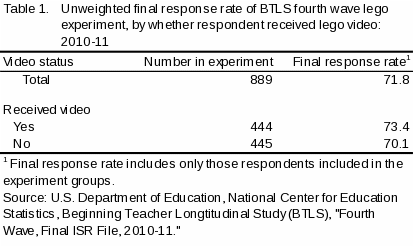
Table 1 shows that the unweighted final response rate among those included in the video experiment was 71.8 percent. Those who received the video had a response rate of 73.4 percent, while those who did not receive the video had a response rate of 70.1 percent. The chi-square test result shows no significant association at the α = .05 or α = .10 level between the response rates for those who received the video and those who did not.

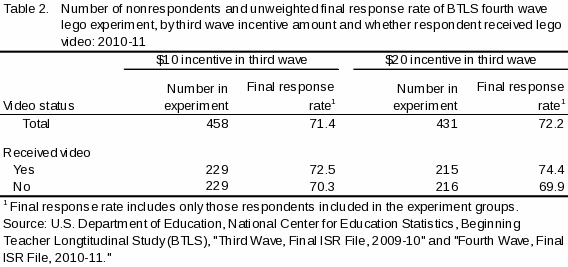
Table 2 shows the number of sample members included in the experiment by their third wave incentive amount and final response rate. There were 458 and 431 sample members included in the experiment who received $10 and $20 incentives during the third wave, respectively.
Among those in the experiment who received a $10 incentive during the third wave, 71.4 percent responded to the survey. There were 229 sample members who received the video and 229 sample members who received a regular reminder. Of those who received the video, 72.5 percent responded to the survey; and of those who did not, 70.3 percent responded to the survey. The chi-square test result shows no significant association at the α = .05 or α = .10 level between whether they received the video and whether they responded.
Among those in the experiment who received a $20 incentive during the third wave, 72.2 percent responded to the survey. There were 215 sample members who received the video and 216 sample members who did not. Of those who received the video, 74.4 percent responded to the survey; and of those who did not receive the video, 69.9 percent responded to the survey. The chi-square test result shows no significant association at the α = .05 or α = .10 level between those whether they received the video and whether they responded.

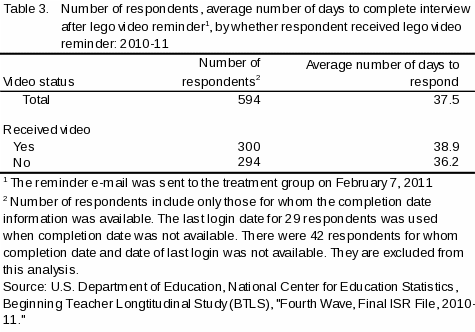
Table 3 shows the number of respondents and the average number of days it took respondents to complete the interview after the video reminder was e-mailed. Information for both those who received the reminder and those who did not is also presented. Because the online instrument only tracked date information for those respondents who reached the last screen, information on when some respondents submitted their survey is not available for 42 respondents involved in the experiment. The average number of days for the 594 respondents involved in the experiment to complete their interview was 37.5 days after the reminder was e-mailed to participants. Of the 300 respondents who received the video, the average number of days to complete the interview was 38.9. Of the 294 respondents who did not receive the video, the average number of days to complete the interview was 36.2. The t-test result showed no significant difference between the average number of days to respond.

Conclusions and recommendations
In summary, the video appeared to have no significant impact on the number of respondents or timeliness of response for the fourth wave. However, the results presented above are limited in that the current instrument did not allow for identification of those sample members who actually viewed the video, only those that received the link. Additionally, the video could only be viewed after the survey participant logged into the instrument. The effect of the video may also have been mitigated by a participant not remembering their password at the time of receiving the reminder. Sending the video out on only one reminder occasion may have also contributed to the findings in this memo. In the future, if a multimedia reminder is used, we recommend that they be sent to the experimental group multiple times until the end of the data collection to increase the likelihood of participants’ viewing it, if technical constraints or concerns don’t allow instant play of the multimedia materials or tracking of the viewing status.
References
Heerwegh, D. and Loosveldt, G. (2009). “Explaining the intention to participate in a web survey: a test of the theory of planned behavior” International Journal of Social Research Methodology 12(3), 181-195.
Robertson, T., Walter, G., Soh, N., Hunt, G., Cleary, M., and Malhi, G. (2009). “Medical students’ attitudes towards a career in psychiatry before and after viewing a promotional DVD” Australian Psychiatry 17(4), 311-317.
Romaniuk, J. (2009). “The efficacy of brand-execution tactics in TV advertising, brand placements, and internet advertising” Journal of Advertising Research 49(2), 143-150.
Spalding, L., Cole, S., and Fayer, A. (2009). “How rich-media video technology boosts branding goals: Different online advertising formats drive different brand-performance metrics” Journal of Advertising Research 49(3), 285-292.
| File Type | application/msword |
| Author | American Institutes for Research |
| Last Modified By | kashka.kubzdela |
| File Modified | 2011-10-03 |
| File Created | 2011-09-21 |
© 2026 OMB.report | Privacy Policy