Attachment E - Sample Indiv NH Feedback Rpt
Attachment E - Sample Indiv NH Feedback Rpt.docx
Nursing Home Survey on Patient Safety Culture Comparative Database
Attachment E - Sample Indiv NH Feedback Rpt
OMB: 0935-0195
Attachment E: Sample Individual Nursing Home Feedback Report

Nursing Home Survey on Patient Safety Culture
Individual Nursing Home Feedback Report
<Nursing Home Name>
<City>, <State>
<Month> <Year>
Prepared by Westat under Contract No. HHSA 290200710024C
Sponsored by the Agency for Healthcare Research and Quality (AHRQ)
Westat
1600 Research Blvd
Rockville, MD
Email: [email protected]
Respondent Demographics for <Nursing Home Name> |
|||
|
|
|
|
Your Nursing Home Completed Survey Data Collection |
<EndMonth> <EndYear> |
||
|
|
||
Survey Administration Statistics |
|
||
Number of completed surveys (response rate numerator) |
<Numerator> |
||
Number of surveys administered (response rate denominator) |
<Denominator> |
||
Response rate |
<ResponseRate> |
||
Respondent Demographics for <Nursing Home Name> |
Job Title (Survey Item: F1) |
N |
% |
Administrator/Manager |
212 |
6% |
Physician (MD, DO) |
49 |
1% |
Other Provider |
178 |
5% |
Licensed Nurse |
0 |
0% |
Nursing Assistant/Aide |
1,160 |
33% |
Direct Care Staff |
0 |
0% |
Administrative Support Staff |
1 |
0% |
Support Staff |
4 |
0% |
Other |
33 |
1% |
Total |
3,560 |
100% |
Missing |
150 |
|
Work Area/Unit (Survey Item: F7) |
N |
% |
Many different areas in this nursing home/No specific area or unit |
65 |
2% |
Alzheimer’s/Dementia unit |
126 |
3% |
Rehab unit |
14 |
0% |
Skilled nursing unit |
74 |
2% |
Other area or unit |
227 |
6% |
Total |
3,612 |
100% |
Missing |
98 |
|
Time Worked in the Hospital (Years) (Survey Item: F2) |
N |
% |
Less than 2 months |
0 |
0% |
2 to 11 months |
0 |
0% |
1 to 2 years |
0 |
0% |
3 to 5 years |
0 |
0% |
6 to 10 years |
0 |
0% |
11 years or more |
0 |
0% |
Total |
0 |
0% |
Missing |
3,710 |
|
Report Note: Percent totals in tables and charts in this report may not sum to exactly 100% due to rounding of decimals.
Respondent Demographics for <Nursing Home Name> |
||
Usual Hours Worked per Week (Survey Item: F3) |
N |
% |
15 or fewer hours per week |
511 |
14% |
16 to 24 hours per week |
1,241 |
35% |
25 to 40 hours per week |
767 |
21% |
More than 40 hours per week |
346 |
10% |
Total |
3,572 |
100% |
Missing |
138 |
|
Shift Worked Most Often (Survey Item: F4) |
N |
% |
Days |
0 |
0% |
Evenings |
0 |
0% |
Nights |
0 |
0% |
Total |
0 |
0% |
Missing |
3,710 |
|
Staffing Agency Status (Survey Item: F5) |
N |
% |
Paid by a staffing agency |
375 |
10% |
Not paid by a staffing agency |
1,099 |
31% |
Total |
3,590 |
100% |
Missing |
120 |
|
Interaction with Patients (Survey Item: F6) |
N |
% |
YES, I work directly with residents most of the time. |
2,295 |
65% |
NO, I do NOT work directly with the residents most of the time. |
1,245 |
35% |
Total |
3,540 |
100% |
Missing |
170 |
|
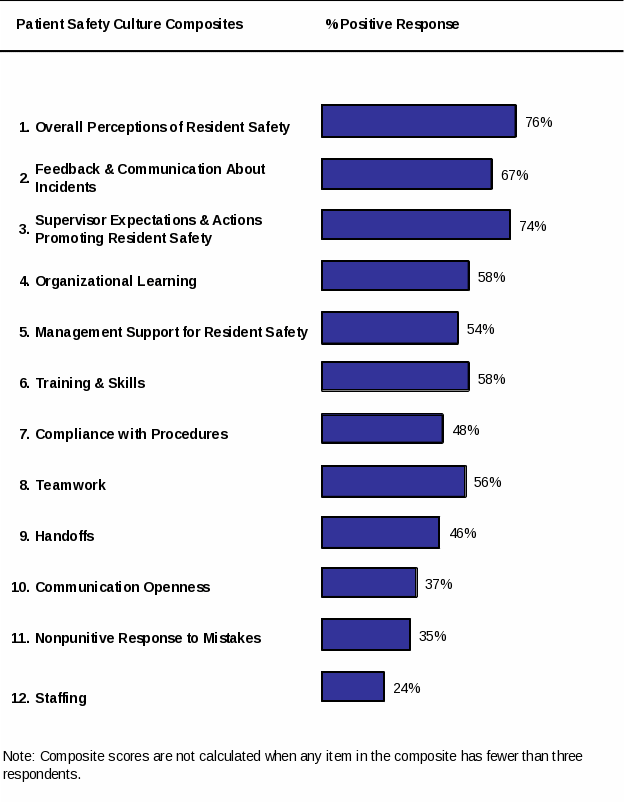
Composite-Level Results for <Nursing Home Name>
 Item-Level
Results for <Nursing Home Name>
![]()
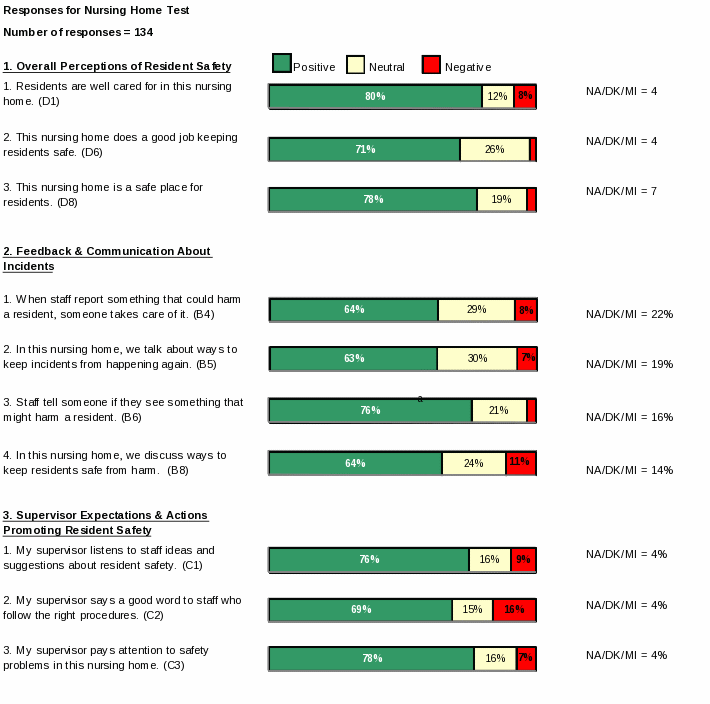
Notes: 1) "R" = a negatively worded item; 2) Chart totals exclude respondents who selected Not Applicable/Don’t Know/Missing (NA/DK/MI) and may not sum to 100% due to rounding of decimals; 3) Number of respondents selecting NA/DK/MI for each item displayed to the right; 4) Item data not displayed for fewer than 3 respondents; 5) % not displayed for 5% or less.
Item-Level Results for <Nursing Home Name>
![]()
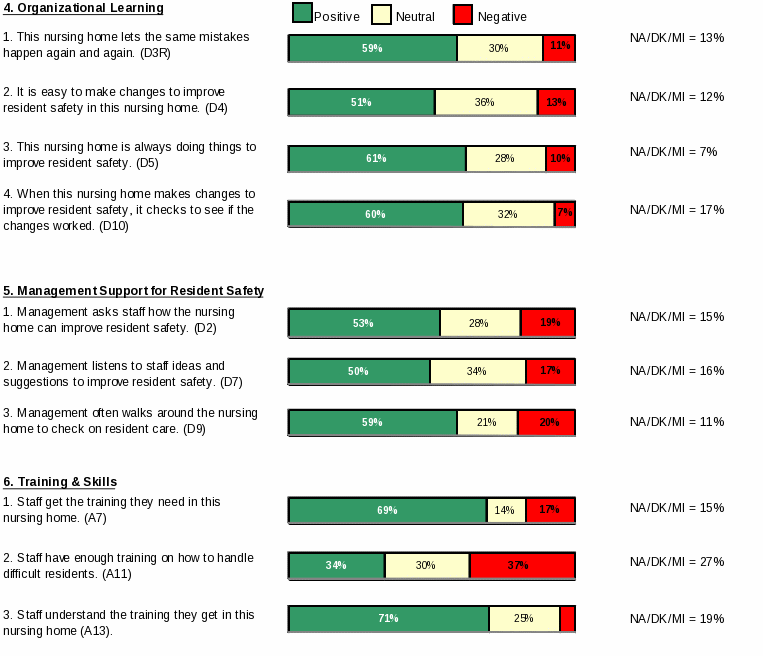
Notes: 1) "R" = a negatively worded item; 2) Chart totals exclude respondents who selected Not Applicable/Don’t Know/Missing (NA/DK/MI) and may not sum to 100% due to rounding of decimals; 3) Number of respondents selecting NA/DK/MI for each item displayed to the right; 4) Item data not displayed for fewer than 3 respondents; 5) % not displayed for 5% or less.
Item-Level Results for <Nursing Home Name>
![]()
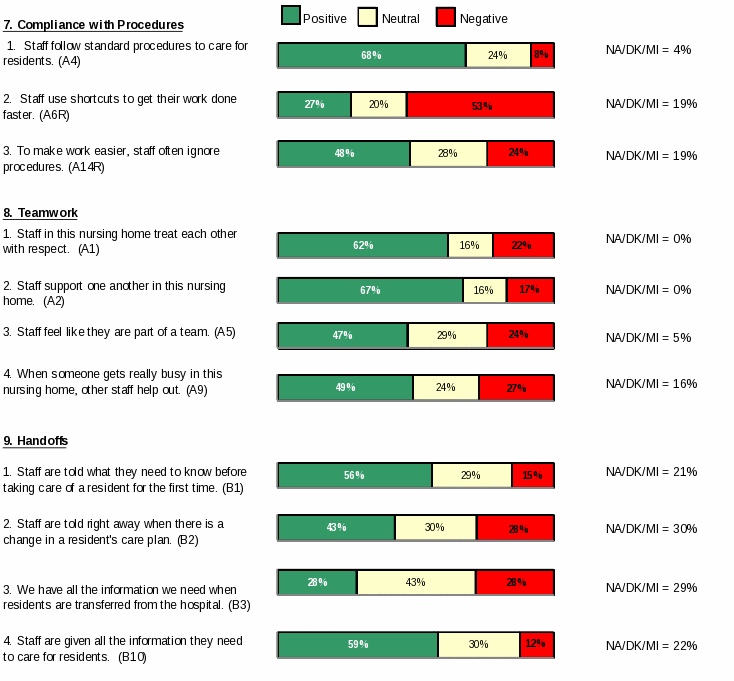
Notes: 1) "R" = a negatively worded item; 2) Chart totals exclude respondents who selected Not Applicable/Don’t Know/Missing (NA/DK/MI) and may not sum to 100% due to rounding of decimals; 3) Number of respondents selecting NA/DK/MI for each item displayed to the right; 4) Item data not displayed for fewer than 3 respondents; 5) % not displayed for 5% or less.
Item-Level Results for <Nursing Home Name>
![]()
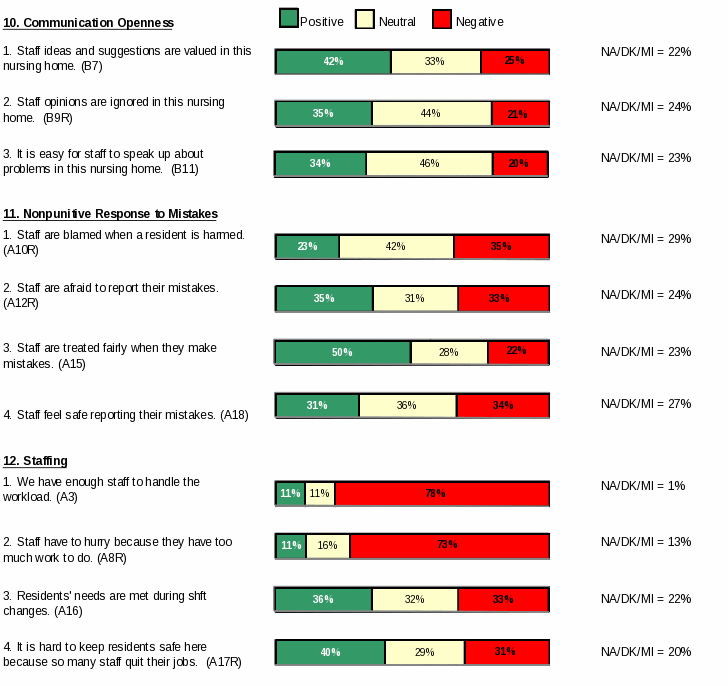
Notes: 1) "R" = a negatively worded item; 2) Chart totals exclude respondents who selected Not Applicable/Don’t Know/Missing (NA/DK/MI) and may not sum to 100% due to rounding of decimals; 3) Number of respondents selecting NA/DK/MI for each item displayed to the right; 4) Item data not displayed for fewer than 3 respondents; 5) % not displayed for 5% or less.
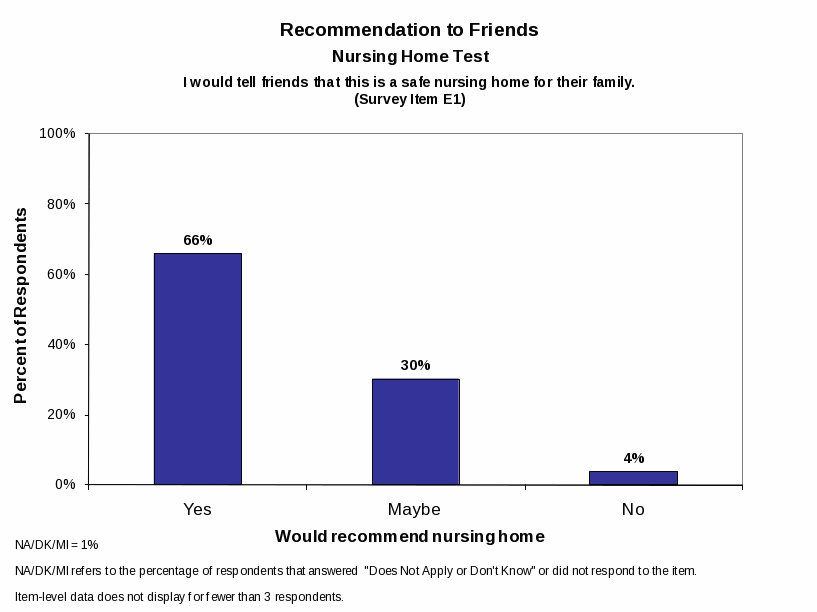
Note: Item level data does not display for fewer than 3 respondents.

Note: Item level data does not display for fewer than 3 respondents.
Top Three Nursing Home Patient Safety Culture Composites

Bottom Three Nursing Home Patient Safety Culture Composites
 Top
Five Nursing Home Patient Safety Culture Items
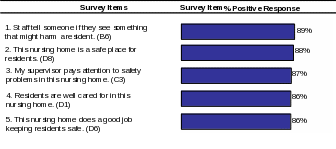
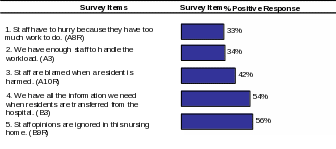
Bottom Five Nursing Home Patient Safety Culture Items
Composite-Level Percent Positive Response – Comparative Results
Nursing
Home: Test NH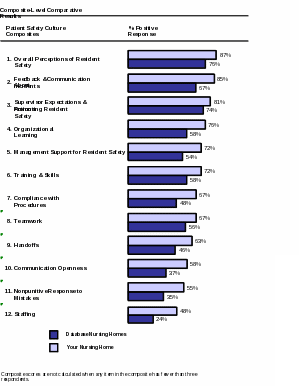
Item-Level Percent Positive Response – Comparative Results
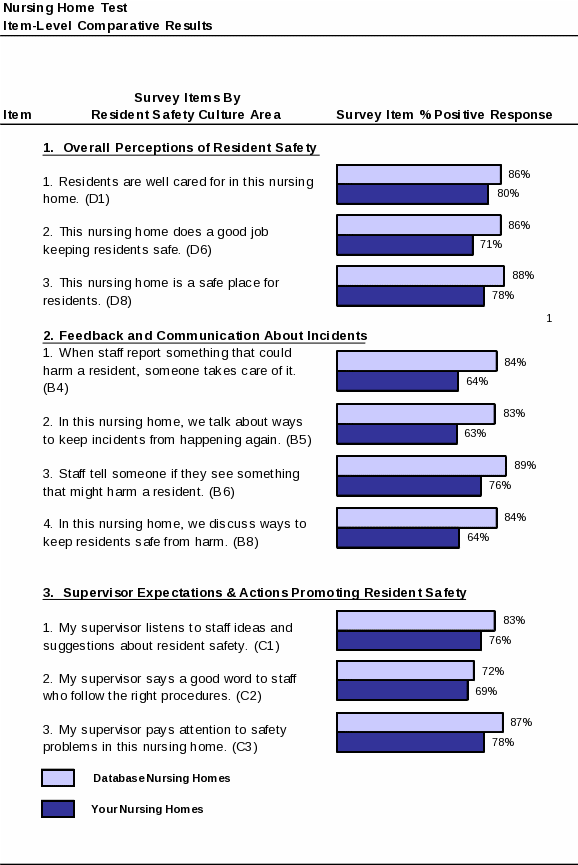
Notes: 1) Comparative results are based on data from xx nursing homes included in the Nursing Home Survey on Patient Safety Culture 2011 Comparative Database Report; 2) “R” indicates a negatively worded item; 3) Item data not displayed for fewer than 3 respondents.
Item-Level Percent Positive Response – Comparative Results
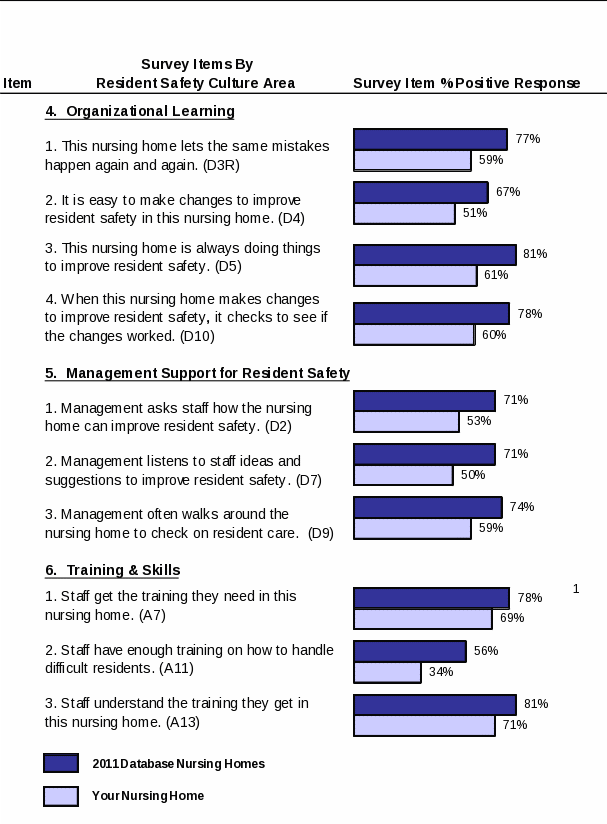
Notes: 1) Comparative results are based on data from xx nursing homes included in the Nursing Home Survey on Patient Safety Culture 2011 Comparative Database Report; 2) “R” indicates a negatively worded item; 3) Item data not displayed for fewer than 3 respondents.
Item-Level Percent Positive Response – Comparative Results
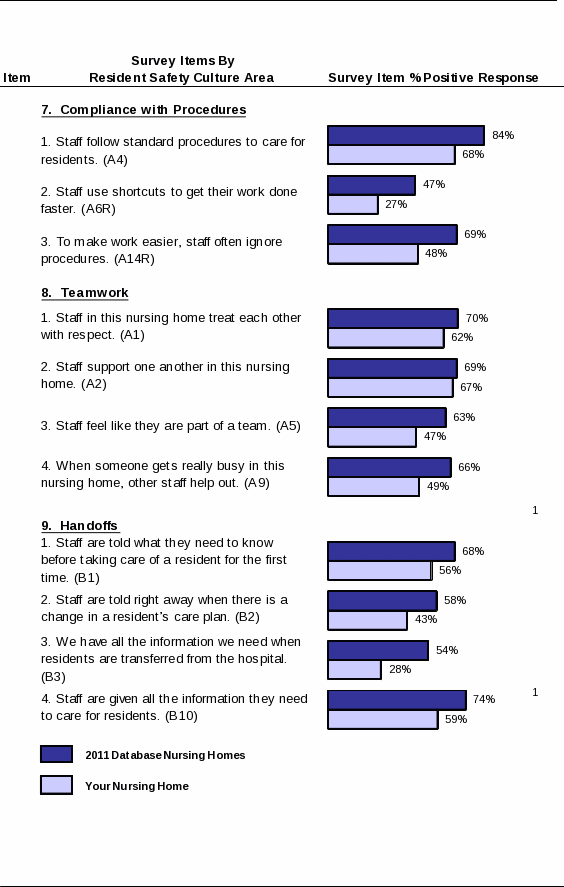
Notes: 1) Comparative results are based on data from xx nursing homes included in the Nursing Home Survey on Patient Safety Culture 2011 Comparative Database Report; 2) “R” indicates a negatively worded item; 3) Item data not displayed for fewer than 3 respondents.
Item-Level Percent Positive Response – Comparative Results

Notes: 1) Comparative results are based on data from xx nursing homes included in the Nursing Home Survey on Patient Safety Culture 2011 Comparative Database Report; 2) “R” indicates a negatively worded item; 3) Item data not displayed for fewer than 3 respondents.
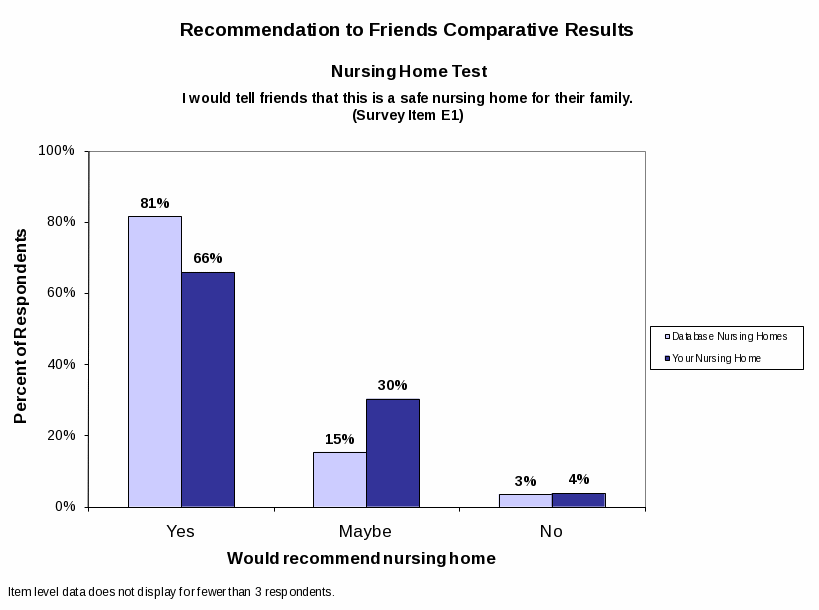
Notes: 1) Item level data does not display for fewer than 3 respondents; 2) Comparative results are based on data from xx nursing homes included in the Hospital Survey on Patient Safety Culture 2011 Comparative Database Report.
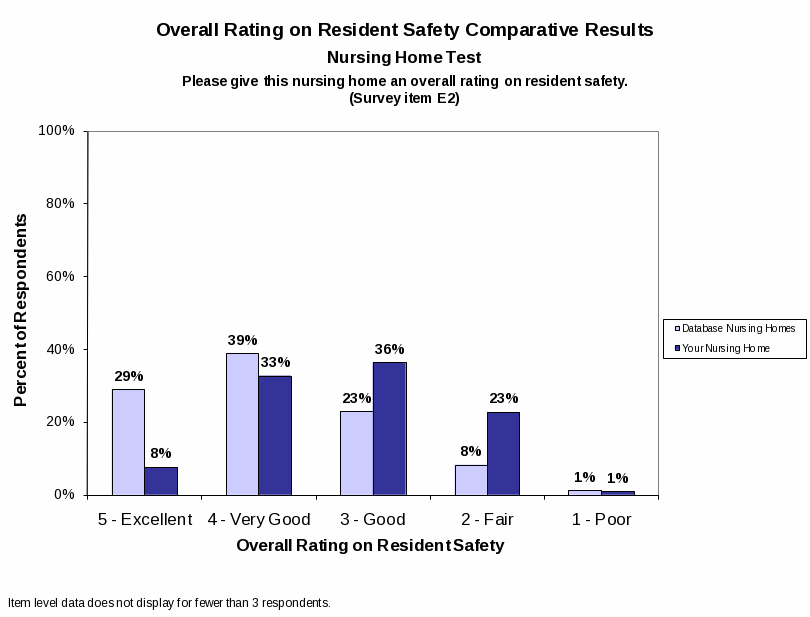
Notes: 1) Item level data does not display for fewer than 3 respondents; 2) Comparative results are based on data from xx nursing homes included in the Hospital Survey on Patient Safety Culture 2011 Comparative Database Report.
Comparative Results by Job Title
Composite-level Comparative Results by Job Title
|
|
Job Title |
|||||||||||
Patient Safety Culture Composites |
Dataset |
Admin/ Manager |
Admin Support Staff |
Direct Care Staff |
Licensed Nurse |
Nursing Asst/ Aide |
Other Provider |
Physician (MD, DO) |
Support Staff |
||||
# Hospitals |
Database |
225 |
225 |
225 |
225 |
225 |
225 |
225 |
225 |
||||
# Respondents |
Database |
1,184 |
11,928 |
15,340 |
10,090 |
25,902 |
10,229 |
8,091 |
19,085 |
||||
|
Your Nursing Home |
2,565 |
10,545 |
13,041 |
8,994 |
18,970 |
8,598 |
6,976 |
16,851 |
||||
1. Overall Perceptions of Resident Safety |
Database |
81% |
78% |
84% |
75% |
77% |
80% |
82% |
76% |
||||
Your Nursing Home |
81% |
78% |
84% |
75% |
77% |
80% |
82% |
76% |
|||||
2. Feedback and Communication About Incidents |
Database |
75% |
70% |
74% |
75% |
74% |
71% |
75% |
72% |
||||
Your Nursing Home |
75% |
70% |
74% |
75% |
74% |
71% |
75% |
72% |
|||||
3. Supervisor Expectations & Actions Promoting Resident Safety |
Database |
75% |
70% |
74% |
75% |
74% |
71% |
75% |
72% |
||||
Your Nursing Home |
75% |
70% |
74% |
75% |
74% |
71% |
75% |
72% |
|||||
4. Organizational Learning |
Database |
75% |
70% |
74% |
75% |
74% |
71% |
75% |
72% |
||||
Your Nursing Home |
75% |
70% |
74% |
75% |
74% |
71% |
75% |
72% |
|||||
5. Management Support for Resident Safety |
Database |
75% |
70% |
74% |
75% |
74% |
71% |
75% |
72% |
||||
Your Nursing Home |
75% |
70% |
74% |
75% |
74% |
71% |
75% |
72% |
|||||
6. Training & Skills |
Database |
73% |
67% |
75% |
73% |
74% |
72% |
74% |
74% |
||||
Your Nursing Home |
73% |
67% |
75% |
73% |
74% |
72% |
74% |
74% |
|||||
7. Compliance with Procedures |
Database |
73% |
67% |
75% |
73% |
74% |
72% |
74% |
74% |
||||
Your Nursing Home |
73% |
67% |
75% |
73% |
74% |
72% |
74% |
74% |
|||||
8. Teamwork |
Database |
69% |
64% |
66% |
75% |
69% |
69% |
73% |
69% |
||||
Your Nursing Home |
69% |
64% |
66% |
75% |
69% |
69% |
73% |
69% |
|||||
9. Handoffs |
Database |
69% |
64% |
66% |
75% |
69% |
69% |
73% |
69% |
||||
Your Nursing Home |
69% |
64% |
66% |
75% |
69% |
69% |
73% |
69% |
|||||
10. Communication Openness |
Database |
73% |
67% |
75% |
73% |
74% |
72% |
74% |
74% |
||||
Your Nursing Home |
73% |
67% |
75% |
73% |
74% |
72% |
74% |
74% |
|||||
11. Nonpunitive Response to Mistakes |
Database |
66% |
56% |
62% |
70% |
59% |
64% |
68% |
66% |
||||
Your Nursing Home |
66% |
56% |
62% |
70% |
59% |
64% |
68% |
66% |
|||||
12. Staffing |
Database |
65% |
58% |
62% |
64% |
62% |
62% |
64% |
64% |
||||
Your Nursing Home |
65% |
58% |
62% |
64% |
62% |
62% |
64% |
64% |
|||||
Notes: 1) Respondents who selected "Other," and missing are not shown. 2) Comparative results are based on data from xx nursing homes included in the Nursing Home Survey on Patient Safety Culture 2011 Comparative Database Report; 3) Composite scores are not calculated when a work area has fewer than 5 respondents and any item in the composite has fewer than 3 respondents.
Item-level Comparative Results by Job Title (Page 1 of 4)
|
|
|
Job Title |
||||||||||||||
Survey Items by Composite |
Dataset |
Admin/ Manager |
Admin Support Staff |
Direct Care Staff |
Licensed Nurse |
Nursing Asst/ Aide |
Other Provider |
Physician (MD, DO) |
Support Staff |
||||||||
# Hospitals |
Database |
225 |
225 |
225 |
225 |
225 |
225 |
225 |
225 |
||||||||
# Respondents
|
Database |
1,184 |
11,928 |
15,340 |
10,090 |
25,902 |
10,229 |
8,091 |
19,085 |
||||||||
Your Nursing Home |
2,565 |
10,545 |
13,041 |
8,994 |
18,970 |
8,598 |
6,976 |
16,851 |
|||||||||
1. |
Overall Perceptions of Resident Safety |
|
|
|
|
|
|
|
|
|
|||||||
1. |
Residents are well cared for in this nursing home. (D1) |
Database |
88% |
84% |
89% |
81% |
85% |
86% |
88% |
83% |
|||||||
Your Nursing Home |
88% |
84% |
89% |
81% |
85% |
86% |
88% |
83% |
|||||||||
2. |
This nursing home does a good job keeping residents safe. (D6) |
Database |
87% |
85% |
90% |
82% |
81% |
88% |
87% |
85% |
|||||||
Your Nursing Home |
87% |
85% |
90% |
82% |
81% |
88% |
87% |
85% |
|||||||||
3. |
3. This nursing home is a safe place for residents. (D8) |
Database |
81% |
73% |
80% |
73% |
78% |
76% |
81% |
73% |
|||||||
Your Nursing Home |
81% |
73% |
80% |
73% |
78% |
76% |
81% |
73% |
|||||||||
2. |
Feedback and Communication About Incidents |
|
|
|
|
|
|
|
|
|
|||||||
1. |
When staff report something that could harm a resident, someone takes care of it. (B4) |
Database |
88% |
84% |
89% |
81% |
85% |
86% |
88% |
83% |
|||||||
Your Nursing Home |
88% |
84% |
89% |
81% |
85% |
86% |
88% |
83% |
|||||||||
2. |
In this nursing home, we talk about ways to keep incidents from happening again. (B5) |
Database |
87% |
85% |
90% |
82% |
81% |
88% |
87% |
85% |
|||||||
Your Nursing Home |
87% |
85% |
90% |
82% |
81% |
88% |
87% |
85% |
|||||||||
3. |
Staff tell someone if they see something that might harm a resident. (B6) |
Database |
81% |
73% |
80% |
73% |
78% |
76% |
81% |
73% |
|||||||
Your Nursing Home |
81% |
73% |
80% |
73% |
78% |
76% |
81% |
73% |
|||||||||
4. |
In this nursing home, we discuss ways to keep residents safe from harm. (B8) |
Database |
67% |
69% |
78% |
65% |
64% |
69% |
73% |
65% |
|||||||
Your Nursing Home |
67% |
69% |
78% |
65% |
64% |
69% |
73% |
65% |
|||||||||
3. |
Supervisor Expectations & Actions Promoting Resident Safety |
|
|
|
|
|
|
|
|
|
|||||||
1. |
My supervisor listens to staff ideas and suggestions about resident safety. (C1) |
Database |
87% |
85% |
90% |
82% |
81% |
88% |
87% |
85% |
|||||||
Your Nursing Home |
87% |
85% |
90% |
82% |
81% |
88% |
87% |
85% |
|||||||||
2. |
My supervisor says a good word to staff who follow the right procedures. (C2) |
Database |
81% |
73% |
80% |
73% |
78% |
76% |
81% |
73% |
|||||||
Your Nursing Home |
81% |
73% |
80% |
73% |
78% |
76% |
81% |
73% |
|||||||||
3. |
My supervisor pays attention to safety problems in this nursing home. (C3) |
Database |
67% |
69% |
78% |
65% |
64% |
69% |
73% |
65% |
|||||||
Your Nursing Home |
67% |
69% |
78% |
65% |
64% |
69% |
73% |
65% |
|||||||||
Notes: 1) Respondents who selected "Other," and missing are not shown. 2) Comparative results are based on data from xx nursing homes included in the Nursing Home Survey on Patient Safety Culture 2011 Comparative Database Report; 3) “R” = a negatively worded item; 4) Data are not only displayed for job titles where there are fewer than 5 respondents and item data are not displayed for fewer than 3 respondents. |
Item-level Comparative Results by Job Title (Page 2 of 4)
|
|
Job Title |
||||||||
Survey Items by Composite |
Dataset |
Admin/ Manager |
Admin Support Staff |
Direct Care Staff |
Licensed Nurse |
Nursing Asst/ Aide |
Other Provider |
Physician (MD, DO) |
Support Staff |
|
# Respondents |
Database |
1,184 |
11,928 |
15,340 |
10,090 |
25,902 |
10,229 |
8,091 |
19,085 |
|
Your Nursing Home |
2,565 |
10,545 |
13,041 |
8,994 |
18,970 |
8,598 |
6,976 |
16,851 |
||
4. |
Organizational Learning |
|
|
|
|
|
|
|
|
|
1. |
This nursing home lets the same mistakes happen again and again. (D3R) |
Database |
88% |
84% |
89% |
81% |
85% |
86% |
88% |
83% |
Your Nursing Home |
88% |
84% |
89% |
81% |
85% |
86% |
88% |
83% |
||
2. |
It is easy to make changes to improve resident safety in this nursing home. (D4) |
Database |
87% |
85% |
90% |
82% |
81% |
88% |
87% |
85% |
Your Nursing Home |
87% |
85% |
90% |
82% |
81% |
88% |
87% |
85% |
||
3. |
This nursing home is always doing things to improve resident safety. (D5) |
Database |
81% |
73% |
80% |
73% |
78% |
76% |
81% |
73% |
Your Nursing Home |
81% |
73% |
80% |
73% |
78% |
76% |
81% |
73% |
||
4. |
When this nursing home makes changes to improve resident safety, it checks to see if the changes worked. (D10) |
Database |
81% |
73% |
80% |
73% |
78% |
76% |
81% |
73% |
Your Nursing Home |
81% |
73% |
80% |
73% |
78% |
76% |
81% |
73% |
||
5. |
Management Support for Resident Safety |
|
|
|
|
|
|
|
|
|
1. |
When staff report something that could harm a resident, someone takes care of it. (B4) |
Database |
88% |
84% |
89% |
81% |
85% |
86% |
88% |
83% |
Your Nursing Home |
88% |
84% |
89% |
81% |
85% |
86% |
88% |
83% |
||
2. |
In this nursing home, we talk about ways to keep incidents from happening again. (B5) |
Database |
87% |
85% |
90% |
82% |
81% |
88% |
87% |
85% |
Your Nursing Home |
87% |
85% |
90% |
82% |
81% |
88% |
87% |
85% |
||
3. |
Staff tell someone if they see something that might harm a resident. (B6) |
Database |
81% |
73% |
80% |
73% |
78% |
76% |
81% |
73% |
Your Nursing Home |
81% |
73% |
80% |
73% |
78% |
76% |
81% |
73% |
||
6. |
Training & Skills |
|
|
|
|
|
|
|
|
|
1. |
Staff get the training they need in this nursing home. (A7) |
Database |
87% |
85% |
90% |
82% |
81% |
88% |
87% |
85% |
Your Nursing Home |
87% |
85% |
90% |
82% |
81% |
88% |
87% |
85% |
||
2. |
Staff have enough training on how to handle difficult residents. (A11) |
Database |
81% |
73% |
80% |
73% |
78% |
76% |
81% |
73% |
Your Nursing Home |
81% |
73% |
80% |
73% |
78% |
76% |
81% |
73% |
||
3. |
Staff understand the training they get in this nursing home. (A13) |
Database |
67% |
69% |
78% |
65% |
64% |
69% |
73% |
65% |
Your Nursing Home |
67% |
69% |
78% |
65% |
64% |
69% |
73% |
65% |
||
Notes: 1) Respondents who selected "Other," and missing are not shown. 2) Comparative results are based on data from xx nursing homes included in the Nursing Home Survey on Patient Safety Culture 2011 Comparative Database Report; 3) “R” = a negatively worded item; 4) Data are not only displayed for job titles where there are fewer than 5 respondents and item data are not displayed for fewer than 3 respondents. |
Item-level Comparative Results by Job Title (Page 3 of 4)
|
|
|
Job Title |
|||||||
Survey Items by Composite |
Dataset |
Admin/ Manager |
Admin Support Staff |
Direct Care Staff |
Licensed Nurse |
Nursing Asst/ Aide |
Other Provider |
Physician (MD, DO) |
Support Staff |
|
# Respondents |
Database |
1,184 |
11,928 |
15,340 |
10,090 |
25,902 |
10,229 |
8,091 |
19,085 |
|
Your Nursing Home |
2,565 |
10,545 |
13,041 |
8,994 |
18,970 |
8,598 |
6,976 |
16,851 |
||
7. |
Compliance with Procedures |
|
|
|
|
|
|
|
|
|
1. |
Staff follow standard procedures to care for residents. (A4) |
Database |
88% |
84% |
89% |
81% |
85% |
86% |
88% |
83% |
Your Nursing Home |
88% |
84% |
89% |
81% |
85% |
86% |
88% |
83% |
||
2. |
Staff use shortcuts to get their work done faster. (A6R) |
Database |
87% |
85% |
90% |
82% |
81% |
88% |
87% |
85% |
Your Nursing Home |
87% |
85% |
90% |
82% |
81% |
88% |
87% |
85% |
||
3. |
To make work easier, staff often ignore procedures. (A14R) |
Database |
81% |
73% |
80% |
73% |
78% |
76% |
81% |
73% |
Your Nursing Home |
81% |
73% |
80% |
73% |
78% |
76% |
81% |
73% |
||
8. |
Teamwork |
|
|
|
|
|
|
|
|
|
1. |
Staff in this nursing home treat each other with respect. (A1) |
Database |
88% |
84% |
89% |
81% |
85% |
86% |
88% |
83% |
Your Nursing Home |
88% |
84% |
89% |
81% |
85% |
86% |
88% |
83% |
||
2. |
Staff support one another in this nursing home. (A2) |
Database |
87% |
85% |
90% |
82% |
81% |
88% |
87% |
85% |
Your Nursing Home |
87% |
85% |
90% |
82% |
81% |
88% |
87% |
85% |
||
3. |
Staff feel like they are part of a team. (A5) |
Database |
81% |
73% |
80% |
73% |
78% |
76% |
81% |
73% |
Your Nursing Home |
81% |
73% |
80% |
73% |
78% |
76% |
81% |
73% |
||
4. |
When someone gets really busy in this nursing home, other staff help out. (A9) |
Database |
67% |
69% |
78% |
65% |
64% |
69% |
73% |
65% |
Your Nursing Home |
67% |
69% |
78% |
65% |
64% |
69% |
73% |
65% |
||
9. |
Handoffs |
|
|
|
|
|
|
|
|
|
1. |
Staff are told what they need to know before taking care of a resident for the first time. (B1) |
Database |
87% |
85% |
90% |
82% |
81% |
88% |
87% |
85% |
Your Nursing Home |
87% |
85% |
90% |
82% |
81% |
88% |
87% |
85% |
||
2. |
Staff are told right away when there is a change in a resident's care plan. (B2) |
Database |
81% |
73% |
80% |
73% |
78% |
76% |
81% |
73% |
Your Nursing Home |
81% |
73% |
80% |
73% |
78% |
76% |
81% |
73% |
||
3. |
We have all the information we need when residents are transferred from the hospital. (B3) |
Database |
67% |
69% |
78% |
65% |
64% |
69% |
73% |
65% |
Your Nursing Home |
67% |
69% |
78% |
65% |
64% |
69% |
73% |
65% |
||
4. |
Staff are given all the information they need to care for residents. (B10) |
Database |
67% |
69% |
78% |
65% |
64% |
69% |
73% |
65% |
Your Nursing Home |
67% |
69% |
78% |
65% |
64% |
69% |
73% |
65% |
||
Notes: 1) Respondents who selected "Other," and missing are not shown. 2) Comparative results are based on data from xx nursing homes included in the Nursing Home Survey on Patient Safety Culture 2011 Comparative Database Report; 3) “R” = a negatively worded item; 4) Data are not only displayed for job titles where there are fewer than 5 respondents and item data are not displayed for fewer than 3 respondents.
Item-level Comparative Results by Job Title (Page 4 of 4)
|
|
|
Job Title |
|||||||
Survey Items by Composite |
Dataset |
Admin/ Manager |
Admin Support Staff |
Direct Care Staff |
Licensed Nurse |
Nursing Asst/ Aide |
Other Provider |
Physician (MD, DO) |
Support Staff |
|
|
# Respondents |
Your Nursing Home |
1,184 |
11,928 |
15,340 |
10,090 |
25,902 |
10,229 |
8,091 |
19,085 |
|
Database |
2,565 |
10,545 |
13,041 |
8,994 |
18,970 |
8,598 |
6,976 |
16,851 |
|
10. |
Communication Openness |
|
|
|
|
|
|
|
|
|
1. |
Staff ideas and suggestions are valued in this nursing home. (B7) |
Database |
88% |
84% |
89% |
81% |
85% |
86% |
88% |
83% |
Your Nursing Home |
88% |
84% |
89% |
81% |
85% |
86% |
88% |
83% |
||
2. |
Staff opinions are ignored in this nursing home. (B9R) |
Database |
87% |
85% |
90% |
82% |
81% |
88% |
87% |
85% |
Your Nursing Home |
87% |
85% |
90% |
82% |
81% |
88% |
87% |
85% |
||
3. |
It is easy for staff to speak up about problems in this nursing home. (B11) |
Database |
81% |
73% |
80% |
73% |
78% |
76% |
81% |
73% |
Your Nursing Home |
81% |
73% |
80% |
73% |
78% |
76% |
81% |
73% |
||
11. |
Nonpunitive Response to Mistakes |
|
|
|
|
|
|
|
|
|
1. |
Staff are blamed when a resident is harmed. (A10R) |
Database |
88% |
84% |
89% |
81% |
85% |
86% |
88% |
83% |
Your Nursing Home |
88% |
84% |
89% |
81% |
85% |
86% |
88% |
83% |
||
2. |
Staff are afraid to report their mistakes. (A12R) |
Database |
87% |
85% |
90% |
82% |
81% |
88% |
87% |
85% |
Your Nursing Home |
87% |
85% |
90% |
82% |
81% |
88% |
87% |
85% |
||
3. |
Staff are treated fairly when they make mistakes. (A15) |
Database |
81% |
73% |
80% |
73% |
78% |
76% |
81% |
73% |
Your Nursing Home |
81% |
73% |
80% |
73% |
78% |
76% |
81% |
73% |
||
4. |
Staff feel safe reporting their mistakes. (A18) |
Database |
67% |
69% |
78% |
65% |
64% |
69% |
73% |
65% |
Your Nursing Home |
67% |
69% |
78% |
65% |
64% |
69% |
73% |
65% |
||
12. |
Staffing |
|
|
|
|
|
|
|
|
|
1. |
We have enough staff to handle the workload. (A3) |
Database |
87% |
85% |
90% |
82% |
81% |
88% |
87% |
85% |
Your Nursing Home |
87% |
85% |
90% |
82% |
81% |
88% |
87% |
85% |
||
2. |
Staff have to hurry because they have too much work to do. (A8R) |
Database |
81% |
73% |
80% |
73% |
78% |
76% |
81% |
73% |
Your Nursing Home |
81% |
73% |
80% |
73% |
78% |
76% |
81% |
73% |
||
3. |
Residents' needs are met during shft changes. (A16) |
Database |
67% |
69% |
78% |
65% |
64% |
69% |
73% |
65% |
Your Nursing Home |
67% |
69% |
78% |
65% |
64% |
69% |
73% |
65% |
||
4. |
It is hard to keep residents safe here because so many staff quit their jobs. (A17) |
Database |
67% |
69% |
78% |
65% |
64% |
69% |
73% |
65% |
Your Nursing Home |
67% |
69% |
78% |
65% |
64% |
69% |
73% |
65% |
||
Notes: 1) Respondents who selected "Other," and missing are not shown. 2) Comparative results are based on data from xx nursing homes included in the Nursing Home Survey on Patient Safety Culture 2011 Comparative Database Report; 3) “R” = a negatively worded item; 4) Data are not only displayed for job titles where there are fewer than 5 respondents and item data are not displayed for fewer than 3 respondents.
|
Willingness to Recommend Nursing Home Comparative Results by Job Title
-
Job Title
Willingness to Recommend Nursing Home
Dataset
Admin/
Manager
Admin
Support Staff
Direct Care Staff
Licensed Nurse
Nursing Asst/
Aide
Other Provider
Physician (MD, DO)
Support Staff
# Respondents
Database
61
348
289
324
374
244
139
343
Your Nursing Home
2,565
10,545
13,041
8,994
18,970
8,598
6,976
16,851
Yes
Database
60%
60%
60%
60%
60%
60%
60%
60%
Your Nursing Home
60%
60%
60%
60%
60%
60%
60%
60%
Maybe
Database
25%
25%
25%
25%
25%
25%
25%
25%
Your Nursing Home
25%
25%
25%
25%
25%
25%
25%
25%
No
Database
15%
15%
15%
15%
15%
15%
15%
15%
Your Nursing Home
15%
15%
15%
15%
15%
15%
15%
15%
Notes: 1) Percent totals in the table may not sum to exactly 100% due to rounding of decimals; 2) Respondents who selected "Other," and missing are not shown; 3) Comparative results are based on data from xx nursing homes included in the Nursing Home Survey on Patient Safety Culture 2011 Comparative Database Report; 4) Data are not only displayed for job titles where there are fewer than 5 respondents and item data are not displayed for fewer than 3 respondents.
Overall Rating on Resident Safety Comparative Results by Job Title
-
Job Title
Overall Rating on Resident Safety
Dataset
Admin/
Manager
Admin
Support Staff
Direct Care Staff
Licensed Nurse
Nursing Asst/
Aide
Other Provider
Physician (MD, DO)
Support Staff
# Respondents
Database
61
348
289
324
374
244
139
343
Your Nursing Home
2,565
10,545
13,041
8,994
18,970
8,598
6,976
16,851
5 – Excellent
Database
15%
15%
15%
15%
15%
15%
15%
15%
Your Nursing Home
15%
15%
15%
15%
15%
15%
15%
15%
4 – Very Good
Database
35%
35%
35%
35%
35%
35%
35%
35%
Your Nursing Home
35%
35%
35%
35%
35%
35%
35%
35%
3 – Good
Database
25%
25%
25%
25%
25%
25%
25%
25%
Your Nursing Home
25%
25%
25%
25%
25%
25%
25%
25%
2 – Fair
Database
15%
15%
15%
15%
15%
15%
15%
15%
Your Nursing Home
15%
15%
15%
15%
15%
15%
15%
15%
1 – Poor
Database
10%
10%
10%
10%
10%
10%
10%
10%
Your Nursing Home
10%
10%
10%
10%
10%
10%
10%
10%
Notes: 1) Percent totals in the table may not sum to exactly 100% due to rounding of decimals; 2) Respondents who selected "Other," and missing are not shown; 3) Comparative results are based on data from xx nursing homes included in the Nursing Home Survey on Patient Safety Culture 2011 Comparative Database Report; 4) Data are not only displayed for job titles where there are fewer than 5 respondents and item data are not displayed for fewer than 3 respondents.
Comparative Results by Work Area
Composite-level Comparative Results by Work Area
|
|
Work Area |
|||
Patient Safety Culture Composites |
Dataset |
Alzheimer’s/ Dementia Unit |
Many/ No specific area or unit |
Rehab Unit |
Skilled Nursing Unit |
# Respondents |
Database |
61 |
348 |
289 |
343 |
Your Nursing Home |
2,565 |
10,545 |
13,041 |
16,851 |
|
1. Overall Perceptions of Resident Safety |
Database |
81% |
78% |
84% |
76% |
Your Nursing Home |
81% |
78% |
84% |
76% |
|
2. Feedback and Communication About Incidents |
Database |
75% |
70% |
74% |
72% |
Your Nursing Home |
75% |
70% |
74% |
72% |
|
3. Supervisor Expectations & Actions Promoting Resident Safety |
Database |
75% |
70% |
74% |
72% |
Your Nursing Home |
75% |
70% |
74% |
72% |
|
4. Organizational Learning |
Database |
75% |
70% |
74% |
72% |
Your Nursing Home |
75% |
70% |
74% |
72% |
|
5. Management Support for Resident Safety |
Database |
75% |
70% |
74% |
72% |
Your Nursing Home |
75% |
70% |
74% |
72% |
|
6. Training & Skills |
Database |
73% |
67% |
75% |
74% |
Your Nursing Home |
73% |
67% |
75% |
74% |
|
7. Compliance with Procedures |
Database |
73% |
67% |
75% |
74% |
Your Nursing Home |
73% |
67% |
75% |
74% |
|
8. Teamwork |
Database |
69% |
64% |
66% |
69% |
Your Nursing Home |
69% |
64% |
66% |
69% |
|
9. Handoffs |
Database |
69% |
64% |
66% |
69% |
Your Nursing Home |
69% |
64% |
66% |
69% |
|
10. Communication Openness |
Database |
73% |
67% |
75% |
74% |
Your Nursing Home |
73% |
67% |
75% |
74% |
|
11. Nonpunitive Response to Mistakes |
Database |
66% |
56% |
62% |
66% |
Your Nursing Home |
66% |
56% |
62% |
66% |
|
12. Staffing |
Database |
65% |
58% |
62% |
64% |
Your Nursing Home |
65% |
58% |
62% |
64% |
|
Notes: 1) Respondents who selected "Other," and missing are not shown. 2) Comparative results are based on data from xx nursing homes included in the Nursing Home Survey on Patient Safety Culture 2011 Comparative Database Report; 3) Composite scores are not calculated when a work area has fewer than 5 respondents and any item in the composite has fewer than 3 respondents.
Item-level Comparative Results by Work Area (Page 1 of 4)
|
|
Work Area |
||||
Survey Items by Composite |
Dataset |
Alzheimer’s/ Dementia Unit |
Many/ No specific area or unit |
Rehab Unit |
Skilled Nursing Unit |
|
|
# Respondents |
Database |
1,184 |
11,928 |
15,340 |
19,085 |
|
Your Nursing Home |
2,565 |
10,545 |
13,041 |
16,851 |
|
1. |
Overall Perceptions of Resident Safety |
|
|
|
|
|
1. |
Residents are well cared for in this nursing home. (D1) |
Database |
88% |
84% |
89% |
83% |
Your Nursing Home |
88% |
84% |
89% |
83% |
||
2. |
This nursing home does a good job keeping residents safe. (D6) |
Database |
87% |
85% |
90% |
85% |
Your Nursing Home |
87% |
85% |
90% |
85% |
||
3. |
3. This nursing home is a safe place for residents. (D8) |
Database |
81% |
73% |
80% |
73% |
Your Nursing Home |
81% |
73% |
80% |
73% |
||
2. |
Feedback and Communication About Incidents |
|
|
|
|
|
1. |
When staff report something that could harm a resident, someone takes care of it. (B4) |
Database |
88% |
84% |
89% |
83% |
Your Nursing Home |
88% |
84% |
89% |
83% |
||
2. |
In this nursing home, we talk about ways to keep incidents from happening again. (B5) |
Database |
87% |
85% |
90% |
85% |
Your Nursing Home |
87% |
85% |
90% |
85% |
||
3. |
Staff tell someone if they see something that might harm a resident. (B6) |
Database |
81% |
73% |
80% |
73% |
Your Nursing Home |
81% |
73% |
80% |
73% |
||
4. |
In this nursing home, we discuss ways to keep residents safe from harm. (B8) |
Database |
67% |
69% |
78% |
65% |
Your Nursing Home |
67% |
69% |
78% |
65% |
||
3. |
Supervisor Expectations & Actions Promoting Resident Safety |
|
|
|
|
|
1. |
My supervisor listens to staff ideas and suggestions about resident safety. (C1) |
Database |
87% |
85% |
90% |
85% |
Your Nursing Home |
87% |
85% |
90% |
85% |
||
2. |
My supervisor says a good word to staff who follow the right procedures. (C2) |
Database |
81% |
73% |
80% |
73% |
Your Nursing Home |
81% |
73% |
80% |
73% |
||
3. |
My supervisor pays attention to safety problems in this nursing home. (C3) |
Database |
67% |
69% |
78% |
65% |
Your Nursing Home |
67% |
69% |
78% |
65% |
||
Notes: 1) Respondents who selected "Other," and missing are not shown. 2) Comparative results are based on data from xx nursing homes included in the Nursing Home Survey on Patient Safety Culture 2011 Comparative Database Report; 3) Composite scores are not calculated when a work area has fewer than 5 respondents and any item in the composite has fewer than 3 respondents.
Item-level Comparative Results by Work Area (Page 2 of 4)
|
|
Work Area |
||||
Survey Items by Composite |
Dataset |
Alzheimer’s/ Dementia Unit |
Many/ No specific area or unit |
Rehab Unit |
Skilled Nursing Unit |
|
|
# Respondents |
Your Nursing Home |
1,184 |
11,928 |
15,340 |
19,085 |
|
Database |
2,565 |
10,545 |
13,041 |
16,851 |
|
4. |
Organizational Learning |
|
|
|
|
|
1. |
This nursing home lets the same mistakes happen again and again. (D3R) |
Database |
88% |
84% |
89% |
83% |
Your Nursing Home |
88% |
84% |
89% |
83% |
||
2. |
It is easy to make changes to improve resident safety in this nursing home. (D4) |
Database |
87% |
85% |
90% |
85% |
Your Nursing Home |
87% |
85% |
90% |
85% |
||
3. |
This nursing home is always doing things to improve resident safety. (D5) |
Database |
81% |
73% |
80% |
73% |
Your Nursing Home |
81% |
73% |
80% |
73% |
||
4. |
When this nursing home makes changes to improve resident safety, it checks to see if the changes worked. (D10) |
Database |
81% |
73% |
80% |
73% |
Your Nursing Home |
81% |
73% |
80% |
73% |
||
5. |
Management Support for Resident Safety |
|
|
|
|
|
1. |
When staff report something that could harm a resident, someone takes care of it. (B4) |
Database |
88% |
84% |
89% |
83% |
Your Nursing Home |
88% |
84% |
89% |
83% |
||
2. |
In this nursing home, we talk about ways to keep incidents from happening again. (B5) |
Database |
87% |
85% |
90% |
85% |
Your Nursing Home |
87% |
85% |
90% |
85% |
||
3. |
Staff tell someone if they see something that might harm a resident. (B6) |
Database |
81% |
73% |
80% |
73% |
Your Nursing Home |
81% |
73% |
80% |
73% |
||
6. |
Training & Skills |
|
|
|
|
|
1. |
Staff get the training they need in this nursing home. (A7) |
Database |
87% |
85% |
90% |
85% |
Your Nursing Home |
87% |
85% |
90% |
85% |
||
2. |
Staff have enough training on how to handle difficult residents. (A11) |
Database |
81% |
73% |
80% |
73% |
Your Nursing Home |
81% |
73% |
80% |
73% |
||
3. |
Staff understand the training they get in this nursing home. (A13) |
Database |
67% |
69% |
78% |
65% |
Your Nursing Home |
67% |
69% |
78% |
65% |
||
Notes: 1) Respondents who selected "Other," and missing are not shown. 2) Comparative results are based on data from xx nursing homes included in the Nursing Home Survey on Patient Safety Culture 2011 Comparative Database Report; 3) “R” = a negatively worded item; 4) Data are not only displayed for work areas where there are fewer than 5 respondents and item data are not displayed for fewer than 3 respondents. |
Item-level Comparative Results by Work Area (Page 3 of 4)
|
|
Work Area |
||||
Survey Items by Composite |
Dataset |
Alzheimer’s/ Dementia Unit |
Many/ No specific area or unit |
Rehab Unit |
Skilled Nursing Unit |
|
|
# Respondents |
Database |
1,184 |
11,928 |
15,340 |
19,085 |
|
Your Nursing Home |
2,565 |
10,545 |
13,041 |
16,851 |
|
7. |
Compliance with Procedures |
|
|
|
|
|
1. |
Staff follow standard procedures to care for residents. (A4) |
Database |
88% |
84% |
89% |
83% |
Your Nursing Home |
88% |
84% |
89% |
83% |
||
2. |
Staff use shortcuts to get their work done faster. (A6R) |
Database |
87% |
85% |
90% |
85% |
Your Nursing Home |
87% |
85% |
90% |
85% |
||
3. |
To make work easier, staff often ignore procedures. (A14R) |
Database |
81% |
73% |
80% |
73% |
Your Nursing Home |
81% |
73% |
80% |
73% |
||
8. |
Teamwork |
|
|
|
|
|
1. |
Staff in this nursing home treat each other with respect. (A1) |
Database |
88% |
84% |
89% |
83% |
Your Nursing Home |
88% |
84% |
89% |
83% |
||
2. |
Staff support one another in this nursing home. (A2) |
Database |
87% |
85% |
90% |
85% |
Your Nursing Home |
87% |
85% |
90% |
85% |
||
3. |
Staff feel like they are part of a team. (A5) |
Database |
81% |
73% |
80% |
73% |
Your Nursing Home |
81% |
73% |
80% |
73% |
||
4. |
When someone gets really busy in this nursing home, other staff help out. (A9) |
Database |
67% |
69% |
78% |
65% |
Your Nursing Home |
67% |
69% |
78% |
65% |
||
9. |
Handoffs |
|
|
|
|
|
1. |
Staff are told what they need to know before taking care of a resident for the first time. (B1) |
Database |
87% |
85% |
90% |
85% |
Your Nursing Home |
87% |
85% |
90% |
85% |
||
2. |
Staff are told right away when there is a change in a resident's care plan. (B2) |
Database |
81% |
73% |
80% |
73% |
Your Nursing Home |
81% |
73% |
80% |
73% |
||
3. |
We have all the information we need when residents are transferred from the hospital. (B3) |
Database |
67% |
69% |
78% |
65% |
Your Nursing Home |
67% |
69% |
78% |
65% |
||
4. |
Staff are given all the information they need to care for residents. (B10) |
Database |
67% |
69% |
78% |
65% |
Your Nursing Home |
67% |
69% |
78% |
65% |
||
Notes: 1) Respondents who selected "Other," and missing are not shown. 2) Comparative results are based on data from xx nursing homes included in the Nursing Home Survey on Patient Safety Culture 2011 Comparative Database Report; 3) “R” = a negatively worded item; 4) Data are not only displayed for work areas where there are fewer than 5 respondents and item data are not displayed for fewer than 3 respondents. |
Item-level Comparative Results by Work Area (Page 4 of 4)
|
|
Work Area |
||||
Survey Items by Composite |
Dataset |
Alzheimer’s/ Dementia Unit |
Many/ No specific area or unit |
Rehab Unit |
Skilled Nursing Unit |
|
|
# Respondents |
Database |
1,184 |
11,928 |
15,340 |
19,085 |
|
Your Nursing Home |
2,565 |
10,545 |
13,041 |
16,851 |
|
10. |
Communication Openness |
|
|
|
|
|
1. |
Staff ideas and suggestions are valued in this nursing home. (B7) |
Database |
88% |
84% |
89% |
83% |
Your Nursing Home |
88% |
84% |
89% |
83% |
||
2. |
Staff opinions are ignored in this nursing home. (B9R) |
Database |
87% |
85% |
90% |
85% |
Your Nursing Home |
87% |
85% |
90% |
85% |
||
3. |
It is easy for staff to speak up about problems in this nursing home. (B11) |
Database |
81% |
73% |
80% |
73% |
Your Nursing Home |
81% |
73% |
80% |
73% |
||
11. |
Nonpunitive Response to Mistakes |
|
|
|
|
|
1. |
Staff are blamed when a resident is harmed. (A10R) |
Database |
88% |
84% |
89% |
83% |
Your Nursing Home |
88% |
84% |
89% |
83% |
||
2. |
Staff are afraid to report their mistakes. (A12R) |
Database |
87% |
85% |
90% |
85% |
Your Nursing Home |
87% |
85% |
90% |
85% |
||
3. |
Staff are treated fairly when they make mistakes. (A15) |
Database |
81% |
73% |
80% |
73% |
Your Nursing Home |
81% |
73% |
80% |
73% |
||
4. |
Staff feel safe reporting their mistakes. (A18) |
Database |
67% |
69% |
78% |
65% |
Your Nursing Home |
67% |
69% |
78% |
65% |
||
12. |
Staffing |
|
|
|
|
|
1. |
We have enough staff to handle the workload. (A3) |
Database |
87% |
85% |
90% |
85% |
Your Nursing Home |
87% |
85% |
90% |
85% |
||
2. |
Staff have to hurry because they have too much work to do. (A8R) |
Database |
81% |
73% |
80% |
73% |
Your Nursing Home |
81% |
73% |
80% |
73% |
||
3. |
Residents' needs are met during shft changes. (A16) |
Database |
67% |
69% |
78% |
65% |
Your Nursing Home |
67% |
69% |
78% |
65% |
||
4. |
It is hard to keep residents safe here because so many staff quit their jobs. (A17) |
Database |
67% |
69% |
78% |
65% |
Your Nursing Home |
67% |
69% |
78% |
65% |
||
Notes: 1) Respondents who selected "Other," and missing are not shown. 2) Comparative results are based on data from xx nursing homes included in the Nursing Home Survey on Patient Safety Culture 2011 Comparative Database Report; 3) “R” = a negatively worded item; 4) Data are not only displayed for work areas where there are fewer than 5 respondents and item data are not displayed for fewer than 3 respondents. |
Willingness to Recommend Nursing Home Comparative Results by Work Area
-
Work Area
Willingness to Recommend Nursing Home
Dataset
Alzheimer’s/
Dementia Unit
Many/
No specific
area or unit
Rehab Unit
Skilled Nursing Unit
# Respondents
Database
61
348
289
343
Your Nursing Home
2,565
10,545
13,041
16,851
Yes
Database
60%
60%
60%
60%
Your Nursing Home
60%
60%
60%
60%
Maybe
Database
25%
25%
25%
25%
Your Nursing Home
25%
25%
25%
25%
No
Database
15%
15%
15%
15%
Your Nursing Home
15%
15%
15%
15%
Notes: 1) Percent totals in the table may not sum to exactly 100% due to rounding of decimals; 2) Respondents who selected "Other," and missing are not shown; 3) Comparative results are based on data from xx nursing homes included in the Nursing Home Survey on Patient Safety Culture 2011 Comparative Database Report; 4) Data are not only displayed for work areas where there are fewer than 5 respondents and item data are not displayed for fewer than 3 respondents.
Overall Rating on Resident Safety Comparative Results by Work Area
-
Work Area
Overall Rating on Resident Safety
Dataset
Alzheimer’s/
Dementia Unit
Many/
No specific
area or unit
Rehab Unit
Skilled Nursing Unit
# Respondents
Database
61
348
289
343
Your Nursing Home
2,565
10,545
13,041
16,851
5 – Excellent
Database
15%
15%
15%
15%
Your Nursing Home
15%
15%
15%
15%
4 – Very Good
Database
35%
35%
35%
35%
Your Nursing Home
35%
35%
35%
35%
3 – Good
Database
25%
25%
25%
25%
Your Nursing Home
25%
25%
25%
25%
2 – Fair
Database
15%
15%
15%
15%
Your Nursing Home
15%
15%
15%
15%
1 – Poor
Database
10%
10%
10%
10%
Your Nursing Home
10%
10%
10%
10%
Notes: 1) Percent totals in the table may not sum to exactly 100% due to rounding of decimals; 2) Respondents who selected "Other," and missing are not shown; 3) Comparative results are based on data from xx nursing homes included in the Nursing Home Survey on Patient Safety Culture 2011 Comparative Database Report; 4) Data are not only displayed for work areas where there are fewer than 5 respondents and item data are not displayed for fewer than 3 respondents.
Comparative Results by Interaction with Patients
Composite-level Comparative Results by Interaction with Patients
|
|
Interaction with Patients |
|
Patient Safety Culture Composites |
Dataset |
Yes |
No |
# Respondents |
Database |
61 |
343 |
Your Nursing Home |
2,565 |
16,851 |
|
1. Overall Perceptions of Resident Safety |
Database |
81% |
76% |
Your Nursing Home |
81% |
76% |
|
2. Feedback and Communication About Incidents |
Database |
75% |
72% |
Your Nursing Home |
75% |
72% |
|
3. Supervisor Expectations & Actions Promoting Resident Safety |
Database |
75% |
72% |
Your Nursing Home |
75% |
72% |
|
4. Organizational Learning |
Database |
75% |
72% |
Your Nursing Home |
75% |
72% |
|
5. Management Support for Resident Safety |
Database |
75% |
72% |
Your Nursing Home |
75% |
72% |
|
6. Training & Skills |
Database |
73% |
74% |
Your Nursing Home |
73% |
74% |
|
7. Compliance with Procedures |
Database |
73% |
74% |
Your Nursing Home |
73% |
74% |
|
8. Teamwork |
Database |
69% |
69% |
Your Nursing Home |
69% |
69% |
|
9. Handoffs |
Database |
69% |
69% |
Your Nursing Home |
69% |
69% |
|
10. Communication Openness |
Database |
73% |
74% |
Your Nursing Home |
73% |
74% |
|
11. Nonpunitive Response to Mistakes |
Database |
66% |
66% |
Your Nursing Home |
66% |
66% |
|
12. Staffing |
Database |
65% |
64% |
Your Nursing Home |
65% |
64% |
|
Notes: 1) Comparative results are based on data from xx nursing homes included in the Nursing Home Survey on Patient Safety Culture 2011 Comparative Database Report. 2) Composite scores are not calculated when a percentage for interaction has fewer than 5 respondents and any item in the composite has fewer than 3 respondents.
Item-level Comparative Results by Interaction with Patients (Page 1 of 4)
|
|
Interaction with Patients |
||
Survey Items by Composite |
Dataset |
Yes |
No |
|
|
# Respondents |
Database |
1,184 |
19,085 |
|
|
Your Nursing Home |
2,565 |
16,851 |
1. |
Overall Perceptions of Resident Safety |
|
|
|
1. |
Residents are well cared for in this nursing home. (D1) |
Database |
88% |
83% |
Your Nursing Home |
88% |
83% |
||
2. |
This nursing home does a good job keeping residents safe. (D6) |
Database |
87% |
85% |
Your Nursing Home |
87% |
85% |
||
3. |
3. This nursing home is a safe place for residents. (D8) |
Database |
81% |
73% |
Your Nursing Home |
81% |
73% |
||
2. |
Feedback and Communication About Incidents |
|
|
|
1. |
When staff report something that could harm a resident, someone takes care of it. (B4) |
Database |
88% |
83% |
Your Nursing Home |
88% |
83% |
||
2. |
In this nursing home, we talk about ways to keep incidents from happening again. (B5) |
Database |
87% |
85% |
Your Nursing Home |
87% |
85% |
||
3. |
Staff tell someone if they see something that might harm a resident. (B6) |
Database |
81% |
73% |
Your Nursing Home |
81% |
73% |
||
4. |
In this nursing home, we discuss ways to keep residents safe from harm. (B8) |
Database |
67% |
65% |
Your Nursing Home |
67% |
65% |
||
3. |
Supervisor Expectations & Actions Promoting Resident Safety |
|
|
|
1. |
My supervisor listens to staff ideas and suggestions about resident safety. (C1) |
Database |
87% |
85% |
Your Nursing Home |
87% |
85% |
||
2. |
My supervisor says a good word to staff who follow the right procedures. (C2) |
Database |
81% |
73% |
Your Nursing Home |
81% |
73% |
||
3. |
My supervisor pays attention to safety problems in this nursing home. (C3) |
Database |
67% |
65% |
Your Nursing Home |
67% |
65% |
||
Notes: 1) Comparative results are based on data from xx nursing homes included in the Nursing Home Survey on Patient Safety Culture 2011 Comparative Database Report; 2) Data are not only displayed for interaction where there are fewer than 5 respondents and item data are not displayed for fewer than 3 respondents. |
Item-level Comparative Results by Interaction with Patients (Page 2 of 4)
|
|
Interaction with Patients |
||
Survey Items by Composite |
Dataset |
Yes |
No |
|
|
# Respondents |
Database |
1,184 |
19,085 |
|
|
Your Nursing Home |
2,565 |
16,851 |
4. |
Organizational Learning |
|
|
|
1. |
This nursing home lets the same mistakes happen again and again. (D3R) |
Database |
88% |
83% |
Your Nursing Home |
88% |
83% |
||
2. |
It is easy to make changes to improve resident safety in this nursing home. (D4) |
Database |
87% |
85% |
Your Nursing Home |
87% |
85% |
||
3. |
This nursing home is always doing things to improve resident safety. (D5) |
Database |
81% |
73% |
Your Nursing Home |
81% |
73% |
||
4. |
When this nursing home makes changes to improve resident safety, it checks to see if the changes worked. (D10) |
Database |
81% |
73% |
Your Nursing Home |
81% |
73% |
||
5. |
Management Support for Resident Safety |
|
|
|
1. |
When staff report something that could harm a resident, someone takes care of it. (B4) |
Database |
88% |
83% |
Your Nursing Home |
88% |
83% |
||
2. |
In this nursing home, we talk about ways to keep incidents from happening again. (B5) |
Database |
87% |
85% |
Your Nursing Home |
87% |
85% |
||
3. |
Staff tell someone if they see something that might harm a resident. (B6) |
Database |
81% |
73% |
Your Nursing Home |
81% |
73% |
||
6. |
Training & Skills |
|
|
|
1. |
Staff get the training they need in this nursing home. (A7) |
Database |
87% |
85% |
Your Nursing Home |
87% |
85% |
||
2. |
Staff have enough training on how to handle difficult residents. (A11) |
Database |
81% |
73% |
Your Nursing Home |
81% |
73% |
||
3. |
Staff understand the training they get in this nursing home. (A13) |
Database |
67% |
65% |
Your Nursing Home |
67% |
65% |
||
Notes: 1) Comparative results are based on data from xx nursing homes included in the Nursing Home Survey on Patient Safety Culture 2011 Comparative Database Report; 2) Data are not only displayed for interaction where there are fewer than 5 respondents and item data are not displayed for fewer than 3 respondents. |
Item-level Comparative Results by Interaction with Patients (Page 3 of 4)
|
|
Interaction with Patients |
||
Survey Items by Composite |
Dataset |
Yes |
No |
|
|
# Respondents |
Database |
1,184 |
19,085 |
|
|
Your Nursing Home |
2,565 |
16,851 |
7. |
Compliance with Procedures |
|
|
|
1. |
Staff follow standard procedures to care for residents. (A4) |
Database |
88% |
83% |
Your Nursing Home |
88% |
83% |
||
2. |
Staff use shortcuts to get their work done faster. (A6R) |
Database |
87% |
85% |
Your Nursing Home |
87% |
85% |
||
3. |
To make work easier, staff often ignore procedures. (A14R) |
Database |
81% |
73% |
Your Nursing Home |
81% |
73% |
||
8. |
Teamwork |
|
|
|
1. |
Staff in this nursing home treat each other with respect. (A1) |
Database |
88% |
83% |
Your Nursing Home |
88% |
83% |
||
2. |
Staff support one another in this nursing home. (A2) |
Database |
87% |
85% |
Your Nursing Home |
87% |
85% |
||
3. |
Staff feel like they are part of a team. (A5) |
Database |
81% |
73% |
Your Nursing Home |
81% |
73% |
||
4. |
When someone gets really busy in this nursing home, other staff help out. (A9) |
Database |
67% |
65% |
Your Nursing Home |
67% |
65% |
||
9. |
Handoffs |
|
|
|
1. |
Staff are told what they need to know before taking care of a resident for the first time. (B1) |
Database |
87% |
85% |
Your Nursing Home |
87% |
85% |
||
2. |
Staff are told right away when there is a change in a resident's care plan. (B2) |
Database |
81% |
73% |
Your Nursing Home |
81% |
73% |
||
3. |
We have all the information we need when residents are transferred from the hospital. (B3) |
Database |
67% |
65% |
Your Nursing Home |
67% |
65% |
||
4. |
Staff are given all the information they need to care for residents. (B10) |
Database |
67% |
65% |
Your Nursing Home |
67% |
65% |
||
Notes: 1) Comparative results are based on data from xx nursing homes included in the Nursing Home Survey on Patient Safety Culture 2011 Comparative Database Report; 2) Data are not only displayed for interaction where there are fewer than 5 respondents and item data are not displayed for fewer than 3 respondents. |
Item-level Comparative Results by Interaction with Patients (Page 4 of 4)
|
|
Interaction with Patients |
||
Survey Items by Composite |
Dataset |
Yes |
No |
|
|
# Respondents |
Database |
1,184 |
19,085 |
|
|
Your Nursing Home |
2,565 |
16,851 |
10. |
Communication Openness |
|
|
|
1. |
Staff ideas and suggestions are valued in this nursing home. (B7) |
Database |
88% |
83% |
Your Nursing Home |
88% |
83% |
||
2. |
Staff opinions are ignored in this nursing home. (B9R) |
Database |
87% |
85% |
Your Nursing Home |
87% |
85% |
||
3. |
It is easy for staff to speak up about problems in this nursing home. (B11) |
Database |
81% |
73% |
Your Nursing Home |
81% |
73% |
||
11. |
Nonpunitive Response to Mistakes |
|
|
|
1. |
Staff are blamed when a resident is harmed. (A10R) |
Database |
88% |
83% |
Your Nursing Home |
88% |
83% |
||
2. |
Staff are afraid to report their mistakes. (A12R) |
Database |
87% |
85% |
Your Nursing Home |
87% |
85% |
||
3. |
Staff are treated fairly when they make mistakes. (A15) |
Database |
81% |
73% |
Your Nursing Home |
81% |
73% |
||
4. |
Staff feel safe reporting their mistakes. (A18) |
Database |
67% |
65% |
Your Nursing Home |
67% |
65% |
||
12. |
Staffing |
|
|
|
1. |
We have enough staff to handle the workload. (A3) |
Database |
87% |
85% |
Your Nursing Home |
87% |
85% |
||
2. |
Staff have to hurry because they have too much work to do. (A8R) |
Database |
81% |
73% |
Your Nursing Home |
81% |
73% |
||
3. |
Residents' needs are met during shft changes. (A16) |
Database |
67% |
65% |
Your Nursing Home |
67% |
65% |
||
4. |
It is hard to keep residents safe here because so many staff quit their jobs. (A17) |
Database |
67% |
65% |
Your Nursing Home |
67% |
65% |
||
Notes: 1) Comparative results are based on data from xx nursing homes included in the Nursing Home Survey on Patient Safety Culture 2011 Comparative Database Report; 2) Data are not only displayed for interaction where there are fewer than 5 respondents and item data are not displayed for fewer than 3 respondents. |
Willingness to Recommend Nursing Home Comparative Results by Interaction with Patients
-
Interaction with Patients
Willingness to Recommend Nursing Home
Dataset
Yes
No
# Respondents
Database
61
343
Your Nursing Home
2,565
16,851
Yes
Database
60%
60%
Your Nursing Home
60%
60%
Maybe
Database
25%
25%
Your Nursing Home
25%
25%
No
Database
15%
15%
Your Nursing Home
15%
15%
Notes: 1) Percent totals in the table may not sum to exactly 100% due to rounding of decimals; 2) Comparative results are based on data from xx nursing homes included in the Nursing Home Survey on Patient Safety Culture 2011 Comparative Database Report; 3) Data are not only displayed for interaction where there are fewer than 5 respondents and item data are not displayed for fewer than 3 respondents.
Overall Rating on Resident Safety Comparative Results by Interaction with Patients
-
Interaction with Patients
Overall Rating on Resident Safety
Dataset
Yes
No
# Respondents
Database
61
343
Your Nursing Home
2,565
16,851
5 – Excellent
Database
15%
15%
Your Nursing Home
15%
15%
4 – Very Good
Database
35%
35%
Your Nursing Home
35%
35%
3 – Good
Database
25%
25%
Your Nursing Home
25%
25%
2 – Fair
Database
15%
15%
Your Nursing Home
15%
15%
1 – Poor
Database
10%
10%
Your Nursing Home
10%
10%
Notes: 1) Percent totals in the table may not sum to exactly 100% due to rounding of decimals; 2) Comparative results are based on data from xx nursing homes included in the Nursing Home Survey on Patient Safety Culture 2011 Comparative Database Report; 3) Data are not only displayed for interaction where there are fewer than 5 respondents and item data are not displayed for fewer than 3 respondents.
Comparative Results by Shift Worked Most Often
Composite-level Comparative Results by Shift Worked Most Often
|
|
Shift Worked Most Often |
|||
Patient Safety Culture Composites |
Dataset |
Days |
Evenings |
Nights |
|
# Respondents |
Database |
1,184 |
11,928 |
19,085 |
|
Your Nursing Home |
2,565 |
10,545 |
16,851 |
||
1. Overall Perceptions of Resident Safety |
Database |
81% |
78% |
76% |
|
Your Nursing Home |
81% |
78% |
76% |
||
2. Feedback and Communication About Incidents |
Database |
75% |
70% |
72% |
|
Your Nursing Home |
75% |
70% |
72% |
||
3. Supervisor Expectations & Actions Promoting Resident Safety |
Database |
75% |
70% |
72% |
|
Your Nursing Home |
75% |
70% |
72% |
||
4. Organizational Learning |
Database |
75% |
70% |
72% |
|
Your Nursing Home |
75% |
70% |
72% |
||
5. Management Support for Resident Safety |
Database |
75% |
70% |
72% |
|
Your Nursing Home |
75% |
70% |
72% |
||
6. Training & Skills |
Database |
73% |
67% |
74% |
|
Your Nursing Home |
73% |
67% |
74% |
||
7. Compliance with Procedures |
Database |
73% |
67% |
74% |
|
Your Nursing Home |
73% |
67% |
74% |
||
8. Teamwork |
Database |
69% |
64% |
69% |
|
Your Nursing Home |
69% |
64% |
69% |
||
9. Handoffs |
Database |
69% |
64% |
69% |
|
Your Nursing Home |
69% |
64% |
69% |
||
10. Communication Openness |
Database |
73% |
67% |
74% |
|
Your Nursing Home |
73% |
67% |
74% |
||
11. Nonpunitive Response to Mistakes |
Database |
66% |
56% |
66% |
|
Your Nursing Home |
66% |
56% |
66% |
||
12. Staffing |
Database |
65% |
58% |
64% |
|
Your Nursing Home |
65% |
58% |
64% |
||
Notes: 1) Respondents who selected "Other," and missing are not shown. 2) Comparative results are based on data from xx nursing homes included in the Nursing Home Survey on Patient Safety Culture 2011 Comparative Database Report; 3) Composite scores are not calculated when a work area has fewer than 5 respondents and any item in the composite has fewer than 3 respondents.
Item-level Comparative Results by Shift Worked Most Often (Page 1 of 4)
|
|
|
Shift Worked Most Often |
||||
Survey Items by Composite |
Dataset |
Days |
Evenings |
Nights |
|||
# Respondents |
Database |
1,184 |
11,928 |
19,085 |
|||
Your Nursing Home |
61 |
348 |
343 |
||||
1. |
Overall Perceptions of Resident Safety |
|
|
|
|
||
1. |
Residents are well cared for in this nursing home. (D1) |
Database |
88% |
84% |
83% |
||
Your Nursing Home |
88% |
84% |
83% |
||||
2. |
This nursing home does a good job keeping residents safe. (D6) |
Database |
87% |
85% |
85% |
||
Your Nursing Home |
87% |
85% |
85% |
||||
3. |
3. This nursing home is a safe place for residents. (D8) |
Database |
81% |
73% |
73% |
||
Your Nursing Home |
81% |
73% |
73% |
||||
2. |
Feedback and Communication About Incidents |
|
|
|
|
||
1. |
When staff report something that could harm a resident, someone takes care of it. (B4) |
Database |
88% |
84% |
83% |
||
Your Nursing Home |
88% |
84% |
83% |
||||
2. |
In this nursing home, we talk about ways to keep incidents from happening again. (B5) |
Database |
87% |
85% |
85% |
||
Your Nursing Home |
87% |
85% |
85% |
||||
3. |
Staff tell someone if they see something that might harm a resident. (B6) |
Database |
81% |
73% |
73% |
||
Your Nursing Home |
81% |
73% |
73% |
||||
4. |
In this nursing home, we discuss ways to keep residents safe from harm. (B8) |
Database |
67% |
69% |
65% |
||
Your Nursing Home |
67% |
69% |
65% |
||||
3. |
Supervisor Expectations & Actions Promoting Resident Safety |
|
|
|
|
||
1. |
My supervisor listens to staff ideas and suggestions about resident safety. (C1) |
Database |
87% |
85% |
85% |
||
Your Nursing Home |
87% |
85% |
85% |
||||
2. |
My supervisor says a good word to staff who follow the right procedures. (C2) |
Database |
81% |
73% |
73% |
||
Your Nursing Home |
81% |
73% |
73% |
||||
3. |
My supervisor pays attention to safety problems in this nursing home. (C3) |
Database |
67% |
69% |
65% |
||
Your Nursing Home |
67% |
69% |
65% |
||||
Notes: 1) Respondents who selected "Other," and missing are not shown. 2) Comparative results are based on data from xx nursing homes included in the Nursing Home Survey on Patient Safety Culture 2011 Comparative Database Report; 3) “R” = a negatively worded item; 4) Data are not only displayed for job titles where there are fewer than 5 respondents and item data are not displayed for fewer than 3 respondents. |
Item-level Comparative Results by Shift Worked Most Often (Page 2 of 4)
|
|
Shift Worked Most Often |
|||
Survey Items by Composite |
Dataset |
Days |
Evenings |
Nights |
|
# Respondents |
Database |
1,184 |
11,928 |
19,085 |
|
Your Nursing Home |
2,565 |
10,545 |
16,851 |
||
4. |
Organizational Learning |
|
|
|
|
1. |
This nursing home lets the same mistakes happen again and again. (D3R) |
Database |
88% |
84% |
83% |
Your Nursing Home |
88% |
84% |
83% |
||
2. |
It is easy to make changes to improve resident safety in this nursing home. (D4) |
Database |
87% |
85% |
85% |
Your Nursing Home |
87% |
85% |
85% |
||
3. |
This nursing home is always doing things to improve resident safety. (D5) |
Database |
81% |
73% |
73% |
Your Nursing Home |
81% |
73% |
73% |
||
4. |
When this nursing home makes changes to improve resident safety, it checks to see if the changes worked. (D10) |
Database |
81% |
73% |
73% |
Your Nursing Home |
81% |
73% |
73% |
||
5. |
Management Support for Resident Safety |
|
|
|
|
1. |
When staff report something that could harm a resident, someone takes care of it. (B4) |
Database |
88% |
84% |
83% |
Your Nursing Home |
88% |
84% |
83% |
||
2. |
In this nursing home, we talk about ways to keep incidents from happening again. (B5) |
Database |
87% |
85% |
85% |
Your Nursing Home |
87% |
85% |
85% |
||
3. |
Staff tell someone if they see something that might harm a resident. (B6) |
Database |
81% |
73% |
73% |
Your Nursing Home |
81% |
73% |
73% |
||
6. |
Training & Skills |
|
|
|
|
1. |
Staff get the training they need in this nursing home. (A7) |
Database |
87% |
85% |
85% |
Your Nursing Home |
87% |
85% |
85% |
||
2. |
Staff have enough training on how to handle difficult residents. (A11) |
Database |
81% |
73% |
73% |
Your Nursing Home |
81% |
73% |
73% |
||
3. |
Staff understand the training they get in this nursing home. (A13) |
Database |
67% |
69% |
65% |
Your Nursing Home |
67% |
69% |
65% |
||
Notes: 1) Respondents who selected "Other," and missing are not shown. 2) Comparative results are based on data from xx nursing homes included in the Nursing Home Survey on Patient Safety Culture 2011 Comparative Database Report; 3) “R” = a negatively worded item; 4) Data are not only displayed for job titles where there are fewer than 5 respondents and item data are not displayed for fewer than 3 respondents. |
Item-level Comparative Results by Shift Worked Most Often (Page 3 of 4)
|
|
|
Shift Worked Most Often |
||
Survey Items by Composite |
Dataset |
Days |
Evenings |
Nights |
|
# Respondents |
Database |
1,184 |
11,928 |
19,085 |
|
Your Nursing Home |
2,565 |
10,545 |
16,851 |
||
7. |
Compliance with Procedures |
|
|
|
|
1. |
Staff follow standard procedures to care for residents. (A4) |
Database |
88% |
84% |
83% |
Your Nursing Home |
88% |
84% |
83% |
||
2. |
Staff use shortcuts to get their work done faster. (A6R) |
Database |
87% |
85% |
85% |
Your Nursing Home |
87% |
85% |
85% |
||
3. |
To make work easier, staff often ignore procedures. (A14R) |
Database |
81% |
73% |
73% |
Your Nursing Home |
81% |
73% |
73% |
||
8. |
Teamwork |
|
|
|
|
1. |
Staff in this nursing home treat each other with respect. (A1) |
Database |
88% |
84% |
83% |
Your Nursing Home |
88% |
84% |
83% |
||
2. |
Staff support one another in this nursing home. (A2) |
Database |
87% |
85% |
85% |
Your Nursing Home |
87% |
85% |
85% |
||
3. |
Staff feel like they are part of a team. (A5) |
Database |
81% |
73% |
73% |
Your Nursing Home |
81% |
73% |
73% |
||
4. |
When someone gets really busy in this nursing home, other staff help out. (A9) |
Database |
67% |
69% |
65% |
Your Nursing Home |
67% |
69% |
65% |
||
9. |
Handoffs |
|
|
|
|
1. |
Staff are told what they need to know before taking care of a resident for the first time. (B1) |
Database |
87% |
85% |
85% |
Your Nursing Home |
87% |
85% |
85% |
||
2. |
Staff are told right away when there is a change in a resident's care plan. (B2) |
Database |
81% |
73% |
73% |
Your Nursing Home |
81% |
73% |
73% |
||
3. |
We have all the information we need when residents are transferred from the hospital. (B3) |
Database |
67% |
69% |
65% |
Your Nursing Home |
67% |
69% |
65% |
||
4. |
Staff are given all the information they need to care for residents. (B10) |
Database |
67% |
69% |
65% |
Your Nursing Home |
67% |
69% |
65% |
||
Item-level Comparative Results by Shift Worked Most Often (Page 4 of 4)
|
|
|
Shift Worked Most Often |
||
Survey Items by Composite |
Dataset |
Days |
Evenings |
Nights |
|
|
# Respondents |
Database |
1,184 |
11,928 |
19,085 |
|
Your Nursing Home |
2,565 |
10,545 |
16,851 |
|
10. |
Communication Openness |
|
|
|
|
1. |
Staff ideas and suggestions are valued in this nursing home. (B7) |
Database |
88% |
84% |
83% |
Your Nursing Home |
88% |
84% |
83% |
||
2. |
Staff opinions are ignored in this nursing home. (B9R) |
Database |
87% |
85% |
85% |
Your Nursing Home |
87% |
85% |
85% |
||
3. |
It is easy for staff to speak up about problems in this nursing home. (B11) |
Database |
81% |
73% |
73% |
Your Nursing Home |
81% |
73% |
73% |
||
11. |
Nonpunitive Response to Mistakes |
|
|
|
|
1. |
Staff are blamed when a resident is harmed. (A10R) |
Database |
88% |
84% |
83% |
Your Nursing Home |
88% |
84% |
83% |
||
2. |
Staff are afraid to report their mistakes. (A12R) |
Database |
87% |
85% |
85% |
Your Nursing Home |
87% |
85% |
85% |
||
3. |
Staff are treated fairly when they make mistakes. (A15) |
Database |
81% |
73% |
73% |
Your Nursing Home |
81% |
73% |
73% |
||
4. |
Staff feel safe reporting their mistakes. (A18) |
Database |
67% |
69% |
65% |
Your Nursing Home |
67% |
69% |
65% |
||
12. |
Staffing |
|
|
|
|
1. |
We have enough staff to handle the workload. (A3) |
Database |
87% |
85% |
85% |
Your Nursing Home |
87% |
85% |
85% |
||
2. |
Staff have to hurry because they have too much work to do. (A8R) |
Database |
81% |
73% |
73% |
Your Nursing Home |
81% |
73% |
73% |
||
3. |
Residents' needs are met during shft changes. (A16) |
Database |
67% |
69% |
65% |
Your Nursing Home |
67% |
69% |
65% |
||
4. |
It is hard to keep residents safe here because so many staff quit their jobs. (A17) |
Database |
67% |
69% |
65% |
Your Nursing Home |
67% |
69% |
65% |
||
Notes: 1) Respondents who selected "Other," and missing are not shown. 2) Comparative results are based on data from xx nursing homes included in the Nursing Home Survey on Patient Safety Culture 2011 Comparative Database Report; 3) “R” = a negatively worded item; 4) Data are not only displayed for job titles where there are fewer than 5 respondents and item data are not displayed for fewer than 3 respondents. |
Willingness to Recommend Nursing Home Comparative Results by Shift Worked Most Often
-
Shift Worked Most Often
Willingness to Recommend Nursing Home
Dataset
Days
Evenings
Nights
# Respondents
Database
61
348
343
Your Nursing Home
2,565
10,545
16,851
Yes
Database
60%
60%
60%
Your Nursing Home
60%
60%
60%
Maybe
Database
25%
25%
25%
Your Nursing Home
25%
25%
25%
No
Database
15%
15%
15%
Your Nursing Home
15%
15%
15%
Notes: 1) Percent totals in the table may not sum to exactly 100% due to rounding of decimals; 2) Comparative results are based on data from xx nursing homes included in the Nursing Home Survey on Patient Safety Culture 2011 Comparative Database Report; 3) Data are not only displayed for shifts where there are fewer than 5 respondents and item data are not displayed for fewer than 3 respondents.
Overall Rating on Resident Safety Comparative Results by Shift Worked Most Often
-
Shift Worked Most Often
Overall Rating on Resident Safety
Dataset
Days
Evenings
Nights
# Respondents
Database
61
348
343
Your Nursing Home
2,565
10,545
16,851
5 – Excellent
Database
15%
15%
15%
Your Nursing Home
15%
15%
15%
4 – Very Good
Database
35%
35%
35%
Your Nursing Home
35%
35%
35%
3 – Good
Database
25%
25%
25%
Your Nursing Home
25%
25%
25%
2 – Fair
Database
15%
15%
15%
Your Nursing Home
15%
15%
15%
1 – Poor
Database
10%
10%
10%
Your Nursing Home
10%
10%
10%
Notes: 1) Percent totals in the table may not sum to exactly 100% due to rounding of decimals; 2) Comparative results are based on data from xx nursing homes included in the Nursing Home Survey on Patient Safety Culture 2011 Comparative Database Report; 3) Data are not only displayed for shifts where there are fewer than 5 respondents and item data are not displayed for fewer than 3 respondents.
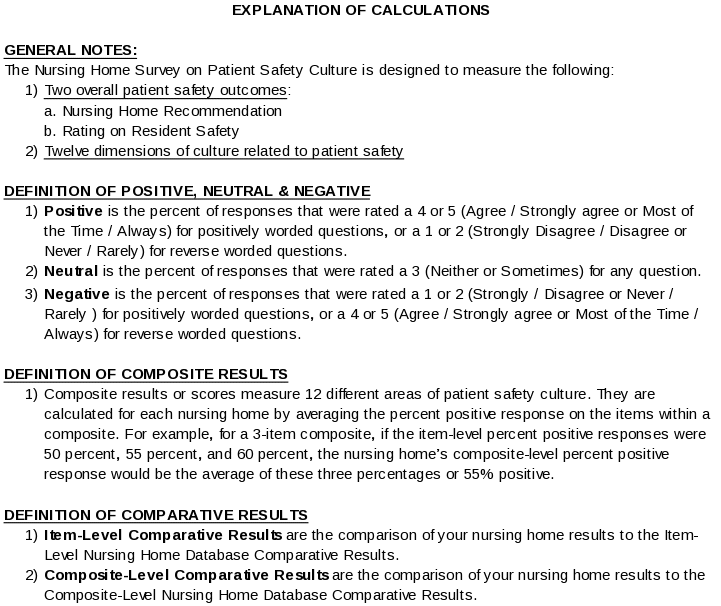
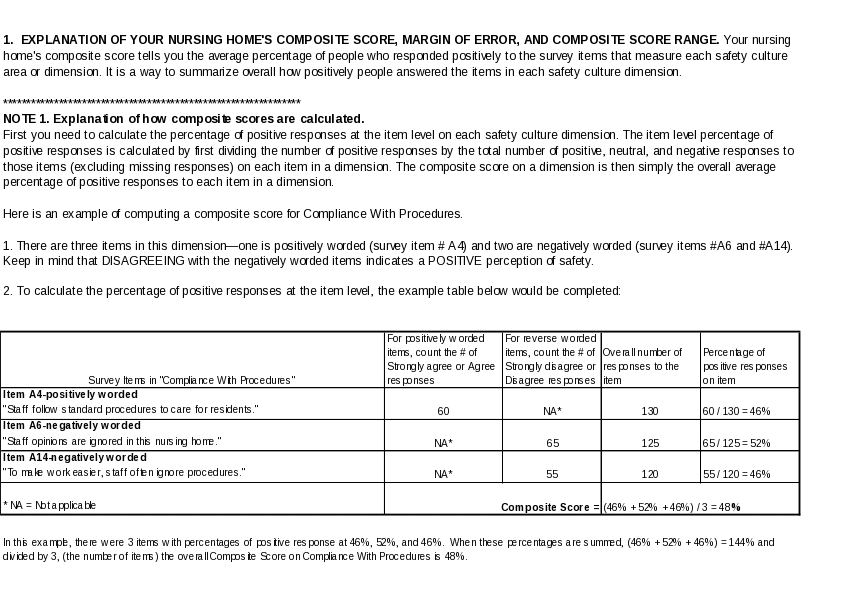
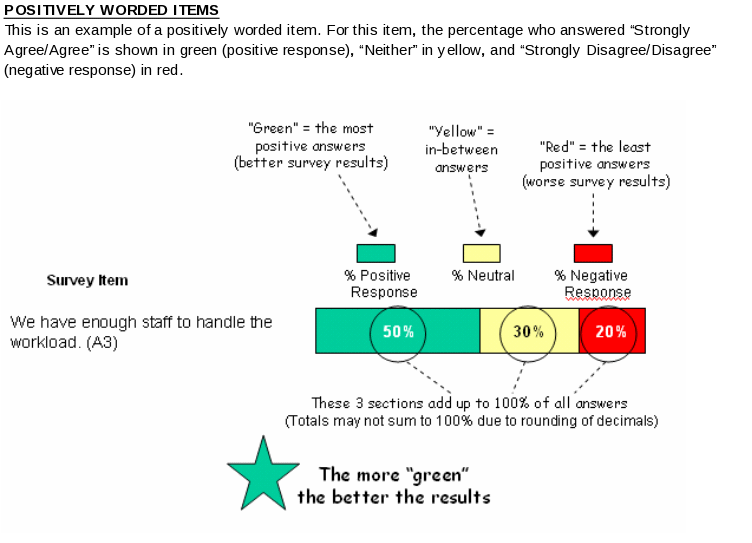
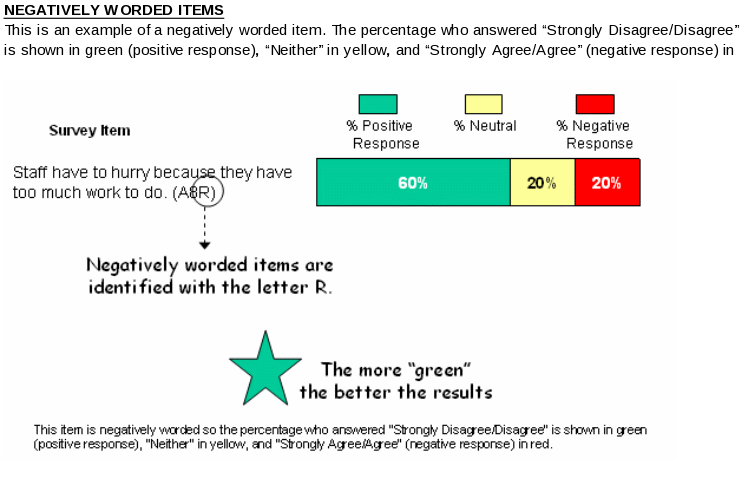
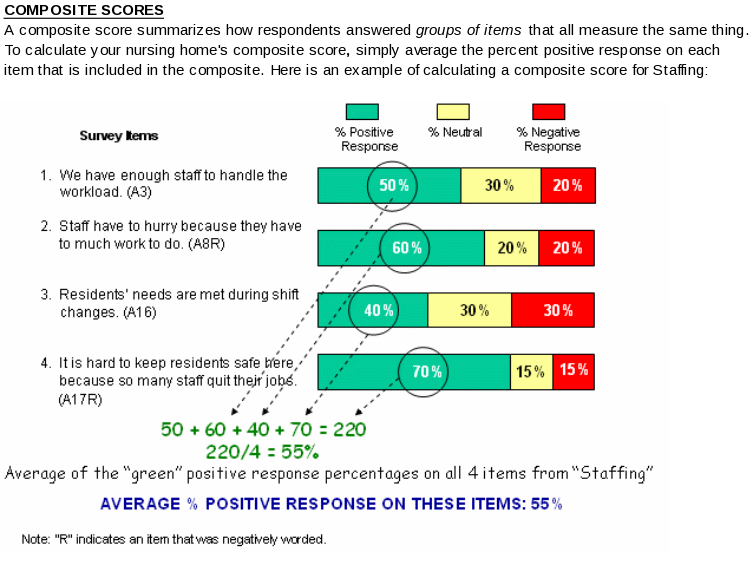
| File Type | application/vnd.openxmlformats-officedocument.wordprocessingml.document |
| Author | Naomi Dyer |
| File Modified | 0000-00-00 |
| File Created | 2021-01-31 |
© 2026 OMB.report | Privacy Policy