Fish and Aquatic Habitat Regional Survey
Willingness to Pay Survey for Section 316(b) Existing Facilities Cooling Water Intake Structures
2402.01 Regional Survey
Willingness to Pay Survey
OMB: 2040-0283
OMB
Control No. 2040-XXXX
Approval
expires XX/XX/XX


Fish and Aquatic Habitat
A Survey of Northeast Residents
(CT, DC, DE, MA, MD, ME, NH, NJ, NY, PA, RI, VT)
The
public reporting and recordkeeping burden for this collection of
information is estimated to average 30 minutes per response. Send
comments on the Agency's need for this information, the accuracy of
the provided burden estimates, and any suggested methods for
minimizing respondent burden, including through the use of automated
collection techniques to the Director, Collection Strategies
Division, U.S. Environmental Protection Agency (2822T), 1200
Pennsylvania Ave., NW, Washington, D.C. 20460. Include the OMB
control number in any correspondence. Do not send the completed
survey to this address.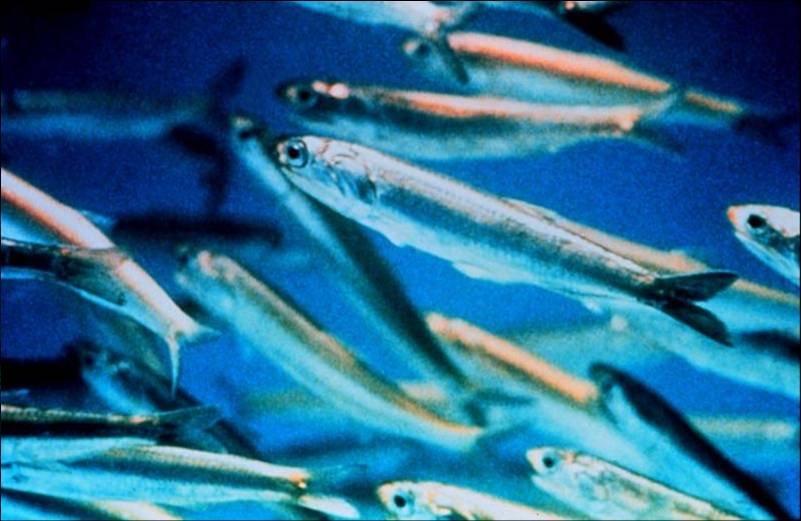
 Human
Activities, Aquatic Habitat and Fish
This survey asks for your opinions regarding policies that would affect fish and habitat in the Northeast U.S. Your answers will help the government decide which policies will be enacted. Background information in this survey was provided by the National Marine Fisheries Service, U.S. Environmental Protection Agency, U.S. Geological Survey and other state and federal offices.
Northeast fresh and salt waters support billions of fish. These include fish that are used by humans, as well as forage fish that are not used by humans, but serve as food for larger fish, birds, and animals.


This survey concerns proposed policies that would reduce fish losses caused by cooling water use by industrial facilities, including factories and power plants. These policies would benefit aquatic ecosystems but would increase the costs of some goods and services you buy, including electricity and common household products.
1
1
How Does Cooling Water Affect Fish?
 The
water that industrial facilities use to cool equipment is pumped from
bays, rivers, and lakes. The largest amount is used by power plants
that produce electricity.
The
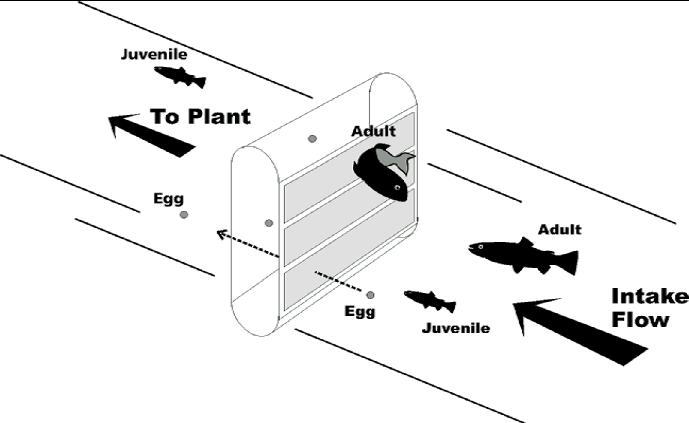
equipment that pumps the cooling water kills small fish and fish
eggs. Juvenile
fish and eggs move through screens and into the cooling system where
they are killed by high temperature. Large
fish may be injured or killed against screens or filters.
Pumping
warm water back into the environment (called thermal
discharge)
also affects ecological systems.
Cooling
Water Intake Screen


Cooling
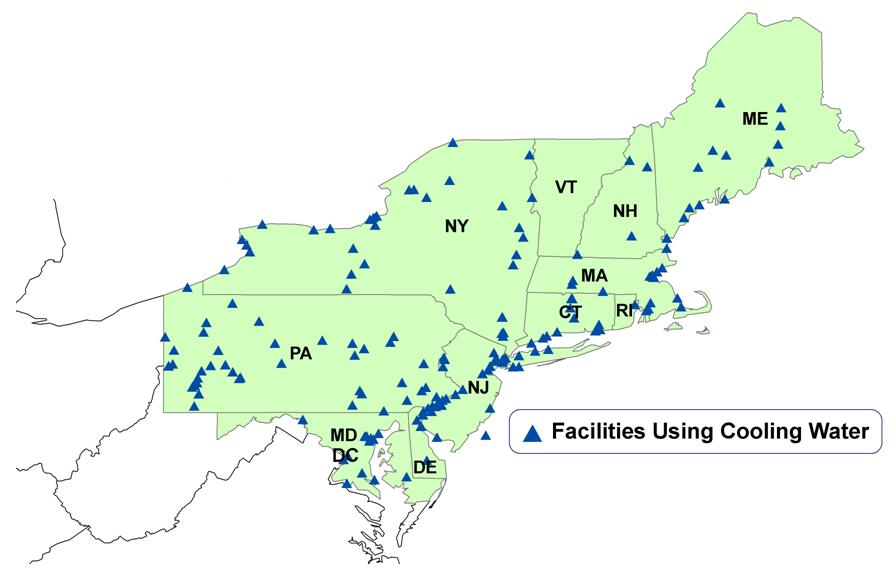
water use affects fresh and salt waters throughout the Northeast US,
but the majority of all fish losses are in salt waters such as
coastal bays.
How Fish Are Affected by Water Intake
2
what kinds of Fish are Affected?

Cooling water use is not the largest cause of fish loss in most areas (fishing causes greater losses), but has affected some fish populations.
About 1/6 of the fish lost are species caught by commercial and recreational fishermen. Examples include striped bass, flounder, and cod.
The other 5/6 of the fish lost are forage species not caught by humans but are part of the food web. Examples include killifish, silverside, and stickleback.
Question 1. When thinking about how industrial facilities use cooling water, please rate the importance of the following to you. Check one box for each.
|
Not Important |
|
Somewhat Important |
|
Very Important |
|||
|
|
|
|
|
|
|||
|
1 |
2 |
3 |
4 |
5 |
|||
|
1 |
2 |
3 |
4 |
5 |
|||
|
1 |
2 |
3 |
4 |
5 |
|||
|
1 |
2 |
3 |
4 |
5 |
|||
|
1 |
2 |
3 |
4 |
5 |
|||
|
1 |
2 |
3 |
4 |
5 |
|||
3
3
how many fish are affected?

After accounting for the number of eggs and larvae that would be expected to survive to adulthood, scientists estimate that the equivalent of about 1.1 billion young adult fish (the equivalent of one year old) are lost each year in Northeast coastal and fresh waters due to cooling water use.
Scientists can predict the number of these fish that will be saved under different policies. This number ranges from 0.3 to 1.0 billion fish saved per year.
For commercial fish species, losses of young fish in cooling water intakes vary by species, from the equivalent of less than 0.1% to about 10% of total populations.
Yearly effects on fish species are between these levels. For example, the number of young fish lost in cooling water intakes relative to the total number of fish in the water is relatively high for some species, but low for others.
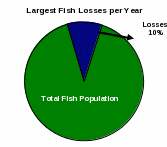
Although scientists can predict the number of fish saved each year, the effect on fish populations is uncertain. This is because scientists do not know the total number of all fish in Northeast waters and because many factors – such as cooling water use, fishing, pollution and water temperature – affect fish populations.
The
following page provides information on policies that would be
required to reduce these fish losses.
Smaller
effect
on Striped Bass
Larger
effect on Winter Flounder
4

Smaller
effect
on Striped Bass
Larger
effect on Winter Flounder
4
4

New Regulations are Being Proposed to protect fish

The
government is considering policies that would require new measures
to protect fish. One
policy would require advanced
filters
that block fish from entering cooling water facilities. Requiring
advanced filters could reduce fish losses about 25%.
Another
possibility is closed
cycle cooling
that recycles and reuses cooling water, so that less water is
needed. Requiring
closed cycle cooling could reduce fish losses by 95% and also
reduces thermal discharge.
However, costs are higher than for advanced filters.
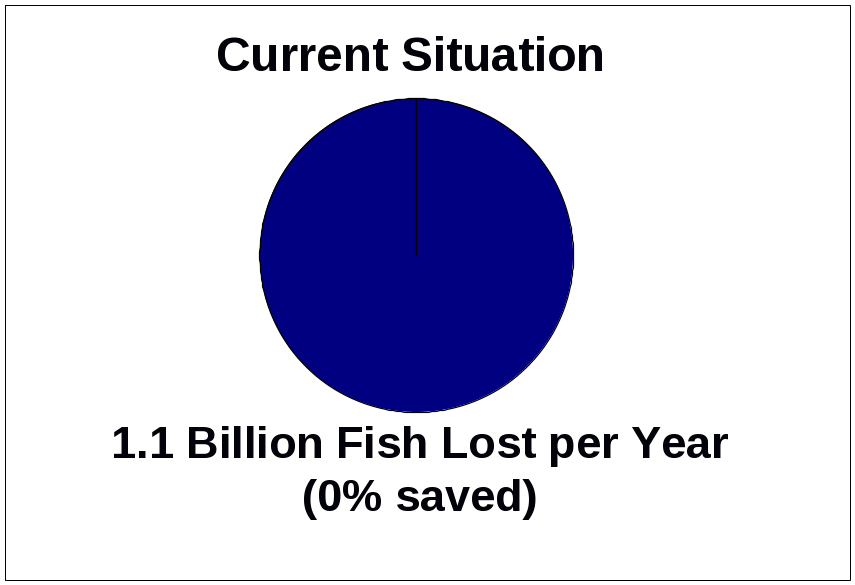
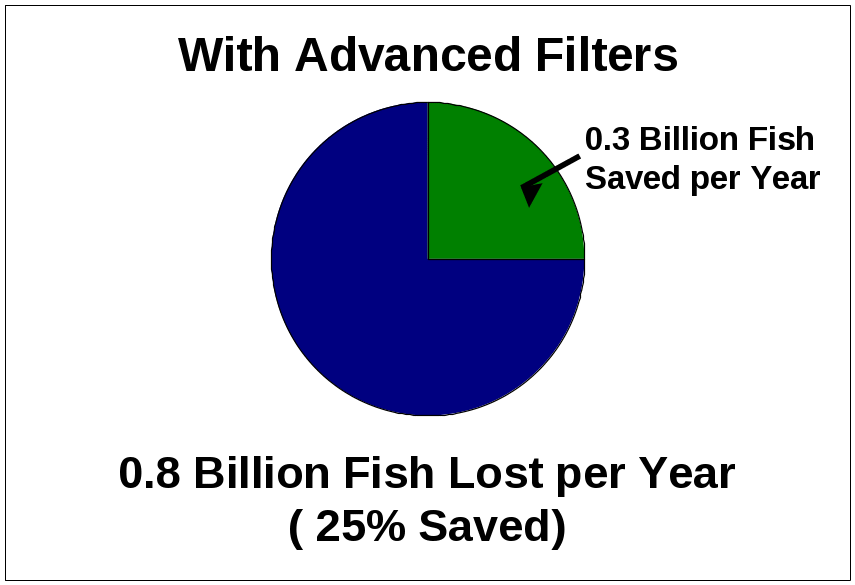
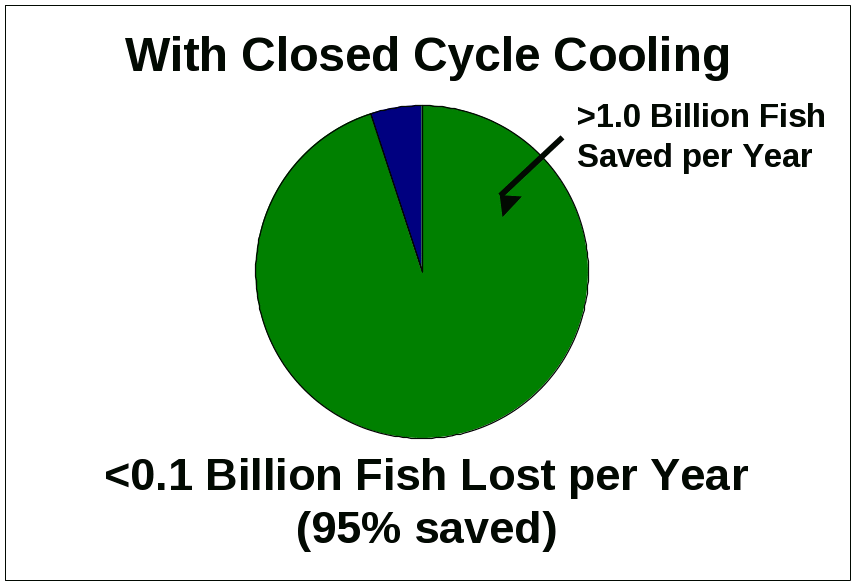
Advanced filters and closed cycle cooling are already in use at many facilities and are proven technologies. New regulations would require a mix of advanced filters and closed cycle cooling at all facilities—with reductions in fish losses between 25% and 95%.
5
 How
important are these issues to you?
While these policies would reduce fish losses, they would also increase the costs of producing many goods and services — these costs would be passed on to consumers like you.
Question 2. Compared to other issues that the government might address—such as public safety, education and health—how important is protecting aquatic ecosystems to you? Check one box.
|
Not Important |
|
Somewhat Important |
|
Very Important |
|||
|
|
|
|
|
|
|||
Protecting aquatic ecosystems is |
1 |
2 |
3 |
4 |
5 |
|||
The government needs to know whether households are willing to pay the costs of these new policies.
This survey will ask you to compare policies with different effects on cooling water use, fish, and costs to your household. You will be asked to vote for the options you prefer.
You will also have the opportunity to support the current situation, with no new policies, and no new costs to your household.
6
This survey is similar to a public vote

7
Effect of Policy |
|
What It Means |
Commercial Fish Populations (Fish Used by People) |
|
A score between 0 and 100 showing the overall health of commercial and recreational fish populations. Higher scores mean more fish and greater fishing potential. A score of 100 means that these fish populations are at a size that maximizes long-term harvest; 0 means no harvest. The current score in Northeast waters is 43. |
(All Fish) |
|
A score between 0 and 100 showing the estimated size of all fish populations compared to natural levels without human influence. A score of 100 means that populations are the largest natural size possible; 0 means no fish. The current score in Northeast waters is 31. |
Fish Saved (per Year) |
|
A score between 0 and 100 showing the reduction in young fish lost because of the new policy. A score of 100 means that no fish are lost in cooling water intakes (all fish are saved). The current score in Northeast waters is 0; this represents the status quo with no new policies. |
Condition of Aquatic Ecosystems |
|
A score between 0 to 100 showing the ecological condition of affected areas, compared to the most natural waters in the Northeast. The score is determined by many factors including water quality and temperature, the health of aquatic species, and habitat conditions. Higher scores mean the area is more natural. The current score in Northeast waters is 48. |
$ Cost per Year |
|
How much the policy will cost your household, in unavoidable price increases for products and services you buy, including electricity and common household products. |
 How
Would you rate tHE IMPoRTANCE OF TheSE EFFECTS?
Question 3. When considering policies that affect how facilities use cooling water, how important to you are effects on each of the following scores? Check one box for each. (For reminders of what the scores mean, please see page 7).
|
Not Important |
|
Somewhat Important |
|
Very Important |
|||
|
|
|
|
|
|
|||
|
1 |
2 |
3 |
4 |
5 |
|||
|
1 |
2 |
3 |
4 |
5 |
|||
|
1 |
2 |
3 |
4 |
5 |
|||
|
1 |
2 |
3 |
4 |
5 |
|||
|
1 |
2 |
3 |
4 |
5 |
|||
The next questions will ask you to choose between different policy options that would affect fish losses in cooling water systems. You will be given choices and asked to vote for the choice you prefer by checking the appropriate box. Questions will look similar to the sample on the next page.
8
SAMPLE
QUESTION
Questions
will look like the sample below.
Policy Effect |
|
Current
Situation |
Option A |
Option B |
Commercial Fish Populations (in 3-5 Years) |
|
43% (100% is populations that allow for maximum harvest) |
45% (100% is populations that allow for maximum harvest) |
47% (100% is populations that allow for maximum harvest) |
Fish Populations (all fish) (in 3-5 Years) |
|
31% (100% is populations without human influence) |
34% (100% is populations without human influence) |
38% (100% is populations without human influence) |
Fish Saved per Year (Out of 1.1 billion fish lost in water intakes) |
|
0% No change in status quo |
25% 0.3 billion fish saved |
50% 0.6 billion fish saved |
Condition of Aquatic Ecosystems (in 3-5 Years) |
|
48% (100% is pristine condition) |
48% (100% is pristine condition) |
50% (100% is pristine condition) |
$ Increase in Cost of Living for Your Household |
|
$0 No cost increase
|
$24 per year ($2 per month)
|
$36 per year ($3 per month)
|
HOW WOULD YOU VOTE? (CHOOSE ONE ONLY) |
|
X I would vote for NO POLICY |
X I would vote for OPTION A |
X I would vote for OPTION B |
If
you prefer Option
A, check
this box
If
you do not
want
A or B, check
this box
If
you prefer Option
B,
check
this box
If do not
want A or B, check this box.
9
As
you vote please remember
 The
map below shows the facilities and areas that would be affected by
the proposed policies.
The
map below shows the facilities and areas that would be affected by
the proposed policies.The policy options (A and B) given to you each require a different mix of advanced filters and closed cycle cooling in different areas, so effects on fish are different.
You will be shown different questions, with different combinations of technology and different costs
Depending on the policies chosen, costs to your household could range from $0 per month to a maximum of $6 per month.
Depending on the type of technology required and other factors, effects on fish and ecosystems may be different—even if the annual reduction in fish losses is similar.
Consider each pair of policy options separately—do not add them up or compare programs from different pages.
Scientists expect that effects on the environment and economy not shown explicitly will be small. For example, studies of industry suggest that effects on employment will be close to zero.
Y
 our
votes are important. Answer all questions as if this were a real,
binding vote.
10
 Question
4.
Assume
that Options A and B would require a different mix of filters and
closed cycle cooling in different areas. Assume all types of fish
are affected. How would you vote?
Policy Effect NE Waters |
|
Current
Situation |
Option A NE Waters |
Option B NE Waters |
Commercial Fish Populations (in 3-5 Years) |
|
43% (100% is populations that allow for maximum harvest) |
44% (100% is populations that allow for maximum harvest) |
45% (100% is populations that allow for maximum harvest) |
Fish Populations (all fish) (in 3-5 Years) |
|
31% 100% is populations without human influence) |
32% (100% is populations without human influence) |
35% (100% is populations without human influence) |
Fish Saved per Year (Out of 1.1 billion fish lost in water intakes) |
|
0% No change in status quo |
25% 0.3 billion fish saved |
50% 0.6 billion fish saved |
Condition of Aquatic Ecosystems (in 3-5 Years) |
|
48% (100% is pristine condition) |
49% (100% is pristine condition) |
50% (100% is pristine condition) |
$ Increase in Cost of Living for Your Household |
|
$0 No cost increase
|
$24 per year ($2 per month)
|
$36 per year ($3 per month)
|
HOW WOULD YOU VOTE? (CHOOSE ONE ONLY) |
|
I would vote for NO POLICY |
I would vote for OPTION A |
I would vote for OPTION B |
11
11
POLICIES COULD REQUIRE DIFFERENT COMBINATIONS OF TECHNOLOGY

Now
you will be asked to consider a new set of policy options for
Northeast waters. As you vote, please remember—
Questions 5 and 6 present new sets of policy options. These options require a different mix of technologies in different areas.
Each question is a separate vote. Questions 5 and 6 cannot be directly compared to each other, or to Question 4.
Do not add up effects or costs across different questions.
Policy costs and effects depend on many factors. Saving more fish does not necessarily mean that all effects will improve.
12
Question 5. Assume that Options A and B would require a different mix of filters and closed cycle cooling in different areas. Assume all types of fish are affected. How would you vote?

Policy Effect NE Waters |
|
Current
Situation |
Option A NE Waters |
Option B NE Waters |
Commercial Fish Populations (in 3-5 Years) |
|
43% (100% is populations that allow for maximum harvest) |
45% (100% is populations that allow for maximum harvest) |
47% (100% is populations that allow for maximum harvest) |
Fish Populations (all fish) (in 3-5 Years) |
|
31% (100% is populations without human influence) |
33% (100% is populations without human influence) |
36% (100% is populations without human influence) |
Fish Saved per Year (Out of 1.1 billion fish lost in water intakes) |
|
0% No change in status quo |
25% 0.3 billion fish saved |
75% 0.8 billion fish saved |
Condition of Aquatic Ecosystems (in 3-5 Years) |
|
48% (100% is pristine condition) |
48% (100% is pristine condition) |
52% (100% is pristine condition) |
$ Increase in Cost of Living for Your Household |
|
$0 No cost increase
|
$36 per year ($3 per month)
|
$60 per year ($5 per month)
|
HOW WOULD YOU VOTE? (CHOOSE ONE ONLY) |
|
I would vote for NO POLICY |
I would vote for OPTION A |
I would vote for OPTION B |
13
Question 6. Assume that Options A and B would require a different mix of filters and closed cycle cooling in different areas. Assume all types of fish are affected. How would you vote?

Policy Effect NE Waters |
|
Current
Situation |
Option A NE Waters |
Option B NE Waters |
Commercial Fish Populations (in 3-5 Years) |
|
43% (100% is populations that allow for maximum harvest) |
50% (100% is populations that allow for maximum harvest) |
47% (100% is populations that allow for maximum harvest) |
Fish Populations (all fish) (in 3-5 Years) |
|
31% (100% is populations without human influence) |
39% (100% is populations without human influence) |
36% (100% is populations without human influence) |
Fish Saved per Year (Out of 1.1 billion fish lost in water intakes) |
|
0% No change in status quo |
95% 1.0 billion fish saved |
50% 0.6 billion fish saved |
Condition of Aquatic Ecosystems (in 3-5 Years) |
|
48% (100% is pristine condition) |
52% (100% is pristine condition) |
52% (100% is pristine condition) |
$ Increase in Cost of Living for Your Household |
|
$0 No cost increase
|
$72 per year ($6 per month)
|
$24 per year ($2 per month)
|
HOW WOULD YOU VOTE? (CHOOSE ONE ONLY) |
|
I would vote for NO POLICY |
I would vote for OPTION A |
I would vote for OPTION B |
14

Question 7. If you always voted for NO POLICY in questions 4-6, what was the primary reason? Check one. (Skip this question if you voted for Option A or B in any question above.)
____ The cost to my household was too high
____ Preventing fish losses is not important to me
____ I do not trust the government to fix the problem
____ I would rather spend my money on other things
____ I did not believe the choices were realistic
____ Since the problem was created by private facilities, they should fix it without passing costs on to consumers
Question 8. Indicate how strongly you agree with the following statements about questions 4 - 6 and the information provided. Check one box for each.
|
S |
Disagree |
Neutral |
Agree |
Strongly Agree |
The survey provided enough information for me to make informed choices |
1 |
2 |
3 |
4 |
5 |
I feel confident about my answers |
1 |
2 |
3 |
4 |
5 |
Information in the survey was easy for me to understand |
1 |
2 |
3 |
4 |
5 |
Information in the survey was fair and unbiased |
1 |
2 |
3 |
4 |
5 |
Questions were easy for me to answer |
1 |
2 |
3 |
4 |
5 |
I would vote the same way in an actual public vote |
1 |
2 |
3 |
4 |
5 |
The effect of the proposed policies depends on many factors |
1 |
2 |
3 |
4 |
5 |
Future ecological conditions are never 100% guaranteed |
1 |
2 |
3 |
4 |
5 |
15
Question 9. How much did the following factors affect your answers to questions 4 – 6? Check one box for each row.
|
Effect on my answers to questions 4-6 |
||||||||
|
Very
Small Effect |
|
Moderate Effect |
|
Very Large Effect
|
||||
. |
|
|
|
|
|
||||
Wanting to reduce taxes or costs to my household. |
1 |
2 |
3 |
4 |
5 |
||||
Wanting to prevent the loss of industrial jobs. |
1 |
2 |
3 |
4 |
5 |
||||
Wanting to preserve fish for commercial fishing. |
1 |
2 |
3 |
4 |
5 |
||||
Wanting to send a message that all environmental issues are important regardless of cost. |
1 |
2 |
3 |
4 |
5 |
||||
Wanting to preserve fish for recreation (fishing, etc.). |
1 |
2 |
3 |
4 |
5 |
||||
Wanting to preserve fish to benefit aquatic ecosystems. |
1 |
2 |
3 |
4 |
5 |
||||
Wanting to know that fish exist in local lakes, rivers and bays. |
1 |
2 |
3 |
4 |
5 |
||||
Wanting to pay my fair share for government programs. |
1 |
2 |
3 |
4 |
5 |
||||
Wanting to sustain the competitiveness of US business |
1 |
2 |
3 |
4 |
5 |
||||
Wanting to preserve fish as a source of food for people. |
1 |
2 |
3 |
4 |
5 |
||||
Wanting to preserve fish and ecosystems for future generations. |
1 |
2 |
3 |
4 |
5 |
||||
16
 Question
10.
How many days did you participate in the following during the last
year? For trips longer than one day, please count each day
separately. Check one box for each row.
|
Number of days you did the activity during the past year |
||||
|
0 |
1-5 |
6-10 |
11-15 |
16+ |
|
|
|
|
|
|
Boating / Canoeing / Kayaking |
1 |
2 |
3 |
4 |
5 |
Swimming / Going to the Beach |
1 |
2 |
3 |
4 |
5 |
Recreational Fishing (Fresh Water) |
1 |
2 |
3 |
4 |
5 |
Recreational Fishing (Salt Water) |
1 |
2 |
3 |
4 |
5 |
Shellfishing / Crabbing |
1 |
2 |
3 |
4 |
5 |
Scuba Diving / Snorkeling |
1 |
2 |
3 |
4 |
5 |
19
18
17
The following questions ensure that all groups are fairly represented. All answers are anonymous and confidential.

What is your age? years
What is your gender? Male Female
What is the highest level of education that you have completed?
Less than high school One or more years of college
High school or equivalent Bachelor’s Degree
High school + technical school Graduate Degree
How many people live in your household?
How many of these people are 16 years of age or older? ____
How many of these people are 6 years of age or younger? ____
What is your zip code?
What town and state do you live in? Town: State:____
Are you currently employed? Yes No
What category comes closest to your total household income?
Less than $10,000 |
$60,000 to $79,999 |
$10,000 to $19,999 |
$80,000 to $99,999 |
$20,000 to $39,999 |
$100,000 to $249,999 |
$40,000 to $59,999 |
$250,000 or more |
I
 f
you have any comments on this survey, please write them below:
18
| File Type | application/vnd.openxmlformats-officedocument.wordprocessingml.document |
| File Modified | 0000-00-00 |
| File Created | 0000-00-00 |
© 2026 OMB.report | Privacy Policy


 trongly
Disagree