Sampling information and presentation info
0591 supplemental information - sampling frame, presentation results.docx
Annual Economic Survey of Federal Gulf and South Atlantic Shrimp Permit Holders
Sampling information and presentation info
OMB: 0648-0591
Table 1: Sampling Frame, Sampling Strata, Population Characteristics, Response Rate and Sample Size |
|||||||||||||||
|
|
|
|
|
|
|
|
|
|
|
|
|
|
|
|
|
Population |
Permits |
|
Vessel
Characteristics |
|
Sample |
Response Rate |
E(Completed) |
|||||||
|
SPA1 |
RSCZ2 |
RSLA3 |
SPGM4 |
|
Length |
HP |
Year |
Steel Hull |
Freezer |
|
||||
NC |
150 |
95% |
33% |
14% |
24% |
|
62 |
453 |
1983 |
35% |
15% |
|
52 |
0.9 |
47 |
SC |
53 |
98% |
15% |
0% |
6% |
|
54 |
382 |
1978 |
11% |
13% |
|
19 |
0.9 |
18 |
GA |
106 |
98% |
8% |
5% |
10% |
|
57 |
415 |
1977 |
14% |
15% |
|
37 |
0.9 |
34 |
FL |
350 |
60% |
13% |
9% |
67% |
|
52 |
402 |
1982 |
20% |
38% |
|
120 |
0.9 |
109 |
AL |
110 |
38% |
5% |
32% |
98% |
|
65 |
540 |
1990 |
71% |
55% |
|
38 |
0.9 |
35 |
MS |
122 |
10% |
2% |
4% |
99% |
|
71 |
593 |
1988 |
83% |
48% |
|
42 |
0.9 |
38 |
LA |
430 |
3% |
1% |
0% |
100% |
|
63 |
497 |
1989 |
77% |
28% |
|
147 |
0.9 |
133 |
TX |
600 |
4% |
1% |
1% |
100% |
|
74 |
637 |
1986 |
89% |
82% |
|
205 |
0.9 |
185 |
Other |
51 |
49% |
47% |
14% |
71% |
|
73 |
622 |
1989 |
78% |
39% |
|
18 |
0.9 |
17 |
Total |
1972 |
32% |
8% |
5% |
80% |
|
65 |
523 |
1985 |
62% |
47% |
|
678 |
|
616 |
|
|
|
|
|
|
|
|
|
|
|
|
|
|
|
|
Permit Type Count: |
625 |
154 |
108 |
1578 |
|
|
|
|
|
|
|
|
|
|
|
Sample by Permit: |
198 |
49 |
34 |
490 |
|
|
|
|
|
|
|
|
|
|
|
1 SPA: South Atlantic penaeid shrimp permit (open access).
2 RSCZ: South Atlantic rock shrimp permit – Carolina Zone (open access).
3 RSLA: South Atlantic rock shrimp permit – Limited Access (limited access).
4 SPGM: Gulf of Mexico shrimp permit (limited access).
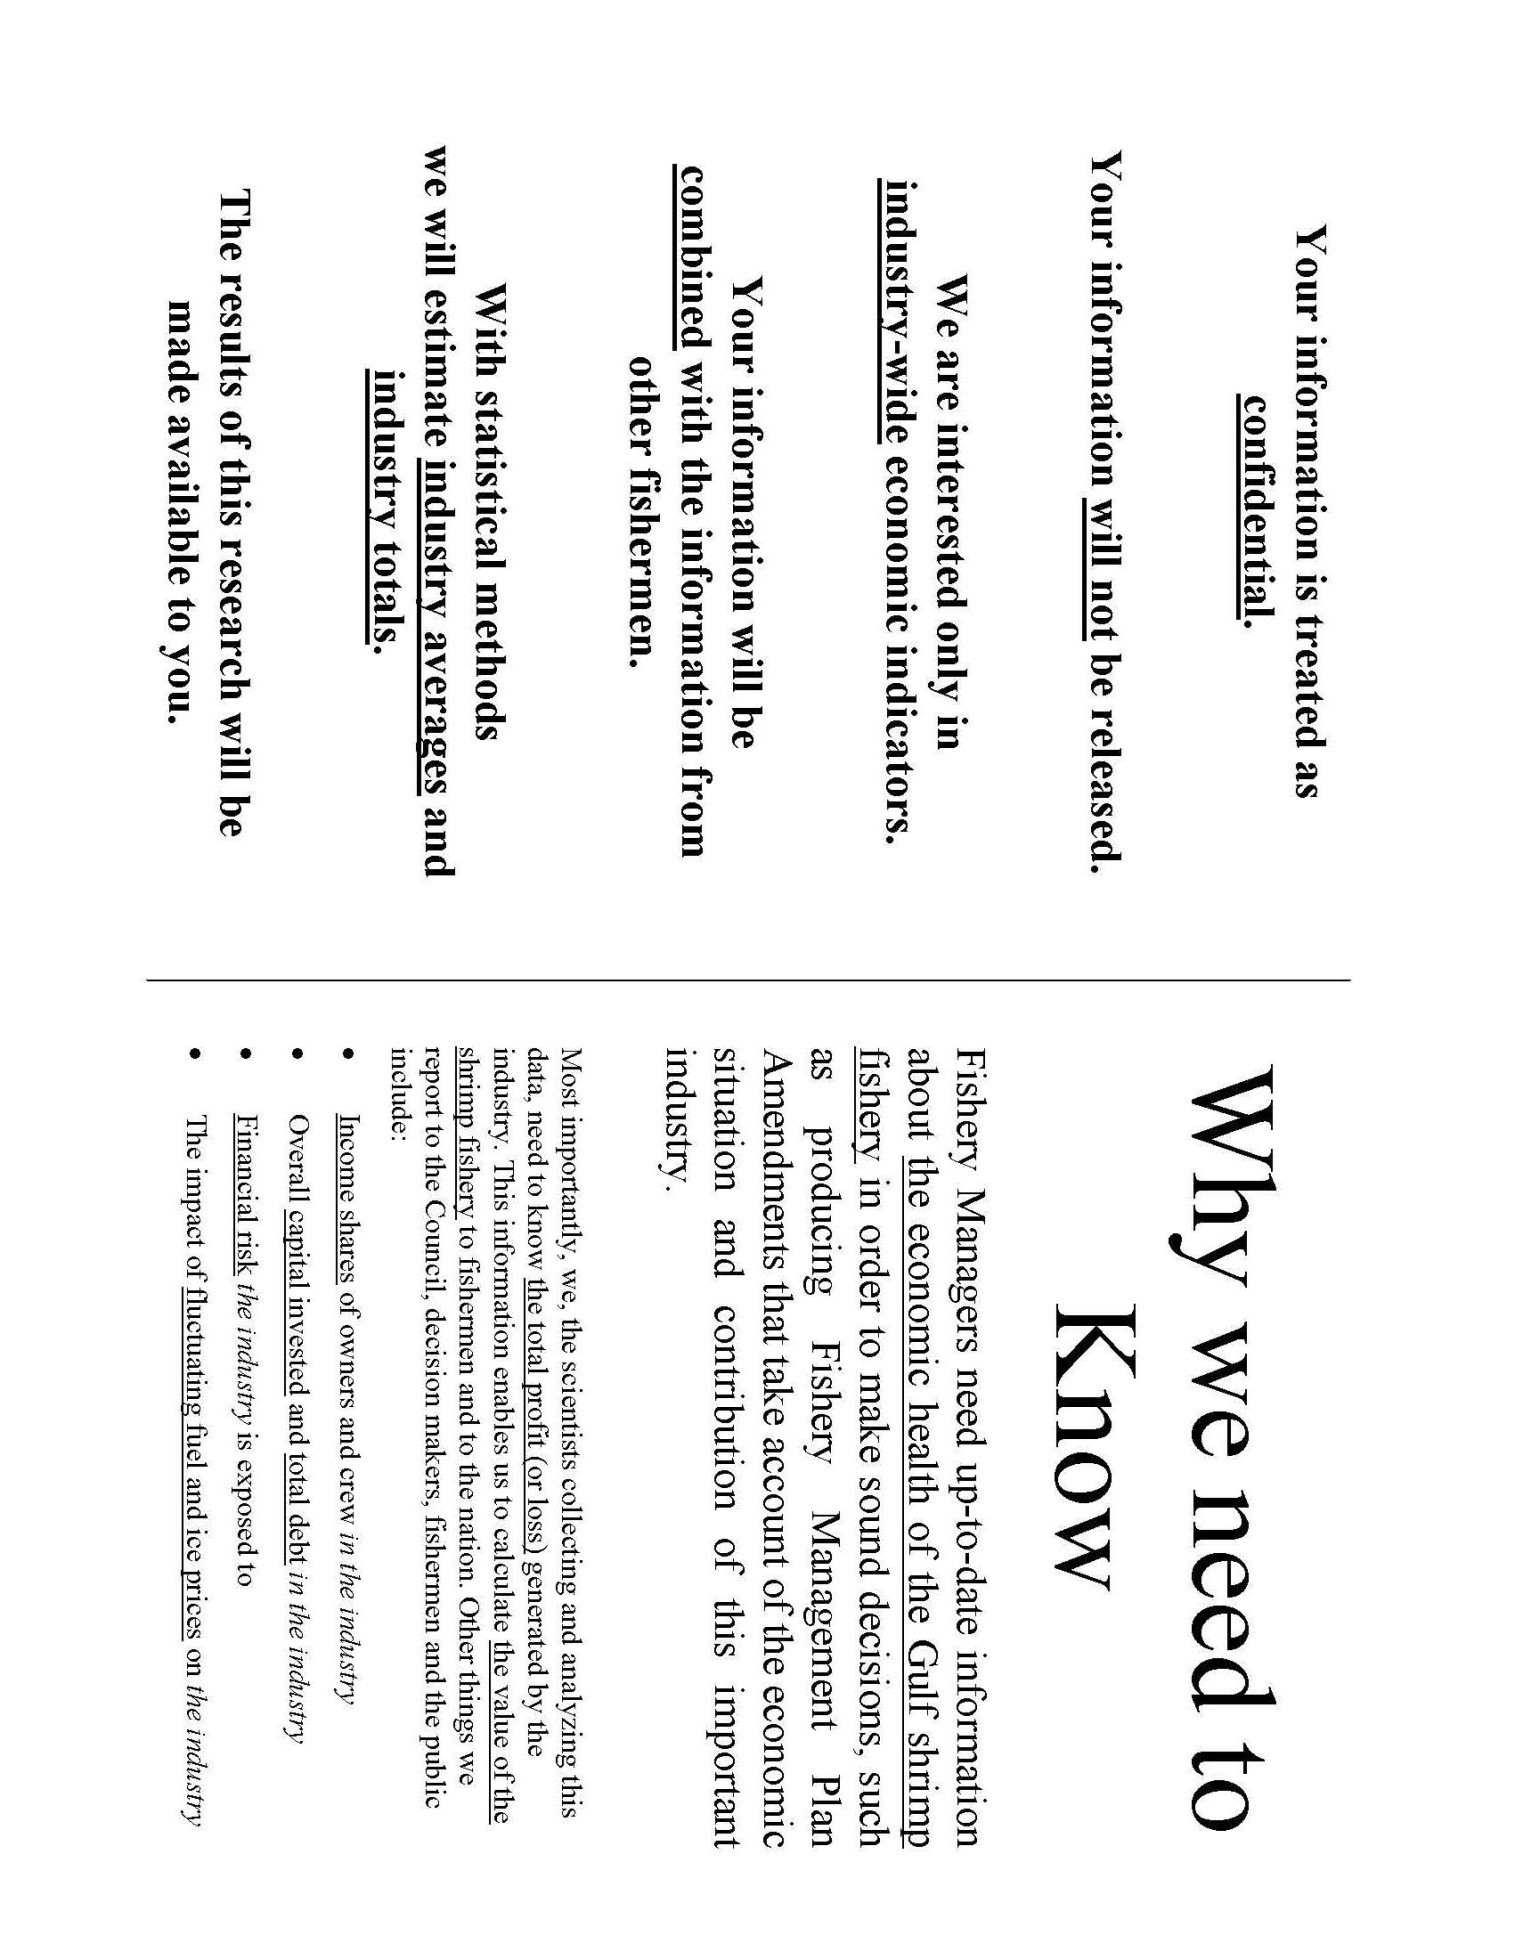
Figure 1: Example of Information Material
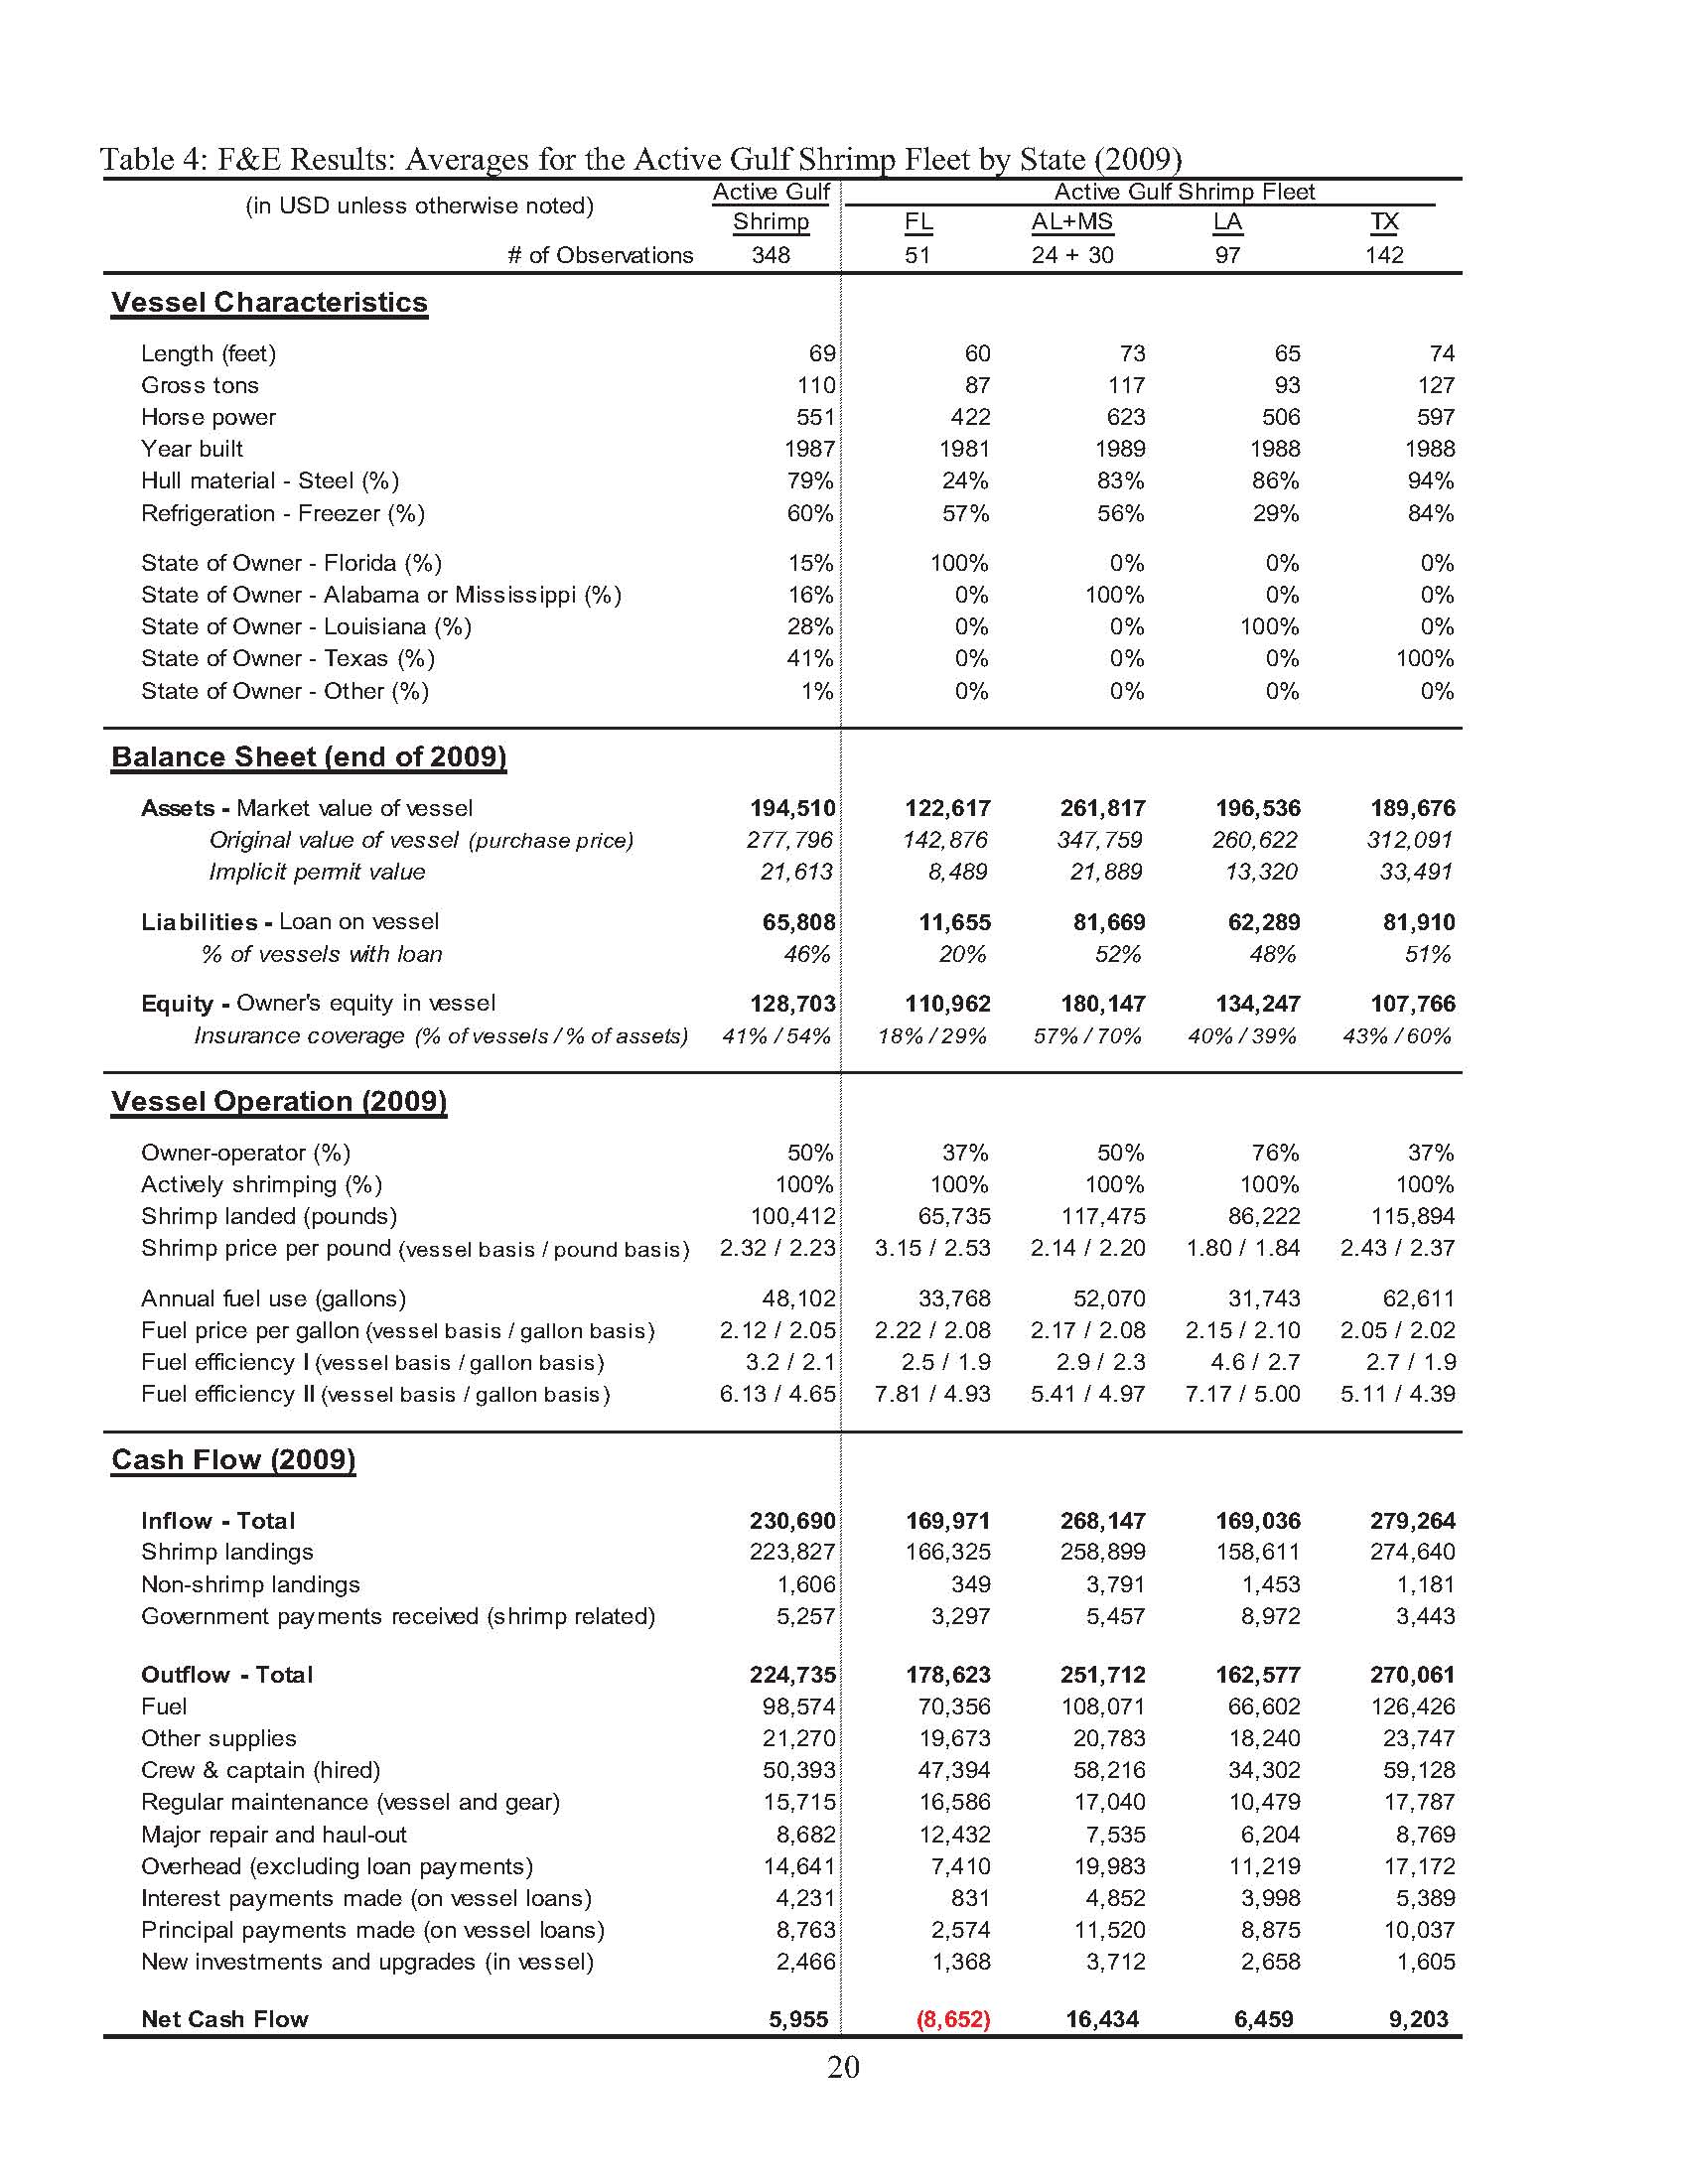
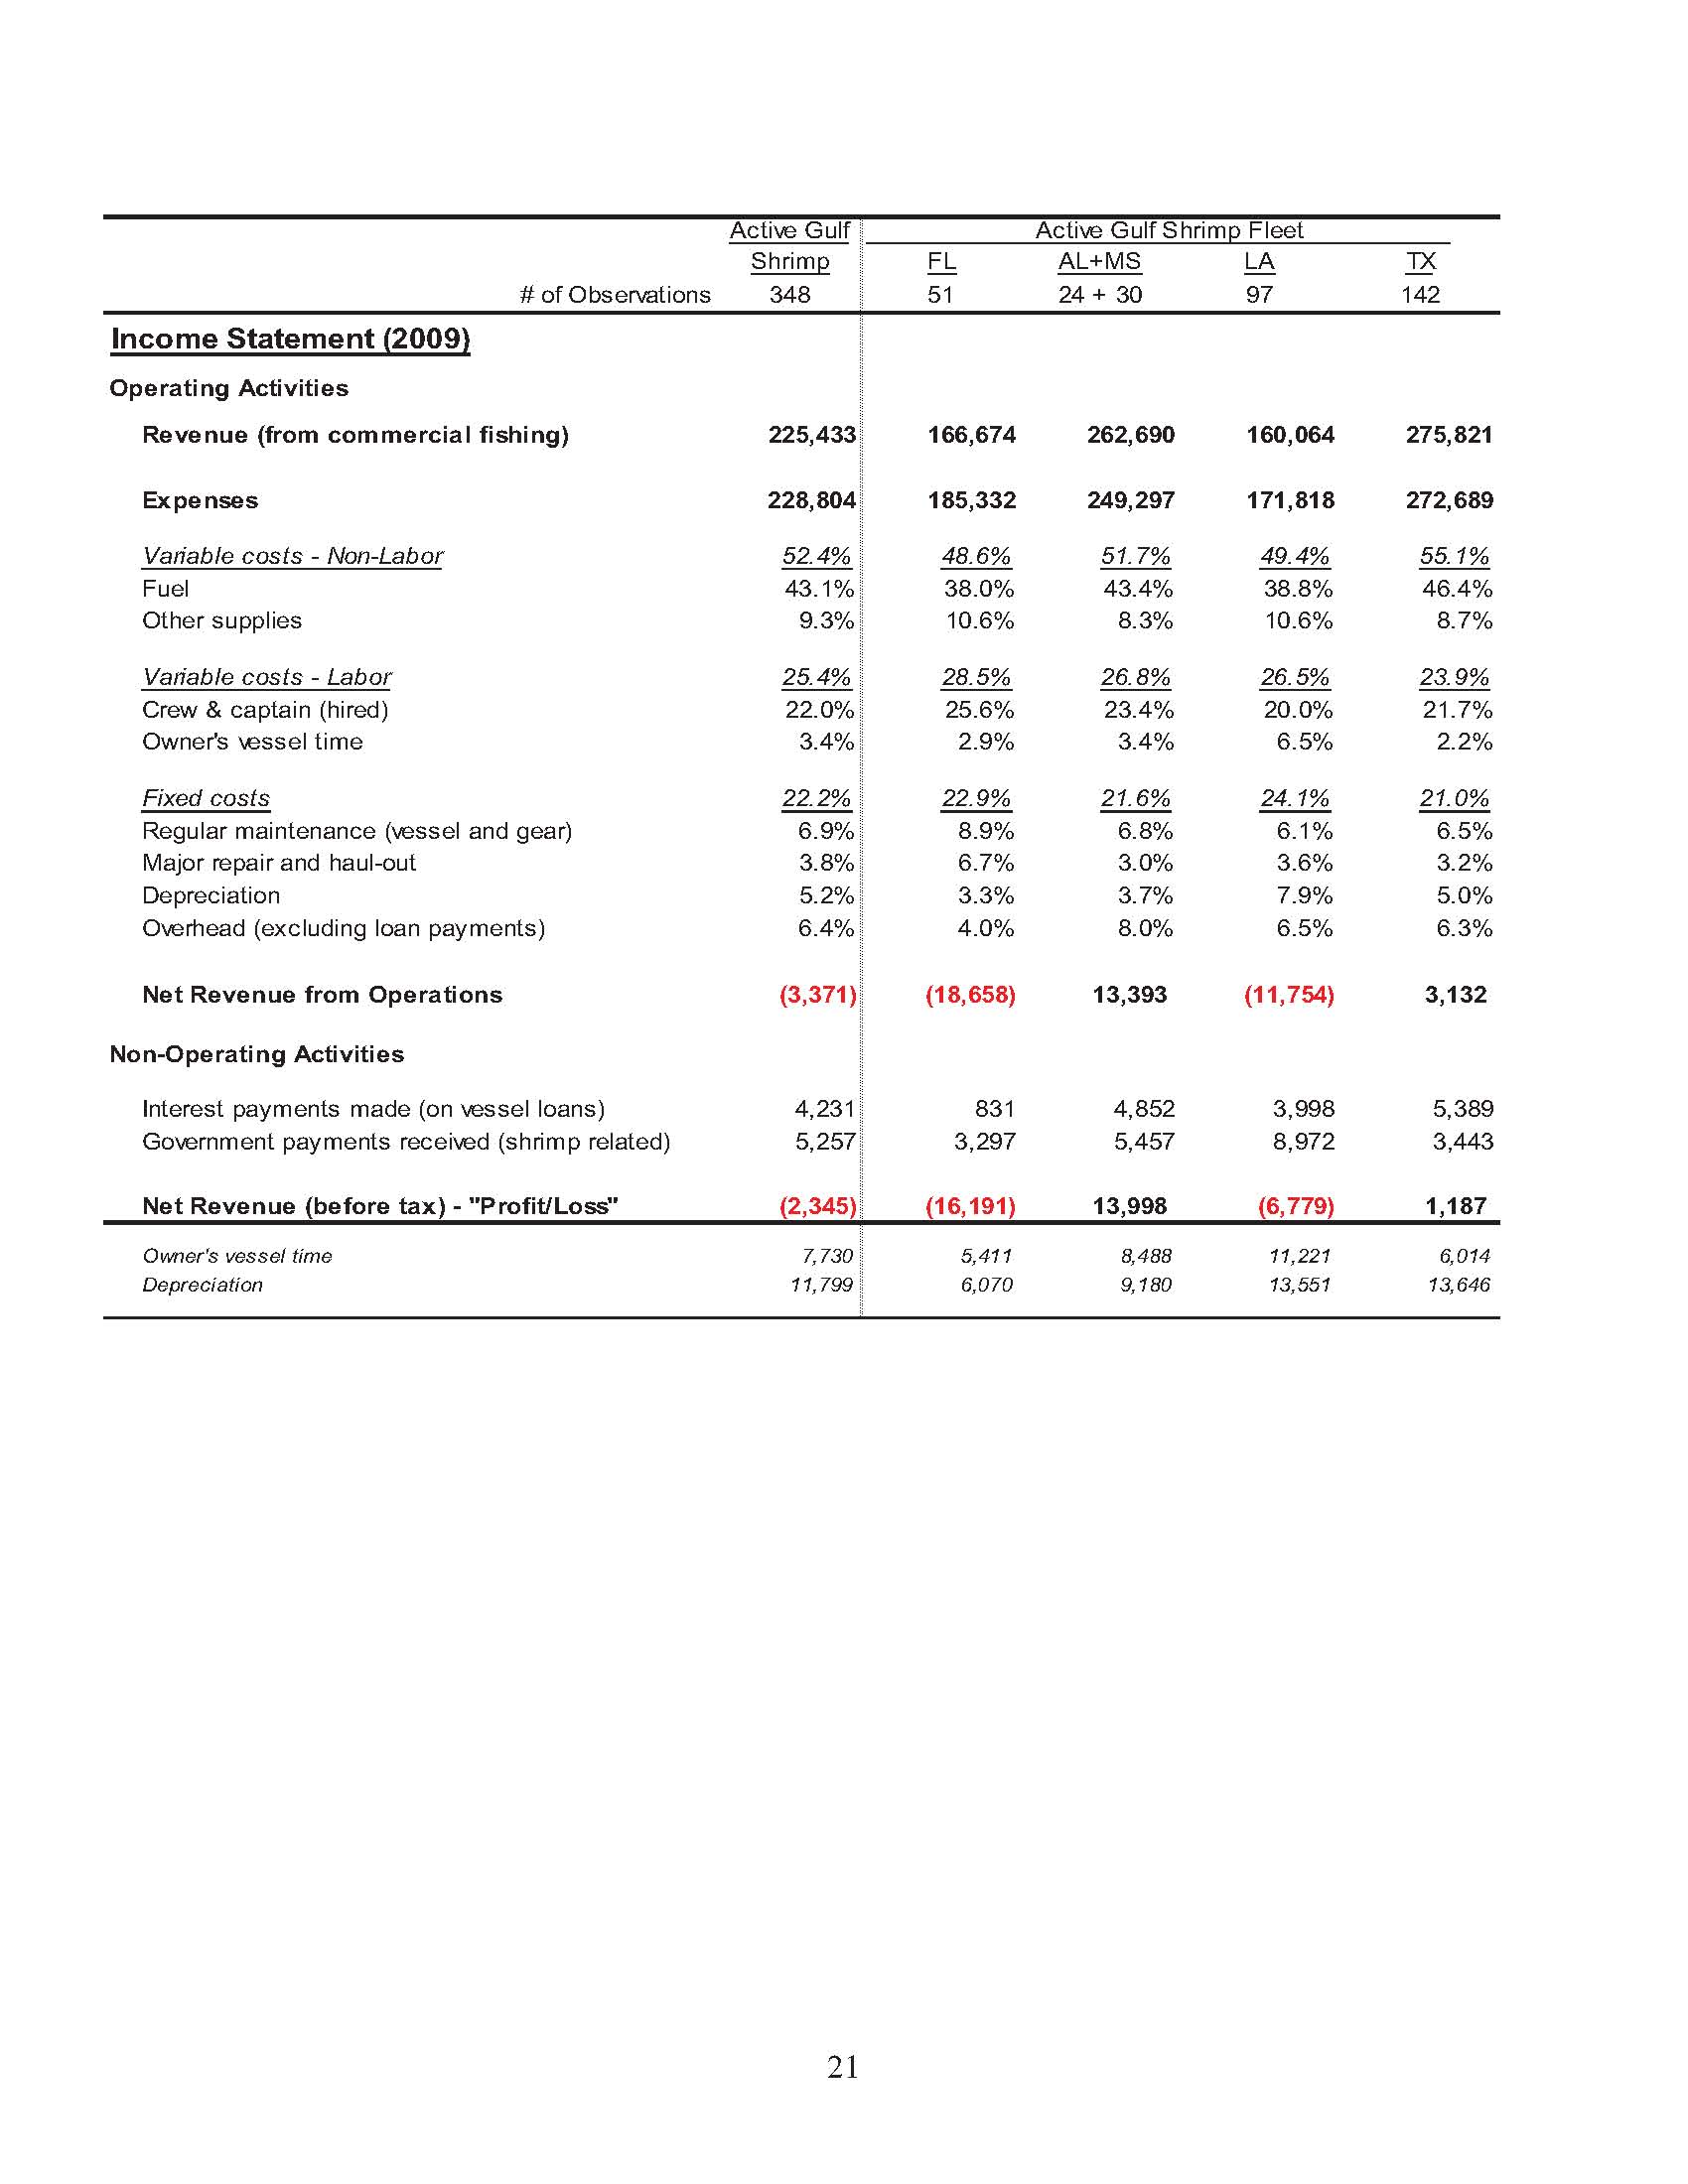
Table 2: Example of the Presentation of Results


| File Type | application/vnd.openxmlformats-officedocument.wordprocessingml.document |
| Author | Sarah Brabson |
| File Modified | 0000-00-00 |
| File Created | 2021-01-30 |
© 2026 OMB.report | Privacy Policy
