EECBG_ICR_Supporting_Statement_B - REVISED
EECBG_ICR_Supporting_Statement_B - REVISED.docx
Energy Efficiency and Conservation Block Grants Evaluation Survey
OMB: 1910-5172
Supporting Statement
Energy Efficiency and Conservation Block Grant Program Evaluation (EECBG)
OMB Control Number: XXXX-XXXX
B. Collections of Information Employing Statistical Methods
Describe (including a numerical estimate) the potential respondent universe and any sampling or other respondent selection methods to be used.
The sampling methods used for the EECBG evaluation are a modification to the general approach described in Section 4 of KEMA’s EECBG Evaluation Work Plan (Attachment A) dated February 9, 2012. The below section summarizes the methodology, detailing the respondent universe, sampling approach, respondent selection, and the results of the sample design.
1.1 GENERAL APPROACH
The sample allocation and selection process is based on the following definitions and guidelines:
Definition of Sampling Unit and Data Sources
The sampling units are defined as the unique activities within a grant or sub-grant awarded to a city, county, state, territory or Native American tribe. A total of 350 unique activities will be evaluated.
Data Sources:
Direct Grant Activities: The sample of direct grant activities will be selected from information available in DOE’s Performance and Accountability for Grants in Energy (PAGE) database.
Sub-grant Activities: The selection of the sub-granted activities requires a two-step process. First, a sample of the State grants is selected from the PAGE data base. Program Officers will be asked to provide basic information about each of the activities for each of the selected State grants. From the list of activities within each of the sampled State grants, unique activities will be selected for evaluation.
Sample Selection Guidelines
Define the population frame
Allocate sample units across Direct vs. State categories and Broad Program Areas (BPAs) in proportion to the total budget for each grant category and BPA.
Within each BPA, determine the threshold for certainty selection for Direct grants based upon budget. All activities with budgets greater than the threshold will be sampled with certainty. For State grants, the activity level data for the selected states will be reviewed, and it will be determined whether to apply a purely random or selected-with-certainty methodology. If there are some very large activities within a selected State grant, it would be more appropriate to sample that grant with certainty. If the State grant is comprised of a variety of grants that are roughly the same size, then a random sample is appropriate.
For the activities not selected with certainty, random samples will be chosen using a form of the “systematic proportional to size” method. For this study, an activity has a probability of selection that is proportional to the size of its budget.
In addition to the primary sample for both Direct and State grants, a set of alternate activities will be selected and kept in reserve to allow for cases where it is not possible to evaluate a certain activity.
Following these general guidelines, we proceeded to design and select a sample of EECBG activities for evaluation. The first sampling phase is complete, and the sample of Direct grant activities has been selected. In this phase, we also selected the State grants for which additional information will be gathered in order to complete the second sampling phase. Each of these steps is described in the following sections.
It should be noted that it is possible some Direct and State grant managers contacted for the EECBG evaluation may also be contacted as part of the State Energy Program (SEP) and Weatherization Assistance Program (WAP) evaluation studies. However, the EECBG interviews will focus on different program activities than those addressed in the SEP and WAP studies.
1.2 DETERMINATION OF POPULATION FRAME
The population for this study is the current set of EECBG-funded activities, as extracted from DOE’s PAGE data base on March 30, 2012. The records in this population are the individual “Activity Worksheet Unique IDs”, which will be referred to here as IDs. Each ID is identified by its Broad Program Area (BPA), Metric Activity (MA), State, and Grant Number. The information provided for each ID includes the total approved budget, percent complete and percent spent, among many other variables. DOE also provided KEMA with a list of IDs that were “Direct” grants, as compared to grants to state/territorial agencies, which were to be sub-granted to other recipients. For purposes of this document, the sub-granted IDs will be referred to as “State” grants.
In order to focus our sampling strategy on grant activities that account for significant portions of the overall program, we applied a number of filters to the population to create the population frame. The goal is to ensure that at least 80% of the total program expenditures are represented. Per the work plan, the first filter that was applied was to include only the top six BPAs. Table 1 shows totals for all BPAs, and indicates that the top six account for 84.2% of the total budget.
Table 1: Top Six Broad Program Areas

The top six BPAs include 164 State grant activities and 5,358 Direct grant activities. Upon review of the budget, percent complete and percent spent in each category, we determined that there were some Direct grant activities that were either too small or too incomplete to evaluate. Therefore, the population of Direct grant activities eligible to participate in the sample was filtered by removing the following:
Duplicate IDs – A small number of IDs appeared in the extract file twice. We assumed this was an error and kept only one of each.
Small Budgets – Grant activities with approved budgets of less than $10,000 were excluded.
Lack of Progress – Grant activities that were 0% complete and 0% spent were excluded.
Table 2 shows the impact of these exclusions on the size of the population, in terms of activity counts and budgets. While the exclusions total nearly 15% of the number of Direct grant activities, they account for less than 4% of the Direct grant budget.
Table 2: Direct Grant Population Filters

When the remaining Direct grant budget is combined with the State grant budget, the recommended population frame represents 82% of the EECBG total budget.
1.3 ALLOCATION OF SAMPLE TO CATEGORIES
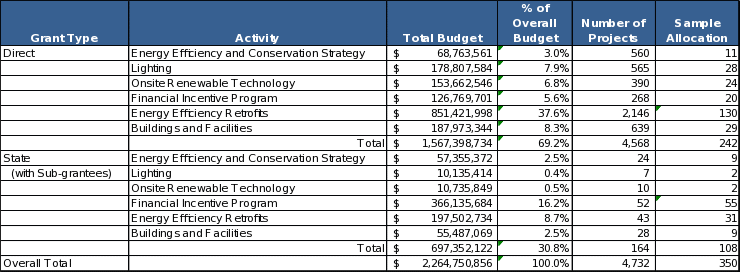
EECBG budgets by Direct vs. State and Broad Program Area are shown in Table 3. Direct grants account for about 70% of the overall budget. The percentages of overall budgets in this table are used to allocate the 350 sample activities to the 12 categories: the top six BPAs for Direct grants and the same six for State grants.
Table 3: Allocation of Sample to Categories
1.4 SELECT LARGE ACTIVITIES WITH CERTAINTY
For purposes of this step, size is defined as activity budget. The objective of the sampling strategy is to ensure that the study findings are representative of the overall EECBG program. Therefore, activities which comprise a large proportion of the total program budget should be included in the sample. In the EECBG Evaluation Work Plan, we proposed an iterative process for selecting grant activities relative to a specific budget threshold defined as the total budget for the BPA divided by the sample size for the BPA. According to this procedure, the activities with budgets greater than the threshold would be included in the sample and the certainty threshold would be recalculated omitting the selected activities and corresponding numbers of sample points.
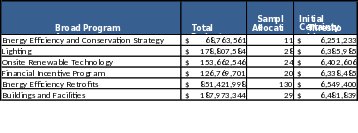
Instead, we chose a variation of the methodology that ensures the largest activities are selected in the sample in a more streamlined process. First, we determined the appropriate threshold for certainty selection separately for each BPA (total budget/sample allocation). Table 4 shows the initial certainty thresholds for each BPA. For two BPAs, Energy Efficiency and Conservation Strategy and Onsite Renewable Technology, the activity budgets are evenly distributed, and no activities exceed their certainty threshold. Therefore, selection of activities in these two BPAs is random.
Table 4: Initial Certainty Thresholds for Direct Grants
However, for the four BPAs that have activity budgets above the certainty threshold, we want to ensure that all large activities are adequately represented in the sample. Depending on the number of sample points allocated to the BPA and the distribution of activities, by size, within the BPA, it was necessary to adjust the thresholds to ensure that the activities with relatively high budgets were selected with certainty. The method we used to achieve this goal began by sorting the activities within each of the four BPAs in order of descending budget. Then, within each BPA, we calculated the percent of total budget and cumulative percent of total budget (Cum%Budget) for each activity. We also calculated a cumulative activity count, expressed as a percent of sample points allocated to the BPA (Cum%Sample). Those activities for which the Cum%Budget exceeds the Cum%Sample are selected with certainty. The final certainty thresholds for the BPAs are presented in Table 5.
Table 5: Final Certainty Thresholds for Direct Grants
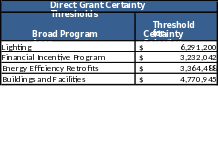
Table 6 provides the number of sample points allocated to each BPA, and the number of activities that was selected with certainty. For example, in the Financial Incentive Program area, five of the twenty allocated sample activities were selected with certainty. In this case, the threshold for inclusion was just over $3 million. This threshold varies by BPA, depending on the distribution of activities by size.
Table 6: Direct Grant Activities Selected with Certainty

The 32 certainty sample activities are removed from the population of Direct grant activities, leaving a total of 210 activities to be selected randomly. The number of randomly sampled activities to be selected from each of the six BPAs is shown in Table 6.
1.5 RANDOM SELECTION METHOD
The sampling method used for the non-certainty Direct grant activities and the State grant activities is a form of systematic proportional to size sampling. This sequential random sampling approach (Chromy’s method) is described in the SAS manual as follows:
“Chromy’s method selects units sequentially with probability proportional to size and with minimal replacement… Sequential random sampling controls the distribution of the sample by spreading it throughout the sampling frame, thus providing implicit stratification according to the order of units within the frame…”
The following figure shows an example of systematic proportional sampling.
Figure 1: Illustration of Systematic Proportional Sampling
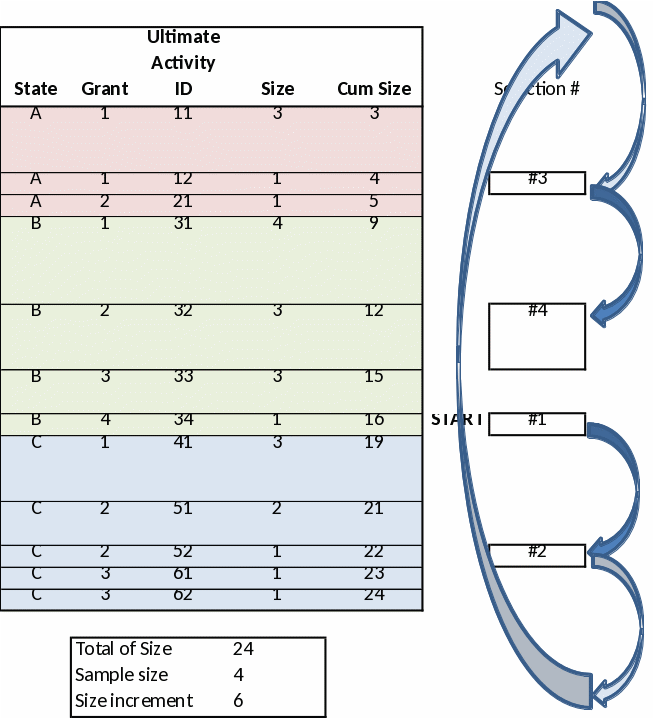
The frames from which the samples are selected are first separated into 12 sectors (top six BPAs for Direct grants and for State grants), and the numbers of activities that need to be selected from each are specified. Within each frame, the population is first sorted by metric activity, state, grant number, and activity ID. This ensures that the selection will result in a sample that is widely disbursed over the frame.
A key feature of this method is that a State activity can be selected more than once because State activities are comprised of numerous individual activities. This is used to determine the number of ultimate activities that will be selected from within each of the State grant activities, once the detailed information is collected.
In order to ensure that backups are available in the event that any selected activities cannot be evaluated, an extra round of sample selection was run. After deleting the certainty samples and the primary random samples from the population frames, the sorting and selection process was repeated to produce a list of 350 alternate activities.
2. Describe the procedures for the collection of information:
The evaluation of the EECBG program will be based upon information obtained from three key data sources:
PAGE (Performance Accountability for Grants in Energy) and other DOE and OMB databases and Activity documentation to include reports and records filed by grantees and sub-grantees;
DOE Project Officer (PO) Interviews – Interviews will be conducted with DOE POs to obtain preliminary information on sampled grant Activities within their jurisdiction; and
Grant Activity Manager Survey (GAMS) – CATI survey with grantee/sub-grantee project managers who are closest to the project and programs conducted under each sampled Grant Activity.
The following section describes each data collection activity and how these efforts will form the basis for evaluating the EECBG program.
2.1 ACTIVITY DOCUMENTATION AND REPORTING DATA
The evaluation will incorporate an in-depth review of the data that grantees and sub-grantees are required to report to the Office of Management and Budget (OMB) and DOE1 on a quarterly basis. The type of information reviewed will include the following:
Quarterly reporting to OMB (federalreporting.gov) - Required of grantees, may be delegated to sub-grantees
Total amount of ARRA funds received from DOE
Amount of ARRA funds expended or obligated to projects or activities
Detailed list of all projects or activities
Information on subcontracts or sub-grants awarded by Prime Recipient
Quarterly reporting to DOE (PAGE) – Required of all EECBG Grantees
All Prime Recipients are required to report quarterly through PAGE. Allocations greater than $2M are required to report a subset of the quarterly data on a monthly basis in PAGE. Reporting may be delegated to sub-recipients. The PAGE reports used are:
Federal Financial Report (SF-425)
Performance Report (at the level of Activity)
Activity Status
Activity Milestones
Financial Metrics
Progress Metrics
Grant Reporting and Analysis Software System (GRASS) – Compliance and monitoring data provided by EECBG DOE POs
Inputs are based on information grantees submit to PAGE and on findings from monitoring desk reviews/visits
Primarily compliance and procedural in nature
Narrative component can provide insight into project/program accomplishments, challenges, and keys to success
2.2 DOE PROJECT OFFICER (PO) INTERVIEWS
Following a careful review of project documentation and reports, direct data collection will be performed through interviews with DOE POs and Regional and State Coordinators. This data collection will confirm information collected from the PAGE database and other program data sources (as described above) and obtain more detailed information necessary for the calculation of energy savings. It is recognized that in many cases the PAGE database may not contain sufficient detailed measure data; therefore, these surveys are designed to obtain an understanding of the Activity from the DOE POs’ perspectives. In addition, DOE POs will confirm the appropriate contact most knowledgeable about each respective sampled Activity at the grantee/sub-grantee level, resulting in a higher GAMS CATI response rate.
DOE Project Officers located in 50 states and 5 territories are responsible for overseeing a portfolio of EECBG grants within their geographical jurisdictions. A second tier of oversight for EECBG grants is provided by DOE Regional and State Coordinators. Through DOE’s Technical Assistance Network, there are State and Regional Coordinators who engage with all EECBG grantees on a regular basis. While they are responsible for coordinating technical assistance needs through a network of subject-matter expert teams, they engage with all grantees in their area on many levels. Some coordinators have a deep understanding of grantee programs, program/project players, obstacles, and successes. They provide regional peer-to-peer opportunities for grantees to learn from one another and in general “keep their finger on the pulse” of grantee activities.
Seventeen regional coordinators located around the country provide assistance to EECBG grantees regarding a range of subjects.
2.3 GRANT ACTIVITY MANAGER SURVEY (GAMS)
This CATI instrument is the heart of the evaluation in that it is used to verify self-reported data on the specific activities sampled for energy savings calculations. It is also the critical source of data beyond that which is found in PAGE or the other available data sources, since it collects information directly from the grantees and sub-grantees that are responsible for implementing the sample Activity. The GAMS will be administered to individuals identified by DOE POs as the most knowledgeable about each respective sampled Activity.
The detailed data collected through this instrument will provide technical information required to calculate savings estimates. The instrument’s primary functions are to:
Confirm proper categorization of the sampled Activity;
Understand the respondent’s role in the Activity;
Verify data from PAGE and other sources as to the project description and what energy saving actions were taken;
Gather additional detail regarding buildings treated, equipment and measures installed, persistence of measures, changes in operations and building and measure characteristics to enable calculation of energy savings; and
Determine attribution of Activity outcomes.
The survey is modular in design and follows a series of skip patterns. Respondents will only answer the modules that address their sampled Activity. Figure 2 outlines the sequence and modules of this survey.
Figure 2: Grant Activity Project Manager Survey – Instrument Flowchart Map
Part
I (phone)
Part
II (on-line)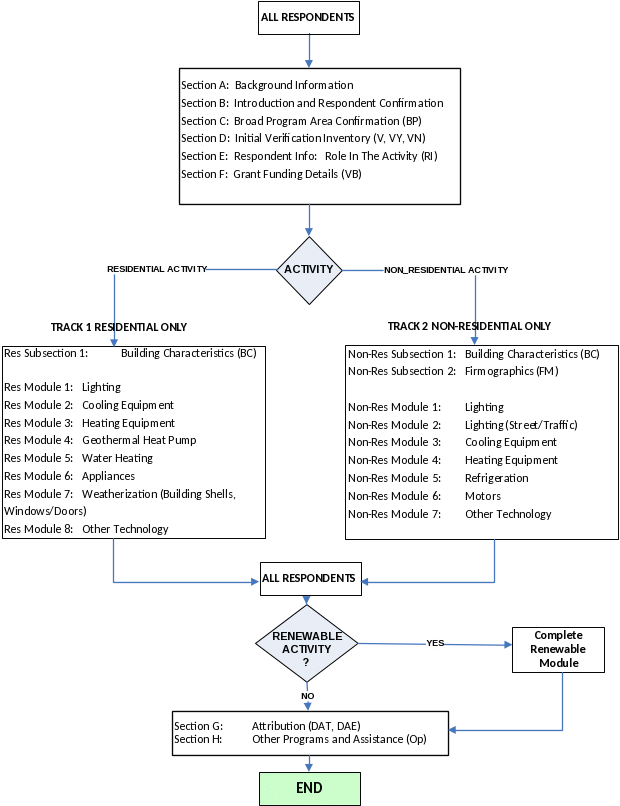


Survey Process
The survey will start by verifying that we have the most knowledgeable person for the Activity on the phone and that adequate time is set aside for the interview. If the initial contact person is not the appropriate contact, the interviewer will ask for the contact information for the appropriate person. All calls will be scheduled ahead of time to allow the respondent to prepare for the discussion and set aside the time necessary to complete the survey.
2.4 BENEFITS AND RESOURCE EFFICIENCY
There are several efficiencies built into the data collection process that will minimize the burden on respondents. First, a large portion of data is collected through the review of databases and reports. Those data are then validated and augmented through the DOE PO interviews before any GAMS interviews are conducted. The evaluation team will use that data to custom pre-populate a GAMS survey for each sampled Activity. Accordingly, a large part of the CATI survey will simply consist of verifying project information with sub-grantees and grantees, streamlining the process and expediting the interview.
A second efficiency results from the data collection design and approach. One individual evaluation team member will be assigned to each unique sampled Activity. This individual will follow the investigation for a Grant Activity from start to finish including:
Conduct review of EECBG databases, reports, and project documentation;
Conduct DOE Program Officer calls;
Pre-populate GAMS CATI; and
Conduct GAMS interview.
Employing this strategy, DOE seeks not only a more cohesive and efficient process but a better quality result and end-product.
Thirdly, the GAMS CATI instrument is designed with modules, or sections, where respondents may skip entire groups of questions that do not apply to their sampled Activity. The survey instrument in its entirety appears long as it is necessary to accommodate all potential situations and scenarios across 350 unique Activities. In executing the surveys, however, respondents will only be asked questions that apply to their sampled Activity. The vast majority of interviews will involve only a small subset of the overall survey sections. For example, it would be a rare situation that any one interviewee would be subject to the entire set of GAMS modules (meaning that a facility was treated with measures in all categories including an on-site renewable energy system).
Verification of Measures and Actions
The BPAs Energy Efficiency Retrofits, Lighting, and On-Site Renewables are likely to involve actual installations of measures in buildings due to the nature of these categories allowing DOE to proceed quickly to energy savings related questions in the Residential and Non-Residential Track modules. For the other BPA categories, a sequence of questions unique to each category must be posed before one can determine whether buildings or facilities are actually treated (directly or indirectly), what types and how many, whether any information is available on those buildings/treatments, and whether the respondent has the knowledge to be able to provide that information.
Two examples of sampled activities are provided below:
Example 1: Financial Incentive Program Activity
An Activity selected into the sample under the Financial Incentive Program BPA may be determined to consist of a loan program for small businesses to replace lighting systems. The survey will, therefore, ascertain what types of non-residential buildings were targeted (small business), how many actual small business facilities were treated using loans given out under the Activity, how many lighting measures were installed in those facilities and what types of measures. More information will be sought regarding what kinds of equipment were replaced, hours of use data for the facilities, and other information necessary for developing an estimate of energy savings.
Example 2: Energy Efficiency and Conservation Strategy Program Activity
An Activity selected under this BPA has a greater chance of not resulting in specific treatments made to a building or facility, due to the nature of the activities described under this category. Most often activities under this BPA consist of indirect energy savings projects, such as development of a Community Sustainability Plan or other policy, communications and educational projects. Some jurisdictions may have information about specific buildings treated or actions taken as a direct or indirect result of such activities. DOE will seek to determine whether any buildings were actually treated, how many, what types, and with what treatments.
For each sampled Activity, if it is not possible to collect the data required to determine if energy-saving actions were taken, then the activity is deemed un-evaluable and will be replaced with another Activity as discussed in Section 1. However, if it is confirmed that no actual energy savings actions were taken for an Activity selected in the sample, these findings will be documented and included in the overall study results and the survey will be concluded.
Attribution Questions
Following the customized questions from the Module questions, all respondents will be guided to Section G for a series of questions related to attribution. These questions are based upon industry-standard methods of probing for the extent to which the specific intervention – in this case, the funding from the EECBG grant – influenced the actions taken. In the case of many EECBG activities, it is likely that other funding sources were tapped to complete the project; whereas in others, the entire project may have been paid for exclusively with EECBG grant dollars. Beyond the question of funding, attribution questions also deal with the decision-making process. Was the project planned prior to the seeking of funding from EECBG? Would it have gone forward without EECBG funding?
The results of these questions will feed the analysis of attribution by applying a factor to the energy savings reductions achieved. If the EECBG grant is the primary source of influence, then the energy savings and demand reduction impacts will not be adjusted downward. If, however, the EECBG grant was only one factor in the decision to proceed with the project, or if the project had multiple funding sources, then the energy savings reductions will have to be adjusted to account for the various influences on project outcomes.
3. Describe methods to maximize response rates and to deal with issues of non-response.
Based on previous experience, we anticipate that response rates for the surveys of probability samples planned will achieve the following response rates:
Telephone surveys of commercial and industrial customers/participants in incentive programs range between 32% and 63%, typically achieving response rates of roughly 47%
Telephone surveys of commercial and industrial customers/participants in training and technical assistance programs range between 19% and 70%, typically achieving response rates of roughly 44%
We will employ a variety of best practices in order to maximize response rates and minimize non-response bias, to include:
DOE PO interviews – Interviews with DOE POs will assist in identifying the most relevant respondents for a given Activity, increasing likelihood of response.
Conservative treatment of sample – DOE will release the sample in batches. Within each batch, a scheduler or evaluator will make at least eight attempts to contact respondents calling at different times, over different days, leaving a minimum of three messages with a callback number.
Appointment scheduler – A scheduler will be used to notify respondents that they are included in the sample, provide background information on the survey, and schedule a convenient time and date for the interviewer to conduct the survey.
Call times –We will place calls to grantees and sub-grantees during hours most appropriate for reaching respondents in their respective time zones. For example, small contractors can typically be reached early in the morning (7am) or in the evening (7pm), with greater difficulty reaching them at other times of the day.
We expect the application of such techniques to yield response rates at the highest end of the scales described above.
Methods for dealing with non-response
In order to assess the presence and extent of non-response bias, DOE will contrast key parameters in the respondent group to the overall sample frame. For example, DOE will identify under-represented commercial and industrial segments by contrasting the proportion of each segment in the respondent pool relative to the overall sample frame. Other parameters within the sample frame used to identify the presence of non-response bias may include measure categories and company size. Where possible, DOE will also contrast parameters of the respondent pool’s profile to secondary data sources. Use of secondary data sources will help examine whether non-response impacts the estimated outcomes as a result of regional differences between the sample frame across BPAs and the overall population.
Once DOE characterizes the magnitude and potential direction of non-response bias on estimated outcomes, adjustment factors will be derived to estimate outcomes. Secondary data will provide one source of possible non-response adjustments.
4. Describe any tests of procedures or methods to be undertaken.
In all cases, DOE adapted previously field-tested survey questions to develop the GAMS CATI survey instrument. In addition to adapting individual survey questions, the team also incorporated the flow and skip pattern of each instrument using previously tested groups of questions. Therefore, while the survey is original, the questions consist of a compilation of the research team’s combined experience in fielding similar studies across a broad spectrum of research areas.
The Survey Cover Letter included in this ICR submission identifies GAMS questions along with their source.
Provide the name and telephone number of individuals consulted on statistical aspects of the design and the name of the agency unit, contractor(s), grantee(s) or other person(s) who will actually collect and/or analyze the information for the agency.
Miriam L. Goldberg, Ph.D.—Senior Vice President – Sustainable Use, DNV KEMA DNV Energy & Sustainability; 608-259-9152 x70211; [email protected].
DNV KEMA is the evaluation contractor and will coordinate data collection and analysis. Data collection will be carried out jointly by DNV KEMA and its subcontractors.
1 DOE EECBG Program Notice Effective April 21, 2010, formula grant reporting guidance.
| File Type | application/vnd.openxmlformats-officedocument.wordprocessingml.document |
| Author | eXCITE |
| File Modified | 0000-00-00 |
| File Created | 2021-01-30 |
© 2026 OMB.report | Privacy Policy