Passport Survey Nonresponse Bias Analysis
Passport Survey Nonresponse Bias Analysis (4-2013).doc
Passport Demand Forecasting Study
Passport Survey Nonresponse Bias Analysis
OMB: 1405-0177
Nonresponse Bias Analysis for the Passport Demand Survey
The art and science of nonresponse bias analysis, which aims to quantify the potential bias that could result due to differential nonresponse, provide an empirical foundation that serves two distinct objectives. First, a data-driven strategy will be developed to guide the process that will be used to weight the survey data. Specifically, prior to the final step of post-stratification or raking, design weights will be adjusted for nonresponse. As such, our nonresponse bias analysis will help identify effective subgroups within which this interim adjustment should take place to significantly reduce bias due to differential nonresponse.
Secondly, nonresponse bias analysis will identify domains for which the resulting survey estimates may be subject to non-ignorable bias. This is particularly important for surveys that experience low rates of response, for which some measure of bias may remain even after adjustments for differential nonresponse and calibration of weights to target totals. While specific steps that will be taken to implement nonresponse bias analysis for this survey will be established after availability of survey data, some of the main steps that will be taken are outlined below.
Typically, surveys that secure low to modest rates of response are expected to conduct a nonresponse bias analysis to assess the potential magnitude of nonresponse bias before the data or any analysis using the data are released. For this purpose, estimates of survey characteristics for nonrespondents and respondents are required to assess the potential nonresponse bias. Theoretically, the bias in an estimated mean, say, can be expressed as follows:
![]()
In the
above
represents the
unknown population parameter of interest that would result if a
complete census of the entire population is conducted and all units
respond, and
![]() represents
its estimate based on data from respondents only. However, for
variables that are available from the sampling frame for both
respondents and nonrespondents,
can be estimated by
represents
its estimate based on data from respondents only. However, for
variables that are available from the sampling frame for both
respondents and nonrespondents,
can be estimated by![]() and
the bias in
and
the bias in![]() can
then be approximated by:
can
then be approximated by:
![]()
Moreover,
with![]() representing
the weighted unit nonresponse rate,
representing
the weighted unit nonresponse rate,
![]() can
be decomposed into two components by:
can
be decomposed into two components by:
![]()
Consequently,
the bias in![]() can
be estimated by:
can
be estimated by:

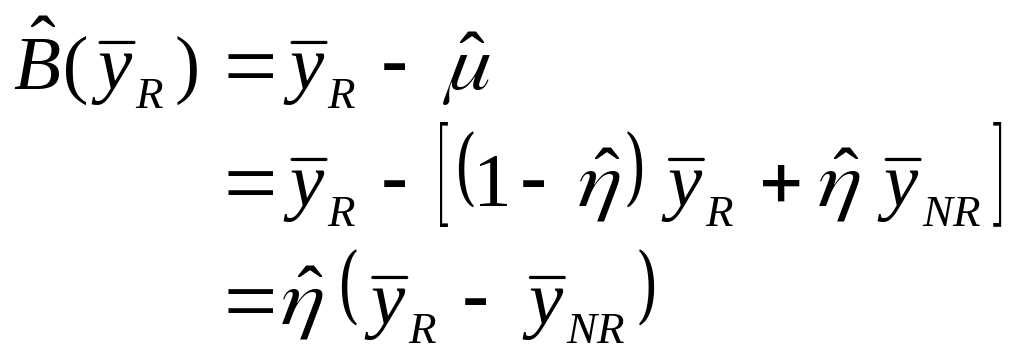
That is, the estimate of the nonresponse bias is the difference between the mean for respondents and nonrespondents multiplied by the weighted nonresponse rate, using the design weight prior to nonresponse adjustment. Here, a respondent will defined as any sample member who is determined to be eligible for the study and has valid data for the selected set of key analytical variables.
Once the potential bias for variables available for both respondents and nonrespondents have been estimated, they will be tested (after adjusting for multiple comparisons) to determine if the observed bias is significant at the 5 percent level significance. In the second step, nonresponse adjustment procedure will be designed to reduce nonresponse bias based on the information obtained during the first step. In the third step and after the nonresponse-adjusted weights have been computed, for key variables statistical tests will be performed to determine the significance of any remaining nonresponse bias.
While the exact steps that will be taken to implement the above will be specified once survey data become available, we anticipate relying on relevant variables that are available from the sampling frame as well as other ancillary data that may be obtained from external sources. For instance, the sampling frame provided by MSG will append – among others – the following data items on each address:
Delivery Point Type Code
Drop, Seasonal, and Vacant Codes
County FIPS Code
Tract, Block Group, and Block
Latitude
Longitude
Dwelling Type
Walk Sequence
Moreover, the following data items will be available for various subsets of addresses. Presence or absence of these data items, which will be known for both respondents and nonrespondents, will provide a rich source of investigation for nonresponse bias as described earlier.
Phone (Landline)
Head of Household:
Surname
Age
Gender
Race
Ethnicity
Marital Status
Education
Number of Adults
Number of Children
Presence of 18 to 24 Year-Olds
Presence of 25 to 34 Year-Olds
Presence of 35 to 64 Year-Olds
Presence of Over 65 Year-Olds
Household Income
Own Rent Status
Also, from sources such as the American Community Survey we can obtain estimates for passport-relevant attributes, including:
Language
Ancestry
Foreign Born
International Migration
Place of Birth
Year of Entry
Obviously, the above estimates will be available only at higher levels of aggregation and not for individual households; nonetheless, they can provide further insights about key outcome measures of this study – passport demand.
| File Type | application/msword |
| Author | Mansour Fahimi |
| Last Modified By | Mansour |
| File Modified | 2013-04-05 |
| File Created | 2013-04-05 |
© 2026 OMB.report | Privacy Policy