Elwha River baseline monitoring report 2009
ORI_report_7_9_2010.docx
PILOT TEST OF THE ELWHA RIVER DAM REMOVAL AND FLOODPLAIN RESTORATION ECOSYSTEM SERVICE VALUATION PROJECT SURVEY
Elwha River baseline monitoring report 2009
OMB: 0648-0683
Elwha River baseline monitoring report 2009
NOAA - George R. Pess, Martin C. Liermann, John R. McMillan, Keith Denton, Sarah Morley, Todd R. Bennett, Tim J. Beechie, and Polly Hicks
Lower Elwha Klallam Tribe – Mike McHenry, Mel Elofson, and Raymond Moses
USFWS – Roger Peters
USGS – Jeff Duda
Olympic National Park – Sam Brenkman
Washington Department of Fish and Wildlife – Mike Gross and Mara Zimmerman
Prepared for NOAA’s Open Rivers Initiative
TABLE OF CONTENTS
Page
Introduction...............................................................................................................................10
Adult enumeration –
The effectiveness and application of different adult salmonid enumeration methods...13
Juvenile enumeration –
The effectiveness and application of different juvenile salmonid enumeration
methods .........................................................................................................................21
Habitat –
How does spawning habitat quantity and quality vary by habitat type, spatial location, and pre and post dam removal?.....................................................................................32
General recommendations -
What methods might be most appropriate for the Elwha?............................................37
References.................................................................................................................................38
Tables and Figures.....................................................................................................................45
Appendices -
Appendix A: Adult enumeration - Using imaging sonar to count adult Chinook passage into the lower river...........................................................................................87
Appendix B: Juvenile and adult enumeration - An analysis of existing baseline conditions of relative juvenile and adult salmonid distribution and abundance
across the Elwha River..................................................................................................88
Appendix C: Foodweb - Primary and secondary productivity trends.........................100
LIST OF TABLES
Table Page
Table 1. A summary of the available data for Elwha River salmon and steelhead
populations...............................................................................................................................45
Table 2. Correlation of a. Chinook salmon, b. coho salmon, and c. winter steelhead
from 1975 to 2008 for the Elwha, Quillayute, Queets, and Hoh Rivers on the Olympic
Peninsula, Washington State....................................................................................................46
Table 3. A comparison of the different methods for estimating adult escapement for
salmon in the Elwha River. E = excellent, G = good, F = fair, and P = poor for a given
species and method based upon assessment of the method and typical Elwha River
water clarity at a given season.................................................................................................47
Table 4. Estimated annual rates of increase based on the exponential growth phase
of six colonizing populations...................................................................................................48
Table 5. Description of the relative tradeoffs between the different methods commonly
used to enumerate juvenile salmonids in streams, including the conditions under which
each method has low and high efficiency, the important factors to consider regarding
fish injury, spatial coverage and underwater visibility, the length of stream that can be
covered on a daily basis, and the number of people needed to conduct each method.....................................................................................................................................58
Table 6. Description of habitat units sampled during May 2010............................................59
Table 7. Time and sample ability of each unit sample in the Elwha River.............................59
Table 8. Total catch by species, age class and origin (hat=hatchery)......................................61
Table 9. Estimates and 95% confidence intervals for the Chinook 0+, pink and chum out migrants for the Elwha River..................................................................................................62
Table 10. Data collect for habitat quality parameters – residual pool depth and particle size distribution..............................................................................................................................73
Table 11. Distribution of particle size distribution between the middle and lower
Elwha River. Standard error is in parentheses.......................................................................74
Table 12. Average particle size distribution for each riffle crest sampled in the Lower
and Middle Elwha River 2009. Bold indicates that p-value was less than 0.10....................75
APPENDIX TABLES
Table Page
Table B1. Model selection results for factors that affected Rainbow trout abundance
(rainbow trout/km) in the Elwha River basin. Models are ranked from most plausible
(∆AICc=0) to least plausible; p is the number of parameters. The ratio of Akaike
weights (wI/wi) indicates the plausibility of the best fitting model (wI) compared to
other models (wi)....................................................................................................................95
Table B2. Model selection results for factors that affected bull trout abundance
(bull trout/km) in the Elwha River basin. Models are ranked from most plausible
(∆AICc=0) to least plausible; p is the number of parameters. The ratio of Akaike
weights (wI/wi) indicates the plausibility of the best fitting model (wI) compared to
other models (wi)...................................................................................................................96
Table B3. Maximum-likelihood estimates of intercept and slope parameters for the
“best approximating” models predicting rainbow trout and bull trout abundance. a.
rainbow trout total and >10cm & <20cm. b. rainbow trout >20cm & <30cm, >30 &
<40cm, and >40cm. c. bull trout. Standard errors are in parentheses..................................97
Table C1. Ongoing primary and secondary productivity research related to the Elwha
River dam removal..............................................................................................................105
Table C2. Primary and secondary productivity research NOT currently being examined
related to the Elwha River dam removal.............................................................................106
LIST OF FIGURES
Figure Page
Figure 1. Daily upstream counts of adult Chinook salmon in the Elwha River as
determined by SONAR, and redd counts from WDFW surveys. Red boxes indicate
SONAR data that was interpolated from nearby data. Solid black bars indicate daily
upstream movement past the SONAR. Continuous solid black line indicates
cumulative Chinook salmon redd counts................................................................................49
Figure 2. a. Chinook salmon redd locations in the lower Elwha River for 2004
(blue) and 2005 (green)...........................................................................................................50
Figure 3. Locations of winter steelhead redds in the Elwha River in 2010. White dots
indicate 4/1/2010 survey, yellow dots indicate 4/14/2010 survey, Green dots indicate
4/30/2010 survey, and blue dots indicate 5/10/2010 survey...................................................51
Figure 4. A comparison of adult salmon run size trends for four rivers on the Olympic
Peninsula, Washington State for Chinook salmon, coho salmon, and steelhead 1975 to
2008. It is important to note that there are no estimates of coho salmon and steelhead
for the Elwha River.......................................................................................................................................52
Figure 5. Comparison of the standardized and unstandardized Chinook escapement
time series for the Elwha River. Values are logged and centered at zero by subtracting
the mean.................................................................................................................................53
Figure 6. Photo of resistance board weir in the Williamson River, OR, a tributary of
the Klamath River in Oregon and Washington state. Flow is going from right to left,
trap boxes are in the center right foreground and center background of photo.....................54
Figure 7. An example of a simulated standardized time series before and after dam
removal for Chinook salmon the Elwha River. The increasing linear trend on the log
scale translates to an exponential trend in the standard scale................................................55
Figure 8. A power analysis to determine the number of years needed to monitor adult
Chinook salmon in the Elwha River to determine a “significant” increase in
population size due to dam removal. The black region represents the area where
the power to detect a change in population size is greater than 0.8......................................56
Figure 9. Pink, coho, and Chinook salmon population trajectories for six colonization
events across the Western Pacific Rim 1947 to 2010...........................................................57
Figure 10. Conceptual graph of “sample ability index.".......................................................60
Figure 11. Total number of identified by snorkeling or captured by electroshocking or
seining from six units in one side-channel of the Lower Elwha River 2010. Clear boxes
indicate average for each method, while solid bars with hash marks at upper and
lower end indicate the standard error (S.E.) for each method..............................................63
Figure 12. Total number of a. juvenile Chinook salmon, b. juvenile coho salmon, and
c. juvenile rainbow trout/steelhead identified by snorkeling or captured by
electroshocking or seining from six units in one side-channel of the Lower Elwha
River 2010. Clear boxes indicate average for each method, while solid bars with hash
marks at upper and lower end indicate the standard error (S.E.) for each method..............64
Figure 13. Difference in sample ability between snorkeling and the other methods
(either electroshocking or seining) v. % see during snorkel v. the other methods.
The greater the difference in sample ability the greater the degree of difficulty in
using either electroshocking or seining relative to the snorkelability for a given area of stream...................................................................................................................................66
Figure 14. Differences in the size class distribution of a. juvenile Chinook salmon,
b. juvenile coho salmon, and c. juvenile rainbow trout/steelhead captured by
electroshocking and seining from six units in one side-channel of the Lower Elwha
River 2010............................................................................................................................67
Figure 15. Plots illustrating the process of estimating total Chinook 0+ out migrants
for 2009. The top panel shows the catch data in gray, the loess model fit to the data
(the line), and the interpolated values where catch data was missing (black bars).
The middle panel shows efficiency over time, and the bottom panel is the final
estimate of total out migrants...............................................................................................69
Figure 16. Trends in total out migrants for Chinook 0+, pink and chum salmon.
The solid line represents the Elwha estimates and the dashed line the Dungeness River
estimates. For pink salmon the Dungeness estimates were multiplied by the mean of
the Elwha series divided by the mean of the Dungeness series in order to place the values
on a comparable scale (raw Dungeness values are much higher than the Elwha values)..................................................................................................................................70
Figure 17. Total estimated out migrants for 2005-2009, Chinook 0+, chum, and pink
(the species for which efficiency estimates were deemed unreliable)................................71
Figure 18. Total catch for 2005-2009, Chinook 1+, coho 1+, and steelhead (the species
with larger bodied smolts for which efficiency estimates were deemed unreliable)..........72
Figure 19. Conceptual graph of residual pool depth (Maximum depth – tail depth) pre
and post dam removal in the Elwha River. The goal is to capture change in the depth
of pool habitats and the change in streambed size due to the influx of sediment that
occurs with dam removal....................................................................................................76
Figure 20. Percent area spawnable as a function of the percent fraction that is immobile.
Adopted from Wooster et al. 2009. Percent spawnable for pink salmon is
y = -4E-05*%fraction immobile4 + 0.0036*%fraction immobile 3 - 0.1233*%fraction
immobile 3 + 1.3548*%fraction immobile + 94.55. Percent spawnable for Chinook
salmon is y = -2E-05*%fraction immobile4 + 0.0002*%fraction
immobile 3 =0.0281*%fraction immobile 3 - 0.7958*%fraction immobile + 45.10...................................................................................................................................77
Figure 21. Map of residual pool depth and pebble count locations in the a. Lower and
b. Middle Elwha River.......................................................................................................78
Figure 22. a. Trend in stream bed particle size in Middle and Lower Elwha River. b.
Trend in stream bed particle size in the Lower Elwha. D50 = 19.77 (Rkm) + 45.51,
R² = 0.63.c. Trend in stream bed particle size in the Middle Elwha. D50 = 4.88 (Rkm)
+ 61.13, R² = 0.17..............................................................................................................80
Figure 23. Residual pool depth in the Lower and Middle Elwha River............................83
Figure 24. A comparison of residual pool in the Lower Elwha River – 2000 v. 2009......84
Figure 25. Percent fraction immobile by species in the Middle and Lower Elwha
River...................................................................................................................................85
Figure 26. Percent spawnable by species in the Middle and Lower Elwha River.............86
APPENDIX FIGURES
Figure Page
Figure C1. Locations of Elwha and Quinault Rivers foodweb monitoring locations
sampled from 2004-2006 for Morley et al (2006) and Duda et al. (In Press). Blue
circles indicate mainstem sites, red circles indicate side channel sites, and green dots
indicate tributaries...................................................................................................................107
Figure C2. Non-metric multidimensional scaling (nMDS) plots of benthic invertebrate community composition data (√ transformed) collected from MS (filled), SC (open)
and TR (shaded) habitats in LE (triangles), ME (squares), UE (circles) and QU
(diamonds) (from Morley et al. 2008)....................................................................................108
Figure C3. Plots of mean (SD) δ15N (ordinate) and δ13C (abscissa) values for
macroalgae, periphyton, benthic invertebrates, and fish collected above (UE), between
(ME), and below (LE) two dams in the Elwha River during 2005 and 2006 (combined),
(from Duda et al. 2010)......................................................................................................... 109
Introduction
The goal of our initial 2009 baseline monitoring effort in the Elwha river basin was three-fold:
1. Identify, develop, and test biological and physical monitoring protocols to identify a suite of monitoring parameters that are appropriate for use as part of the larger Elwha River dam removal monitoring efforts, as well as other dam removal efforts.
2. Collect data in the Elwha River basin, and other basins where appropriate, to establish baseline ecosystem conditions and track regional trends that could confound the response of salmon to dam removal in the Elwha River.
3. Develop and attempt to establish a database for use by the numerous co-managers working on the Elwha River dam removal project.
To attain these goals we identified five general questions (see below) that improve the focus of our monitoring goals (Table 1). The questions cannot be answered with one year of baseline monitoring data because the focus of each one requires pre and post dam monitoring efforts. Nonetheless, they are important because they help identify the types of spatial and temporal data needed to begin answering the overarching question of project effectiveness. Answers to the questions will also help identify the parameters and techniques that are most directly applicable to assessing project effectiveness.
The general parameters we identified as priorities for the first year of funding included adult salmon abundance and distribution, juvenile salmon abundance and distribution, and several individual habitat variables including residual pool depth, streambed particle size, and stream temperature. The techniques to enumerate each of these parameters included the following:
Adult enumeration – fish weir, SONAR, visual counts
Juvenile enumeration – snorkel surveys, electroshocking, seining, smolt trap
Habitat enumeration – quantification of individual habitat metrics using measured survey data
We were able to accomplish the following related to the five questions:
What is the trend in spawner abundance?
Collate existing adult salmon data in the Elwha to identify data gaps and degree to which adult salmon populations in the Elwha track with nearby rivers.
Compare different techniques for enumerating Elwha populations that are currently counted (Chinook and winter steelhead), and assess potential techniques for species which are not currently counted.
Combine the available population data with population growth rates observed in other colonizing populations to estimate the number of years that would be necessary before a population recovery would likely be detected.
What is the trend in spawner spatial distribution below and above historic dam sites? How does is vary by habitat type?
Spatially explicit identification of spawner survey locations for steelhead in the Lower Elwha River using visual counts over the course of the spawning season.
Identification and quantification of potential spawning locations in the Lower and Middle Elwha River using simple, repeatable methods that are applicable to other dam removal locations.
What is the trend in juvenile abundance by species? What is the trend in juvenile spatial distribution by species?
First, we conducted a literature review to compare the relative tradeoffs between different methods commonly used to enumerate juvenile salmonids in streams, including the conditions under which each method has low and high efficiency, the important factors to consider regarding fish injury, spatial coverage and underwater visibility, the length of stream that can be covered on a daily basis, and the number of people needed to conduct each method.
Second, we initiated but have not completed a comparison of several methods including electroshocking, snorkeling, and seining in order to effectively calculate trends in juvenile abundance and distribution by species. We initially found that each method is capable of effectively estimating presence/absence and species diversity across a wide range of habitat conditions. However, snorkeling identified the largest number of fish and the greatest diversity of fish size-classes. Based on the literature review and our initial results, multi-pass electrofishing and seining seem to be most appropriate for surveying short sections of smaller streams with shallow, minimally complex habitat and a diverse population assemblage. Seining is most effective of all methods when visibility is poor. We hypothesize that these methods, if calibrated for efficiency biases such as roughness and instream cover, can effectively and efficiently survey a wide array of streams and fish populations. We will collect additional data in 2010 and 2011 to further answer this hypothesis.
What is the trend in smolts to adults by species?
Trend analysis of the estimated number of smolts from 2005 to 2009 for each indicates there is substantial variability in timing, and total numbers between year and species. Some of this is likely due to different periods of operation and other across year differences in trap operation.
Dam removal will likely affect the trap operation. During the period of high turbidity immediately after the dam removal, the trap efficiency will likely change. Also, the input of large amounts of sediment and wood may substantially change the current trap site requiring the location of another site.
Estimates of smolt production could be improved by modifying the trap or site, or moving the trap to increase efficiency, and increasing or modifying the releases for estimating trap efficiency.
How does habitat condition vary by habitat types, spatial location, and pre and post dam removal?
We found that two parameters -- streambed particle size and residual habitat depth -- are key components of spawning habitat quality and can be easily measured when a known influx of sediment will occur with dam removal.
In the Elwha River we found that streambed particle size decreases in a downstream direction below each of the dams, and decreases considerably in the lower 2km of the river before entering the Strait of Juan de Fuca. The decreasing trend in particle size is greater in the Lower Elwha than the Middle Elwha. Residual pool depth increased in the downstream direction, however, residual pool depth did decrease in the lowest portion of the Lower Elwha. Spatially, residual pool depths were significantly different between the Middle and Lower Elwha, but temporally for the same pools, there was not a significant difference in residual depth between years.
Predicted percent spawnable area varied by species but was greatest in the Lower Elwha, particularly in the lowest portion of the Elwha below Rkm 2.5. The probability of occurrence of a site having spawnable area was greater for Chinook salmon than pink salmon because Chinook can move larger substrate, but at a given site there was typically a larger predicted percent spawnable area for pink salmon relative to Chinook salmon because the largest spawning areas were dominated by relatively small substrate.
Adult enumeration – The effectiveness and application of different adult salmonid enumeration methods
Introduction
Restoring healthy runs of native salmon to the Elwha river is one goal of the Elwha River Ecosystem and Fisheries Restoration Act (1992). While trends in juvenile and smolt abundance will be important, recovery will ultimately be judged on the abundance and diversity of returning adult salmon, trout, and char. This raises several questions related to the Elwha River dam removal: What is the trend in adult salmon spawner abundance? What is the spawner spatial distribution below and above historic dam sites? How does this vary by habitat type?
Enumerating adult salmon to evaluate these questions will require accurate estimates of returning adults and reference or “control” adult salmon populations to reduce the likelihood of confusing trends in abundance that are related to dam removal with other non-dam removal factors, such as ocean conditions. Fortunately, adult salmon data is available for a number of regional rivers, which allows for comparison to trends in the Elwha River salmonids within the context of larger influences. Five species of Pacific salmon and steelhead currently inhabit the Elwha River. However, reliable data is only available for Chinook salmon and to a lesser degree winter steelhead and coho salmon. Surveys for these and other species are complicated by turbid water conditions. In addition, once the dams are removed current enumeration methods based on walking and floating the river will require a large increase in effort. Effective monitoring of population abundance over time is therefore dependent on the development of a suite of metrics and methods for enumerating adults.
Our objectives for enumerating and analyzing adult salmon returns are:
1. Collect existing adult data: Collate existing data for salmon populations in the Elwha and other area rivers to identify data gaps and assess the degree to which populations from different rivers track with each other.
2. Assess enumeration techniques: Compare different techniques for enumerating Elwha populations that are currently counted (Chinook and winter steelhead), and assess potential techniques for species which are not currently counted
3. Implement power analysis: Combine the available population data with population growth rates observed in other colonizing populations to estimate the number of years that would be necessary before a population recovery would likely be detected.
Data
Existing data - Elwha River
Chinook salmon is the only species for which a long term adult data set is available in the Elwha River (Table 1). While sporadic sampling has occurred for other species (Table 1), turbidity and high flows have generally precluded visual surveys of redds and adults. Chinook in the Elwha River are enumerated by the Washington Department of Fish and Wildlife (WDFW) and the Lower Elwha Klallam Tribe (LEKT) with redd counts between mid-August and mid-October. WDFW personnel float from Elwha dam (RKM 8) down to the Hunt’s road channel (RKM 3), while the LEKT conducts foot surveys to enumerate Chinook salmon redds in the Hunt’s road channel. For 2009 and 2010, Chinook salmon have also been enumerated using imaging sonar in the lower river (for detailed information see Appendix A). Continuous imagery of passing fish is analyzed to produce independent estimates of adults passing the site (Figure 1). In addition to count data, over the last several years, the GPS locations of Chinook salmon redds have been recorded (Figure 2).
Minimal information is generally available for other species. Winter Steelhead redds have been counted by the LEKT in three index reaches since 2005. However, these data have not yet been used to produce escapement estimates. In 2010 NOAA personnel conducted independent redd surveys, recording redd numbers and locations while floating from RKM 6 to RKM 1 (Figure 3). Data on chum escapement in the Elwha is available from 1993 and 1994 when the USFWS conducted live counts in conjunction with a mark recapture study. In addition, some pink salmon observations were recorded during snorkel surveys for Chinook salmon in 2009.
Existing data - Nearby regional rivers
We examined Chinook salmon, coho salmon, and steelhead populations from three Olympic Peninsula rivers (the Hoh, Queets and Quillayute rivers) to compare their trends in abundance with those of the Elwha River salmon (Figure 4). According to the data, Chinook and coho salmon populations displayed similar temporal trends as the Elwha River Chinook and coho (Figure 4) leading to relatively high correlations (Tables 2a & 2b). However, it is important to note that with the exception of the Elwha, Chinook salmon population run size estimates represent terminal run size (i.e. the total size of the population including those harvested) produced by WDFW using visual surveys and estimates of catch. For the Elwha Chinook salmon population run size represents escapement, or those Chinook salmon that have returned which were not harvested. That could have influenced the results in some way. Unlike Chinook and coho, winter steelhead populations did not track as well and had only low correlations (Figure 4 and Table 2c).
To account for regional trends in Elwha Chinook data we divided the time series by the geometric mean of the other three populations at each time period. This standardized the data because natural variation that affects each spawning population was accounted for, and thus dramatically reduced evidence of a downward trend (Figure 5).
Data gaps – Elwha River
There is little or no adult data available for Elwha populations of summer steelhead, coho salmon, chum salmon, sockeye salmon, and pink salmon (Table 1). The bulk of these runs enter the river during late fall and winter when high flow and turbidity often preclude visual surveys. Increased turbidity predicted in the middle and lower river post dam removal will exacerbate this problem.
Methods
Here we describe and compare three different methods that will be used to enumerate adult salmonids in the Elwha River (visual methods, counting weirs, and imaging sonar) (Table 3).
Visual Methods
This method refers to periodic counts of observable fish and/or visible redds over the course of a species specific spawning season. These are generally obtained through aerial or ground surveys, although boat and snorkeling surveys can provide similar data. When whole streams cannot be surveyed, which is usually the case, various sampling designs are incorporated, including simple random sampling (Irvine et al. 1992) where all sections of a stream have equal probability of being selected; stratified random sampling (Cochran 1977) where the stream is divided into homogenous units and then randomly sampled; and stratified index sampling (Bocking et al. 1988) where sites within each stratified unit are chosen based on factors such as ease of access or high probability of holding fish.
Analysis of the count data is generally done by plotting the number of fish observed against the day of the year and then “the area under the curve” is calculated using a variety of algorithms (Hilborn et al. 1999). By dividing this "area under the curve" by an estimate of the stream life of an individual fish or redd, a total spawning population size can be determined. Various forms of this method are widely used to estimate escapement in Oregon, Washington, Alaska, and Canada (e.g. Ames and Phinny 1977, English et al. 1992, and Bue et al. 1998). Surveys are generally done every 7-10 days, however, the degree of uncertainty increases with the number of days between surveys (Hill 1997, Bue et. al. 1998). Stream life of individual fish is often derived from tagging studies (English et al. 1992). An estimate of observer error is also necessary to estimate variability and is often obtained from data collected at counting weirs (Shardlow et al. 1987; Bue et al. 1998). Ultimately, algorithms are applied to the area under the curve to estimate escapement, but there are limitations because uncertainty is not accounted for in the area under the curve, stream life, and observer efficiency. To remedy this, Hilborn et al. (1999) devised a more universal, maximum likelihood estimator that provides for uncertainty in model inputs, thus producing a less-biased escapement estimate.
Fish Weirs
Various types of weirs and counting fences are used to enumerate the upstream passage of adult salmon in streams and rivers. Resistance board weirs, probably the most widely used type of weir, consist of three basic parts: the substrate rail, panels which are attached to the substrate rail, and a trap box for capturing the fish (Tobin 1994) (Figure 6). The substrate rail is a series of iron rails attached to the bottom of the river, crossing the entire width of the river and aligned perpendicular to the river flow. The panels are generally fabricated from 20 foot lengths of 1 inch diameter PVC tubing spaced 1 inch apart. Each panel is approximately 3 feet wide with the upstream end attached to the substrate rail by a series of hooks which clasp on to a wire which is run along the top of the substrate rail. A “resistance” board is attached to the downstream end of each panel so the current keeps it afloat. When operational, the upstream end of each panel is anchored to the stream bottom by the substrate rail, while the downstream end is kept afloat by the resistance board, creating a channel spanning fence that adult fish cannot pass though. The trap box is simply an aluminum box approximately 6ft. x 6ft. x 6ft. located adjacent to the bank of the river that the fish are forced to enter because they cannot fit through the PVC panels. Fish can then be identified, counted and released to continue their upstream migration. Weirs also offer an ideal point to mark fish with different types of tags for use in mark recapture and radio-telemetry studies.
A collaboration of NOAA/NWFSC, United States Geological Survey, The National Park Service, United States Fish and Wildlife Service, WDFW and the LEKT have completed construction of a resistance board weir and secured funding for the next year of its operation. The weir will be installed at RKM 6 during the summer of 2010 and operate when flows are predictably below 2000 cfs, or roughly between mid April and mid October.
SONAR
Single beam sonar systems have been used to enumerate fish migration in rivers since the early 1960’s, and similar technology is still being used today to measure escapement in a number of fisheries in Alaska (Westerman and Willette 2003; Dunbar and Pfisterer 2004; Dunbar 2001, 2003; McKinley 2002). More recent sonar technology has greatly improved counting accuracy by incorporating multiple high frequency beams, producing “movie” quality images while also providing detailed data on several other fish characteristics including direction of travel, range, length, and swimming speed (Belcher et al. 2001, 2002). The primary imaging sonar currently used for salmon escapement estimation is the Dual-frequency IDentification SONar (DIDSON) produced by Soundmetrics, although BlueView Technologies makes a comparable imaging SONAR. Successful enumeration of adult salmon with imaging SONAR depends critically on locating a suitable site. Important site characteristics include: 1) a method to differentiate species if migration periods overlap; 2) the ability to ensonify an entire transect of the river, or at least a known portion of it; and 3) directed fish movement of fish through the ensonfied area without milling (Banneheka et al. 1995).
Results
A comparison of methods
The different methods of enumerating adult salmon we have reviewed all have tradeoffs, but each are appropriate for enumerating the different species and stream conditions encountered in the Elwha River (Table 3). Of the three methods considered here, SONAR is the only method that could potentially produce adult counts for all species. However, there are limitations. First, the method is untested during winter conditions in a river the size of the Elwha. To this end, we will assess the feasibility of operating the SONAR during periods of high flow during the upcoming winter. Second, reading and interpreting the raw SONAR data is very time consumptive. For example, 24 hours of SONAR data would require 24 hours of processing time to produce raw counts, although significant subsampling is possible (Lija et al. 2008).
The weir will operate over a protracted period (i.e. August through October, portions of the spring prior to snowmelt) and will be relatively unaffected by turbidity, which limits visual surveys. Further, estimates should be very accurate and it allows for fish handling, which provides opportunities for measurement, tagging, and exclusion of selected groups of fish. The weir also provides an opportunity, when in operation, to calibrate SONAR counts.
Visual surveys of redds and adults on the spawning grounds offer a relatively inexpensive means of measuring the spatial coverage of fish and if calibrated, estimating adult abundance (Figures 2 and 3). Such surveys are currently used by WDFW to estimate salmon escapements throughout the state and will likely continued to be used in the foreseeable future. Of course, visual surveys are most affected by visibility; consequently, applicability is limited to narrow windows of low stream flow and turbidity. In general, these conditions are reliably met only between late July after snowmelt and before the fall rains in mid October. Additional opportunities sometimes present themselves during perhaps a couple of week long periods from January through mid April when cold weather brings flows down and the river clears. These time periods make redd surveys and snorkeling viable only for Chinook salmon and, to a certain extent, winter steelhead, the two species for which these methods are already being used.
Finally, the relative efficacy of the different methods will be different before, during, and after dam removal. Most notably, visual counts will be particularly difficult during and immediately after dam removal due to turbidity, and visual methods post dam removal will require a substantial increase in effort given the drastic increase in potential spawning area. Theoretically, sonar and weir operation should not be affected by increased turbidity, but neither has been tested in the range that is likely to be experienced during dam removal.
In conclusion, visual estimates are the least robust of the three methods, but are probably the most cost effective and will continue to be undertaken by WDFW. The weir and sonar can be effective at monitoring the complete spectrum of salmon runs on the Elwha if deployed in a complimentary fashion. The weir is capable of collecting migrating salmon for counting, tagging, etc. during low and medium flows, while the sonar can be used for counting during high flows when the weir is not in operation.
A comparison of the 2008 SONAR data with the 2008 WDFW redd count estimates indicated that the SONAR run size estimate of 2700 fish was more than twice WDFW's estimate of 1200 fish (Denton and Liermann 2009). However, SONAR data and redd surveys did agree on the general run timing of the summer Chinook population in 2008. Soon after the peak of the fish passage was recorded by the SONAR equipment, WDFW redd surveys also peaked, indicating that Chinook began to spawn shortly after passing the SONAR site (Figure 1).
How long will it take to detect an increase in adults?
One primary indicator of restoration success for the Elwha dam removals will be an increase in salmon population sizes. In addition to smolt and juvenile salmonid counts, adult salmon returns will provide an estimate of population trends. However, natural fluctuations in the environment often lead to substantial variability in population size, which can make detection of temporal patterns difficult (e.g. Korman and Higgins 1997). In addition natural trends can easily be misinterpreted when not compared to suitable reference populations. Here we implement a simple power analysis to provide some indication of how many years of data will be necessary to confidently say that adult returns are increasing. For this analysis we focus on Chinook salmon. However, this approach should be applicable to other species for which adult counts are obtained. The power analysis is based on simulation where a model produces thousands of time trends for a given effect size, and a test for change in trend (before-after) is then applied to each simulation. The proportion of simulated series for which the test rejects is the approximate power.
The lower river population up until 2009 is assigned the observed standardized population estimates, which are calculated by dividing the Elwha series by the geometric mean of the Quillayute, Queets, and Hoh series (for each year). For 2010 on, the series is projected forward based on the linear model fit to the log series. The upper population is seeded with 5% of the lower population (strays) and allowed to grow exponentially (with yearly variability). Population growth does not begin until 4 years after the first cohort could colonize the upper river (2012 + 4 = 2016). The exponential rate of growth is the effect size used in the analysis. There are a myriad of complexities that will likely shape the population trend post dam removal that we cannot include because we are unsure how the lower river population will be affected by dam removal and the proportion of returning fish that will migrate upstream past the old dam locations. Accordingly, we rely on a simple set of assumptions and emphasize that the results must be interpreted based on these assumptions.
The test compares two models, a simple linear fit to the trajectory and a broken stick model, where the slope is allowed to differ before and after dam removal (Figure 7). Both models are applied to log values. There are no obvious non-linear trends in the standardized historical data (Figure 7, for years < 2010) suggesting the linear assumption may be sufficient for the purposes of this exercise.
For each combination of effect size and sample size (years), 1000 simulated time-series were created based on the description above. The power for each combination was then estimated as the proportion of simulations for which the test rejected. As expected, the probability of detecting a trend in a given period of time depends critically on the rate of population growth (Figure 8). Detecting an annual rate of growth of 10% in the upper river would require more than 20 years of monitoring while a 30% growth rate would likely be detectable in less than 10 years. Again, these results are dependent on the model assumptions used for the simulations.
To provide context for these results, we examined population trajectories for various colonizations (Figure 9). We found that annual growth rates varied from 10% to 100% (1.1 to 2.0) (Table 4). Given the general condition of regional Chinook populations and the longer generation time, we might expect the rate of growth to fall towards the lower end of this range. Also, simple exponential growth rate does not sufficiently capture the complexity of possible population trajectories as new habitat becomes accessible. For example, both the Glacier Bay and South Fork Skykomish River Pink populations remained at very low levels for an extended period of time before making substantive gains (Figure 9).
Discussion
Recommendations of protocol and pre-dam conclusions
A relatively robust data set exists for adult salmon from other rivers in the same region as the Elwha. On the other hand, data for adult salmon in the Elwha River is rather lacking. Nevertheless, long term estimates do exist for Chinook salmon and on a shorter time scale for winter steelhead. In order to accurately gauge the effect of dam removal on adult salmon production it is essential that we not only maintain the current adult salmon enumeration activities on the Elwha, but make them more robust and expand them to other species.
The bulk of the information that currently exists on adult salmon populations in the Elwha River have been derived from redd surveys. While this method is used extensively and has been demonstrated to provide accurate estimates for salmonids (Gallagher and Gallagher 2005, Mulfield et al. 2006), due to limited visibility during much of the year, it is impractical for three of the five species of salmon and steelhead. In addition, visibility during and immediately after dam removal will almost certainly be worse, and access to the expansive upper watershed will be difficult. We therefore recommend augmenting visual surveys with alternate enumeration methods such as the weir and imaging SONAR. While neither of these methods has been tested across seasons in the Elwha, they have been effectively used at other sites (e.g. Holmes et. al. 2006, Hoffnaglle et al. 2008). In addition the weir and sonar have the potential to be complimentary. When the weir is installed in the summer or fall of this year we will assess the feasibility of affixing different imaging SONARs to the weir to obtain fish counts. For periods when both the weir and sonar are operating we will be able to validate the species specific sonar. When high flows preclude operating the weir for large periods of time from late fall to spring, the sonar can used to estimate passage past the site. Higher flows will still pose a challenge for the SONAR, reducing image quality, increasing the cross river distance, and exposing the hardware to damage from debris. However, other options are limited, and the weir infrastructure that will remain in the river throughout the year should provide a number of good options for affixing the sonar. While species identification in the sonar imagery is not as easy as visual methods, there are a number of characteristics that can be used for differentiation. Fish length, behavior, and time past the sonar can all be used to parameterize models for assigning species. We are currently developing a mixture model and testing it on SONAR imagery from another local river. The mixture modeling approach has been successful in other SONAR applications (Fleischman and Burwen 2003).
Regardless of how adult counts are obtained, detecting an increasing trend in adult numbers in response to dam removal will require some time and may be complicated by other environmental factors, such as ocean conditions. These environmental signals also form trends (e.g. decadal scale oscillations), which makes discerning trends in recovery from environmental trends challenging. Fortunately, two local populations (Chinook and coho in the Hoh, Quillayute, and Queets Rivers) all track the Elwha population well. This provides a reference with which Elwha trends can be interpreted. Based on a preliminary power analysis for summer Chinook salmon in the Elwha River, we estimate that detecting an increasing trend could require from several years to over 30 years depending on the rate of population growth in the upper river.
Juvenile enumeration - The effectiveness and application of different juvenile salmonid enumeration methods
Monitoring juvenile salmonids in the Elwha River basin is important for assessing the recolonization of anadromous salmonids after dam removal. The main question for juvenile salmon in the Elwha River is what is the temporal and spatial distribution trend in juvenile abundance by species? Our monitoring objectives focus on five juvenile salmonid metrics, including presence/absence, species diversity, abundance, and distribution (McHenry and Pess 2008). Observing and counting juveniles to generate these metrics will be challenging for two reasons. First, stream conditions are highly variable in the mainstem Elwha River and its tributaries, and after dam removal pulses of sediment stored behind the dams are expected to further decrease already limited visibility in the mainstem Elwha River (McHenry and Pess 2008). Second, the expected rare and/or patchy distribution of salmonids during the initial stages of recolonization will require methods that are effective for intensive sampling of discrete areas and continuous sampling of long stretches of stream. Accomplishing our quantitative objectives will thus require utilizing a suite of enumeration methods to account for the environmental and biological variability.
Several methods have been developed for enumerating juvenile salmonids in freshwater stream habitats. Methods we could use include backpack electrofishing (hereafter referred to as 'electrofishing': Rosenberger and Dunham 2005), snorkeling (Hankin and Reeves 1988) and seining (Gries and Letcher 2002). Each method is capable of generating all of the juvenile metrics. However, there are differences in their effectiveness (e.g., accuracy and bias of the fish counts) and physical constraints. For example, electrofishing can be used when stream visibility is poor (Reynolds 1996), and it can be a more accurate method for estimating juvenile abundance because there is less species-specific bias relative to snorkeling (Rogers et al. 1992). However, its effectiveness decreases with increasing stream size and levels of instream cover (Peterson et al. 2004; Rosenberger and Dunham 2005), it is time consuming and inefficient over long stretches of stream (Hankin and Reeves 1988) and can cause injuries to juvenile salmonids (Nielsen 1998). In contrast, snorkeling is an effective alternative to electrofishing in small and large streams, it minimizes impacts to fish, and allows for the efficient coverage of extensive lengths of stream (Thurow 1994). Nonetheless, snorkel counts are limited to times and places with good water clarity (Thurow 1994), the counts can be less accurate in some situations (Rogers et al. 1992), and observer biases can be high (Hankin and Reeves 1988).
Here we first review the factors influencing the effectiveness of each method and how to compensate for different biases. This will allow us to identify the most reliable methods for enumerating juvenile salmonids in differing physical and biological conditions. Next, we compared snorkeling, electroshocking, and seining in one side channel of the Lower Elwha River as a pilot project to quantify the ability of each method to enumerate juvenile salmonids. Our goal is again to apply monitoring techniques consistently pre and post dam removal because changing techniques may confound evaluation of the effects of the dam removal. Thus collecting information that will help us validate different techniques juvenile salmon abundance techniques will be critical in our evaluation of fish response. Lastly we analyze and discuss smolt enumeration in the Elwha River and provide estimates of fresh water production (i.e. number of smolts per number of spawners) over time. Smolt outmigration data will help to answer one of the main questions we pose in our Elwha River monitoring effort – what is the trend in smolts to adults by species?
A comparison of electroshocking, snorkeling, and seining through literature review
Electrofishing
Electrofishing is one of the most widely used methods for enumerating fish (Reynolds 1996). Its effectiveness is defined in terms of capture efficiency: the probability of capturing an individual fish (Peterson et al. 2004). Capture efficiencies for stream-dwelling juvenile salmonids can range from 25% - 100% (Riley and Fausch 1992; Kruse et al. 1998; Peterson et al. 2004) and is influenced by four major factors. First, capture efficiency decreases at low stream conductivity levels (< 20 μS/cm), essentially eliminating electrofishing as an option, and can be harmful to fish at higher levels (350 μS/cm: Reynolds 1996). Second, capture efficiencies decrease with increasing stream size and levels of instream wood or boulders because fish using cover are less likely to be captured than those that are not using cover. This can lead to underestimations of the population size due to overestimated capture efficiency (Rodgers et al. 1992; Rosenberger and Dunham 2005). Third, the efficiency is often higher with larger fish and lesser with smaller fish (Peterson et al. 2004; Korman et al. 2002). Lastly, particular species are more susceptible to being captured than other species because of behavioral differences (e.g., bull trout are more difficult to catch because they often hide in the substrate: Peterson et al. 2004; Peterson et al. 2005).
Electrofishing biases can be accounted for in different ways. If the goal is to estimate abundance or population size, biases can be reduced to some degree by increasing the number of passes made with an electrofisher (Rosenberger and Dunham 2005). Biases can also be reduced by modeling capture efficiency as a function of different levels of effort, stream width, substrate size, and levels of instream wood or cutbanks (Peterson et al. 2004; Rosenberger and Dunham 2005). Such models can calibrate statistical estimates and narrow confidence intervals. If calibration is not possible, then mark-recapture is perhaps the best way to compensate for stream complexity (Rodgers et al. 1992; Rosenberger and Dunham 2005). Accounting for differences in fish is more challenging, and it may not be possible to compensate for efficiency differences related to fish size and species (Peterson et al. 2004). However, if the interest is only in describing species composition then single- pass electrofishing may be adequate (Reid et al. 2009) as long as the lengths of sampling sections increases proportionally with increasing stream size (Cao et al. 2001). Single-pass electrofishing may even be able to provide reasonable estimates of abundance if cover is sparse (Kruse et al. 1998). These results indicate that statistical and physical means of compensating for electrofishing biases are effective up to a particular stream size (~ 15 - 20 m wetted width), beyond which electrofishing becomes less reliable. Without accounting for the effects of physical habitat on capture efficiency, systematic errors may be induced that limit the reliability of the data (Peterson et al. 2004).
Snorkeling
Snorkel effectiveness is measured in terms of observer error, which is due to variation from direct over- or under-counting of target species (Hankin and Reeves 1988). Because underwater counts can include multiple snorkelers, there is also inter-observer error, which is the variation in fish counts between two or more snorkelers (Thurow 1994). Like electrofishing, the ability of a diver(s) to accurately and precisely count juvenile salmonids is influenced by a range of factors.
Because snorkeling is visual, the most important factor influencing observer error is underwater visibility, but stream depth and water temperature also play critical roles (Thurow 1994). For example, James and Baxter (2005) found that visibility explained 62% of the variation in their rainbow trout estimates. Additionally, snorkel surveys are generally ineffective at water depths < 0.3 m because divers are unable to fully immerse their mask (Thurow 1994). Further, drastic undercounting of juvenile salmonids often occurs when water temperatures drop below 9°C - 10°C because they seek cover and become nocturnal (Roni and Fayram 2000), although one study reported night counts of larger-sized trout being greater at night than during the day in the summer when temperatures were relatively optimal (Grost and Prendergast 1999). The abundance and species of fish are also important. Hillman et al. (1992) found that over 90% of juvenile salmon were counted and identified correctly in clusters of fewer than 40 fish, but coho and Chinook salmon were undercounted by 50% or more if they resided in mixed groups of more than 40 fish. Among species, juvenile steelhead (Rodgers et al. 1992) and bull trout (Thurow et al. 2006) can be more difficult to count than other species because they tend to flee from the diver rather than approach like juvenile salmon. Lastly, and unrelated to environment, adequate training is necessary to ensure snorkelers are accurate and efficient at identifying and counting target species (Thompson and Mapstone 1997).
A variety of guidelines exist to reduce the biases in observer error if the objective is to estimate relative abundance, distribution, or presence/absence. First, in wadeable sized streams (up to 15 - 20 m bankfull width) the diver should be able to see bank-to-bank and avoid trying to survey shallow water areas less than 0.3 m in depth (Thurow 1994). In larger rivers (> 20 m wetted width) underwater visibility should be at least 3 - 4 m with multiple divers spaced evenly across the river according to the extent of visibility (Schill and Griffith 1984; Thurow 1994). Accounting for complex cover and species that flee from the diver, such as juvenile steelhead, can be done with bounded counts, which consists of three successive but separate counts of the same habitat unit (Hankin 1984) or by calibrating single-pass counts with electrofishing (Hankin and Reeves 1988). The counts quantify variance in observer error and can provide confidence intervals for abundance estimates. Mark-resight can also be used in challenging environments to quantify variance and to generate confidence intervals for population estimates (Young and Hayes 2001; Korman et al. 2002). At minimum, some level of calibration for complex cover seems warranted and block nets may be required if fish consistently flee (Thurow et al. 2006). Finally, snorkel surveys must be conducted at night when water temperatures are below 10°C to compensate for changes in fish behavior (Roni and Fayram 2000).
Seining
Seining effectiveness is measured in terms of capture efficiency, which is defined as the product of encirclement efficiency when laying the net and retention efficiency while hauling in the net (Bayely and Herendeen 2000). Unlike electrofishing and snorkeling I found relatively little information on the effectiveness of seining for generating juvenile salmonid abundance and population metrics in streams. The literature that is available suggests that seining capture efficiency is affected by most of the factors that influence electrofishing, except for visibility. For example, stream sites with irregular bottom topography, fast currents and deep water, significant accumulations of debris or larger rocks, or dense stands of aquatic vegetation may not be suitable for seining due to net snagging or lifting and reduced fish retention (Hahn et al. 2002). However, seining is also effective when stream visibility is poor, while electrofishing and snorkeling are not. Net design can also influence capture efficiency. Fish behavior and species can also influence capture efficiency. Species that associate with the bottom (epibenthic) and with complex habitat (vegetation, rocks, wood) are generally more difficult to capture with seines than are fish that are pelagic or epipelagic (Murphy and Willis 1996) and seining may have to be conducted at night if fish become nocturnal (Gries and Letcher 2002).
It is possible to compensate for some, but not all, of the factors that limit seining capture efficiency. For example, without modifying stream habitat, the capture efficiency of seining will suffer in places with complex cover and greater depths (Hahn et al. 2002). Consequently, it may not be possible to generate estimates of relative abundance or population size in such circumstances (Rozas and Minello 1997; Bayely and Herendeen 2000). This is one reason why seining is more common in saltwater and lake environments where smooth bottom beaches and lack of instream cover do not snag or impede the seine (Murphy and Willis 1996). Slight compensation for complex cover can be made by conducting multiple passes with the seine, having a snorkeler observe sein and fish action, and/or modifying instream habitat (Hahn et al. 2002). While limited, in the appropriate places a single seine haul can be an effective estimator of species richness (diversity index), species rank, and the size distribution (Hayes et al. 1996). If water temperatures are cold and fish are nocturnal, seining must be conducted at night (Gries and Letcher 2002). If fish are associated with substrate or particularly spooky, then the speed of the seining activity can be increased (Hahn et al. 2002).
Results from the literature
Several studies have compared the relative effectiveness of electrofishing and snorkeling for enumerating juvenile salmonids in freshwater streams (e.g., Hankin and Reeves 1988; Rodgers et Hayes, 2001), while fewer studies have done the same for electrofishing, snorkeling, and seining (e.g., Gries and Letcher 2002; Esin 2009). The results of those studies combined with this review suggest that each method has different tradeoffs and applications for enumerating juvenile salmonids. Here I briefly delineate the applicability of each method for achieving different quantitative objectives.
Each of the three methods is adequate for determining presence/absence and estimating species composition. Among them, snorkeling seems to offer the best balance of effectiveness and efficiency because it does not cause injury to fish, is relatively cheap, uses a smaller crew of people, and it allows people to cover 1 - 2 km of stream per day, which is a substantially greater length of stream than can be covered on a daily basis with electrofishing or seining (Table 5: Hankin and Reeves 1988; Dolloff et al. 1996). However, if there is a need to capture or accurately measure fish as part of the objective, electrofishing or seining would be the only choices (Reynolds 1996; Hahn et al. 2002).
If the goal is to quantify population size then mark-recapture electrofishing (Roseberger and Dunham 2005), mark-resight snorkeling (Young and Hayes 2001), snorkel counts calibrated with electrofishing (Hankin and Reeves 1988), and mark-recapture seining may all be used. On the other hand, there are a number of tradeoffs to consider when choosing a method to estimate relative abundance. We begin with tradeoffs related to stream size, cover, visibility, and spatial coverage. Day (Hankin and Reeves 1988; Hillman et al. 1992) and night snorkel surveys (Roni and Fayram 2000), and seining (Esin 2009) can be equally effective as multi-pass electrofishing for estimating relative abundance and population size for juvenile salmonids (Table 5). Considering this, multi-pass electrofishing (Reynolds 1996) and seining (Hahn et al. 2002) are applicable to covering short distances of stream per day (< 0.5 km) in smaller-sized streams (< 15 m wetted width) with minimal cover and relatively shallow depths (< 1 m). They are also the only alternatives when underwater visibility is limited. On the other hand, snorkeling is applicable across a broader range of stream-sizes and depths and allows for greater spatial coverage, but can be ineffective in particularly shallow streams (< 0.3m) with large substrate (Hankin and Reeves 1988; Thurow 1994; Dolloff et al. 1996).
The applicability of different methods for estimating abundance can also be influenced by fish size and species (Table 5). For example, although there does not appear to be a species-specific bias with electrofishing, the method can be more effective for larger juveniles (> 50 - 60 mm: Peterson et al. 2004; Korman et al. 2009). Seining can be ineffective for sampling benthic-oriented species (Jordan et al. 2008) and may miss smaller juveniles (< 60 mm length) (Gries and Letcher 2002). Outside of those effects, there does not appear to be a direct species-specific bias with electrofishing (Rodgers et al. 1992) or seining (Esin 2009), but it is possible that differences in behavior (e.g., hiding in substrate) can result in species-specific biases (Peterson et al. 2004). In contrast with electrofishing, snorkeling may result in underestimation of smaller fish (Joyce and Hubert 2003) that rely on shallow channel margins. There may also be species differences in effectiveness. While studies have found that snorkeling can effectively count juvenile steelhead and cutthroat (Hankin and Reeves 1988; Roni and Fayram 2000; Joyce and Hubert 2003), a study in Oregon found that snorkeling was a poor method for counting juvenile steelhead because those fish tended to flee from the diver (Rodgers et al. 1992).
Recommendations of protocol and pre-dam conclusions
Overall, the combined considerations of stream habitat and fish size and species suggest there are four different patterns of applicability for electrofishing, snorkeling, and seining from the literarure.
1. First, each method is capable of effectively estimating presence/absence and species diversity across a wide range of conditions.
2. Second, electrofishing and seining are the only options when underwater visibility is poor, but if turbidity is too high, seining is the only option.
3. Third, if the objective is to enumerate fish over long stretches of small to large streams with deeper, more complex habitat to identify associations between a few species and river habitat the reach or section scale, snorkeling provides the best balance of effectiveness and efficiency.
4. Fourth, multi-pass electrofishing is most appropriate for surveying short sections of small streams with shallow, minimally complex habitat and a diverse population assemblage.
5. These methods, if calibrated for efficiency biases such as instream cover, can effectively and efficiently survey a wide array of streams and fish populations.
A comparison of electroshocking, snorkeling, and seining in the Elwha River
Methods
We compared snorkeling, electroshocking, and seining in one side channel of the Lower Elwha River as a pilot project to quantify the ability of each method to enumerate juvenile salmonids. We sampled six habitat units in the lowermost side channel of the mainstem river just prior to where it enters the Strait of Juan De Fuca. First we identified the beginning and end of each habitat unit and measured several attributes including habitat unit length, width, maximum depth, residual depth, the amount of instream channel cover, the amount of cutbank, and the average cutbank depth (Table 6). We then identified the “sample ability” of a given unit for each of the different samples methods (Figure 10). The “sample ability” is based on a scale of one to five, with one representing a habitat unit with the lowest sample efficiency (i.e., most difficult to sample) and five the highest. The “sample ability” rating was based on factors known to influence sampling efficiency, including habitat depth, the amount of instream cover, habitat “roughness”, and the overall habitat morphology (i.e. habitat length to stream depth ratio).
After determining the sample ability, we first sampled each unit by snorkeling. One to two snorkelers, depending upon the size of the unit snorkeled in an upstream direction using a single pass approach. Snorkelers identified delineated each fish by species (i.e. coho, rainbow/steelhead, Chinook, sculpin, stickleback, other) and size class (i.e. 0 to 50mm, 50 to 100mm, 100 to 150mm, 150 to 200mm, and greater than 200mm). We then waited 1 hour before going back to the same unit to electroshock. We did this because we hypothesized that fish were redistributed once the snorkelers went through and would resume their original positions prior to snorkeling. We then repeated the sampling of units with three-pass electrofishing. Captured fish from each pass were placed into 5 gallon buckets, identified to species and fork length was measured. After completing three-passes all fish were returned to the habitat unit. Lastly we waited 24 hours and returned to each of the habitat units to seine. We again used three passes and removed and retained fish to identify species and measure length. All fish were returned to the same habitat unit they were sampled from after the third pass. We also quantified how long each method took for a given habitat unit (Table 7).
Results
The results of our sampling revealed some clear patterns. First, we found that snorkel counts were 2 to 4 times greater than either electroshocking or seining in the same habitat units (Figure 11). Second, seining captured a higher proportion of juvenile Chinook relative to electroshocking, while seining and electrofishing captured similar numbers of juvenile coho and rainbow/steelhead (Figure 12a, b, and c). Third, snorkeling took 3 times less time (±0.8) than electroshocking and seining, which both required a similar level of time for sampling (Table 7). Fourth, as the ability to sample with electroshocking or seining increased, the difference between the number of fish identified during snorkeling and the other techniques decreased (Figure 13). Conversely, as the ability to sample with either electroshocking or seining decreased (i.e. a smaller number), the greater the difference between the number of fish identified during snorkeling. Thus if the sample ability number is small for electroshocking or seining, then the ability to compare those methods to snorkeling decreases (Figure 13). Lastly, despite differences in numbers of fish captured, the size distributions of each species were similar for all methods (Figure 14a,b, and c).
Recommendations of protocol and pre-dam conclusions
When we compare these pilot results to our literature review we find the following:
While each method is capable of effectively estimating presence/absence and species diversity across a wide range of conditions, snorkeling identifies the largest number of fish and the greatest diversity of fish size.
Multi-pass electrofishing and seining are most appropriate for surveying short sections of small streams with shallow, minimally complex habitat and a diverse population assemblage. Seining is most effective of all methods when visibility is poor. These methods, if calibrated for efficiency biases such as roughness and instream cover, can effectively and efficiently survey a wide array of streams and fish populations.
Smolt analysis of existing data from the Elwha River
Introduction
Enumerating smolts as they exit the Elwha river will provides estimates of fresh water production (i.e. number of smolts per number of spawners), as well as the timing and size distribution of juvenile salmon at entry into the marine environment. In the Elwha this will help to answer one of the main questions we pose in our monitoring effort – what is the trend in smolts to adults by species? In addition, the smolt trap information will provide a useful index of juvenile salmonid population size for all species, including those that are not readily counted at the adult stage (i.e. chum salmon, pink salmon, and coho salmon). We describe the current smolt trapping program in the Elwha River and ways that it could be improved. We also present Elwha River smolt data collected to date, and illustrate the technique used to expand raw catch data to estimates of total out migrants for several Elwha River salmonid species.
Methods
The Elwha screw trap
The Lower Elwha Klallam Tribe has operated an 8’ rotary screw from 2005 to the present1. Trap operation has evolved substantially over this period in response to the cumulative experience operating at this site. The trap is fished continuously from late February or early March until mid June when the state hatchery releases approximately 3.5 million fingerling Chinook salmon smolts. Operation beyond this point is not feasible due to the effort necessary to deal with the hatchery Chinook salmon caught in the trap. The trap is located below all side channels that are active during the trapping season (approximately RM 1.0). The trap is typically checked twice a day. On each of these occasions the following procedure is used:
All of the fish are removed from a collection box and tallied by species, origin, and mark.
Any fish that were marked for efficiency estimates (Bismark brown mark) are counted.
Revolutions per minute (RPM) of the trap, depth, visibility, and flow are also measured.
Estimating efficiency
Because the screw trap only captures a small proportion of all the juvenile salmon fish moving out of the river, in order to estimate the total number of out migrants, the proportion captured (or trap efficiency) needs to be estimated. The general approach is to release marked fish above the trap and record the proportion captured in the trap. For the Elwha trap, multiple groups of 1000 Bismark brown marked chum smolts are released during the period of trap operation. Chum smolts were used predominantly due to their availability and similarity in size to Chinook 0+ and pink smolts. The periods between releases are assumed to be large enough that the vast majority of fish from one release group will have passed the trap site before the next release. In the first several years of trap operation attempts were made to estimate efficiency for yearling smolts. However, very few fish were recaptured, and these efforts were abandoned. Total out migrants are there for not estimated for the yearling smolts (coho, Chinook 1+, and steelhead). Difficulty recapturing yearling smolts is common when operating screw traps in large rivers since they are able to actively avoid the trap. It is also difficult to acquire large numbers of yearly smolts to mark, thus estimating trap efficiency for these fish is intrinsically difficult.
Estimating total out migrants for Chinook 0+, pink, and chum smolts
For “young of the year” Chinook (0+), pink, and chum smolts the total out migrant numbers are estimated by adjusting for trapping effort and efficiency. Here we describe the steps used to construct these estimates and use Chinook 0+ in 2009 as an example. The two steps are adjusting for trapping effort and expanding the catch based on efficiency.
Adjusting for trapping effort
The goal is to operate the trap continuously. However, many difficulties intrinsic to screw trap operation result in periods when data is not collected (for example, large wood can jam the screw). When the disruption is less than a day, then the proportion of total hours fished during that day can be used to expand the catch. However, when entire days are missing, another approach is necessary. For the latter case we use a simple non-linear (loess) model fit to the available data, to interpolate (Figure 15, top panel). Because there are very few missing days we do not take uncertainty into account in this step.
Expanding catch based on efficiency estimates
Once there are catch values for all days during the trapping period, the catches are expanded to estimates of total out migrants using efficiency estimates (Figure 15, middle and lower panels). We used the modified Peterson estimator (e.g. see Carlson et al. 1998):

Here Ui is the total estimated out migrants, ui is the catch, Mi is the total released, mi is the recaptured marked fish, and i is the period. We used the variance estimator (Carlson et al. 1998, Volkhardt et al. 2007):
 .
.
Efficiency is applied to the recapture periods for specific release events resulting in varying efficiency across time (Figure 1 middle panel, see below for details). The sum of all expanded catches is then used as an estimate of total out migrants. The total variance is also just the sum of variances across periods. Confidence intervals (95%) are calculated as +/- 1.96 times the square root of the variance. While the variance estimates provide a useful measure of uncertainty, they are likely underestimates for a several reasons:
The recapture rates likely do not follow a binomial distribution; instead they are likely to be over dispersed.
Separate marks are not used for each release group, thus fish will occasionally be assigned to the wrong release.
The chum release groups do not exactly mimic other down stream migrating species such as pink salmon and Chinook salmon.
Fish are released during the day, which may result in downstream movement during the day as opposed to night.
Lastly efficiency is changing continuously but assumed to remain the same for multi day periods.
Results
The current smolt data
A total of 54,000 fish were captured and processed in the screw trap between 2005 and 2009 (Tables 8 and 9). Combining these raw catch data with effort (hours per day fished), and efficiency produced estimates of total outmigrants (Figure 16). There is substantial variability in timing, and total numbers between year and species (Figure 17). Some of this is likely due to different periods of operation and other across year differences in trap operation. For example during 2005 and 2006, trapping didn’t begin until mid March before which a substantial portion of the Chinook outmigrants had passed in previous years. In addition, the methodology for measuring efficiency changed across years. For fish with larger smolts (coho 1+, Chin 1+, and steelhead), the trap efficiency was extremely poor and only the raw catch is reported (Figure 18). Again, the numbers vary substantially by species and year, with only a few dozen fish total for some year species combinations. Catch provides some indication of out migrant timing however the trap efficiency certainly changes over time suggesting cautious interpretation.
Discussion
Recommendations of protocol and pre-dam conclusions
Dam removal will likely affect the trap operation. During the period of high turbidity immediately after the dam removal, the trap efficiency will likely change. Also, the input of large amounts of sediment and wood may substantially change the current trap site requiring the location of another site. Estimates of smolt production could be improved include:
Modifying the trap or site, or moving the trap. There are very few feasible trap sites below the spawning grounds. However, adjustments in trap location or modification of the current site may lead to increased efficiency.
Increasing and modifying the releases for estimating efficiency. Current releases are during the day, while night releases are generally recommended. In addition chum smolts are currently used for efficiency estimates for all Chinook 0+, chum and pink smolts. More work could be done to determine if this is appropriate. Also, a renewed effort to estimate efficiency for yearling smolts could allow for out migrant estimates for these fish (Chinook 1+, coho, and steelhead).
Adding another screw trap, using a different screw trap, or modify the current trap.
Habitat - How does spawning habitat quantity and quality vary by habitat type, spatial location, and pre and post dam removal?
Introduction
One of the major questions we will attempt to answer with the Elwha River dam removals is how does habitat condition vary by habitat types, spatial location, and pre and post dam removal? Our initial baseline monitoring focused on a specific aspect of this question which is how does spawning habitat quantity and quality vary by habitat type, spatial location, and pre and post dam removal? Based on a literature review we identified two stream habitat metrics that are relatively simple to measure and can effectively convey long-term changes in habitat quality due to Elwha River dam removal: residual pool depth (maximum – minimum depth) and stream bed particle size distribution in adjacent riffle crests. Changes in the depth of pool habitats and streambed particle size are likely in the main stem river habitats because of the influx of sediment that will occur with dam removal. Measures of pool depth and particle size will provide estimates of habitat quality and quantity, in addition to a better understanding of how dam removal affects one main life stage for all salmonids -- spawning. Our hypothesis is that the influx of sediment to the Middle and Lower Elwha will initially result in changes to pool depth and dimensions because it is expected that most new sediment will be small in size (e.g., fines) (DOI 1996). As the stream channel changes and eventually reaches equilibrium following dam removal, larger sediment in the form of gravels and cobbles will make its way downstream and start to affect deep water areas such as pools, where salmonids often stage, and riffle areas where salmonids tend to spawn. Capturing changes in the stream channel structure will thus be important to the availability of salmon holding and spawning habitat post dam removal.
We relate pool depth and streambed particle size measurements to salmonids in two ways in the lower and middle Elwha River. First, we calculated the percent spawnable riffle area to predict current and future spawning areas. Salmonids select spawning areas largely because of gravel size (Quinn 2005), so we hypothesize that is it likely to predict their distribution based on our substrate measurements. Second, we calculated the amount of pool habitat available for staging of pre-spawn salmonids. Holding pools are a critical habitat for many spawning salmonids, and pool filling is likely to be the most obvious effect of sediment release after dam removal. Repeated surveys of thalweg profiles or channel cross sections can indicate changes in bed elevation variability (Madej 1999), but these methods are expensive and yield little information directly relevant to holding pools or spawning habitat. Measurement of residual pool filling is a direct measure of changes in holding habitat quality, but the method is relatively time consuming to apply over a large area. Measuring changes in number of pools or residual pool depth is more efficient than other techniques because surveys can be conducted rapidly (Madej 1999), and the information obtained is a direct measure of holding habitat availability and quality.
Methods
Residual pool depth and streambed particle size
We implemented a simple approach that attempts to quantify the depth of pool habitat and the streambed particle composition of the front of gravel bars also known as “full spanning” riffles in the Middle and Lower Elwha. A full spanning riffle is a riffle crest that spans the entire wetted width of the stream at the time of sampling prior to fall salmon spawning. Full spanning riffles are typically associated with front end of large, transverse gravel bars (Lisle 1982).
To capture the change in pool depth we utilized a proven method that quantifies the residual pool depth of each main stem pool in the Middle and Lower Elwha (Figure 19). We recorded the longitude and latitude with a GPS and measured the area and residual depth (maximum depth – tail out depth, Figure 19) of each pool in accessible mainstem reaches.
We measured streambed particle size at every full spanning riffle in the Middle and Lower Elwha. These riffles were typically located in the tail out portion of the pools where depth was measured. The extent of the riffle crest was determined by creating two transects -- one upstream and one downstream -- at a point where the water was 0.2m deeper than the minimum riffle crest depth. Total riffle area was then measured. Pebble counts (100 particles measured along the B axis of a rock) were conducted on each transect because salmon spawning is hypothesized to occur in those locations. Pebble counts quantify the substrate within a given area and include the distribution of streambed particle sizes. Data collected at each site included location, widths, depths, and particle size distribution (Table 10). We assume that pebble counts and residual pool depths will be sensitive enough to the changes in particle size and depth to capture the change due to the anticipated large-scale change in sediment supply from dam removal.
Data analysis
We compared 2009 residual pool depths to previous data collection efforts (2000) to gain an understanding of the variation in individual pool depth prior to dam removal. We also examined the cumulative distribution of pool depths using the Kolmogorov–Smirnov statistic. In addition we compared the within year variation between sites at the reach (Middle Elwha, Lower Elwha) and site (upstream v. downstream side of riffle crests) scale.
Even though we have previous years data, the pebble count locations were not in similar habitats among years, so it was only possible to compare the within year variation between sites at the reach and site scale. We used tests such as the mean particle size (D50), the variation (ratio of D84 to D16), and cumulative distribution functions at the site and reach scale.
Linking data to fish utilization
We attempted to link the stream bed particle size data with fish size data in order to estimate the % spawnable area for the largest (Chinook) and smallest (pink) salmon that inhabit the Elwha River. We utilized several sources of data for this analysis including stream bed particle size and the body size of female Chinook and pink salmon (Wooster et al. 2009) (Figure 20). In order to do so we needed to make some basic assumptions regarding spawnable area for salmonids. First, we assume that a salmon spawning nest is limited by a maximum moveable stream bed particle size, the size of the female salmon, and flow conditions. Second, we assume that salmon spawning nests will decrease with an increase in the amount of “immovable” particles. Third, while we know salmon will utilize many different habitats for spawning, we assumed that the majority of spawning would occur where the tail out of a pool transitions into riffle areas (Quinn 2005).
Lower Elwha Tribe has collected spatially specific spawning data since 2005 for the entire river below the lowermost dam (Aldwell dam), enabling us to compare existing spawnable area data to predicted spawnable area by examining Chinook redd locations over time. Thus we were able to identify the proportion of Chinook that spawn in the riffle crest areas relative to other areas in the Lower Elwha. We used tribal harvest data to estimate the average and standard deviation body mass of female Chinook. We assumed that female size in past years will be representative of female size in future years. To determine the fraction that is immobile we used the following equation:

where;


To calculate the percent spawnable area identified a maximum percent spawnable area based on the percent immobile fraction (Figure x11).
Results
We sampled 24 locations in the Lower Elwha and 17 locations in the Middle Elwha (Figure 21). These sites were distributed throughout the main stem Elwha and included both pools and riffle crests (Figure 21). We found a decreasing trend in stream particle size from the Middle Elwha to the Lower Elwha (Figure 22a.). The Lower Elwha had a much steeper decrease in particle size from the dam to the mouth of the river, while the Middle Elwha trend was not as steep even though the distance was similar (6.62 kilomters v. 6.84 kilometers) (Figure 22b, and c.). Particle size distribution between the Middle Elwha and the Lower Elwha were similar (Table 11) with the Middle Elwha having a slightly larger overall average, but the difference was not significant (p-value = 0.321). Stream bed particle size was also similar on the up and downstream side of each riffle crest between the Lower and Middle Elwha (p-value=0.329 and p-value=0.421 respectively). Examination of each individual site revealed that the upstream and downstream side of each of the riffle crest was similar in the majority of the locations in the Lower and Middle Elwha (Table 12). However over 40% of the riffle crests did have a significant difference between the upstream and downstream side (Table 12). In the majority of those cases the downstream side had a larger average particle size than the upstream side (13 of 17 riffle crests). Residual pool depth increased in the downstream direction (Figure 23). Mean residual pool depth in the Lower Elwha (2.39m ±0.28m) was significantly deeper than in the Middle Elwha (1.68m ±0.15m) (p = 0.019) (Figure 23). Importantly, pool depth did not vary as much between years as it did spatially (Figure 24). Differences between years (2.89 m, ± 0.48m in 2009 v. 2.75m ±0.47m in 2000) were not significant (p = 0.156) in the Lower Elwha (Figure 24).
As expected, the proportion of immobile particles varied as a function of location and salmon species (Figure 25). There was a consistently higher trend of predicted immobile particles for pink relative to Chinook salmon due to their smaller average size. The immobile fraction for Chinook salmon ranged from 0% to a maximum of 50%, while the range for pink salmon was 0% to 75%, with the majority of sites being greater than 50% immobile for pink salmon (Figure 25). In each case there was a considerably smaller percentage of immobile particles in the lowest 2km of the Elwha (Figure 25).
The percent fraction spawnable followed a similar pattern (Figure 26). The percent spawnable for Chinook salmon ranged consistently between 10% and 50%. The majority of riffle crest locations in the Lower Elwha had a predicted spawnable are between 25% and 50%, and the majority in the Middle Elwha ranged between 10% and 40% (Figure 26). The majority (48 of 86) of predicted percent spawnable areas for pink salmon in the riffle crests were estimated to be 0% while a much smaller proportion of the sites (12 out of 86) were estimate to be 0% spawnable for Chinook salmon (Figure 26).
Discussion
Recommendations of protocol and pre-dam conclusions
Streambed particle size and residual habitat depth are key components of spawning habitat quality to measure when a known influx of sediment will occur with dam removal. These two variables should be continued to be measures systematically through the Elwha, above and below the dams, in order to gain an understanding of baseline condition. Additionally these twp metrics should be measured immediately post-dam removal and then periodically as a function of large scale distriburbance events including the dam removal and large flow events. Measurements should occur prior to spawning season in order to predict the location and density of spawning by salmonids.
In the Elwha River we found that streambed particle size decreases in a downstream direction below each of the dams, and decreases considerably in the lower 2km of the river before entering the Strait of Juan de Fuca. The decreasing trend in particle size is greater in the Lower Elwha than the Middle Elwha. Within site variation is typically not significant, but there are portions of the riffle crest sites that exhibit a significant differences between the upper and lower transects of the riffle crest. The sites that exhibit a significant difference between the upstream and downstream portion of riffle crests are evenly distributed between the Lower and Middle Elwha. In general, residual pool depth increases in the downstream direction, however, residual pool depth does decrease in the lowest portion of the Lower Elwha. Residual pool depths are significantly different between the Middle and Lower Elwha, but the difference between years for the same pools surveyed is not significantly different. Predicted percent spawnable area varies by species but is greatest in the Lower Elwha, particularly in the lowest portion of the Elwha below Rkm 2.5. The probability of a site having spawnable area is greater for Chinook salmon than pink salmon, but at a given site there is typically a larger predicted percent spawnable area for pink salmon relative to Chinook salmon.
General recommendations - What methods might be most appropriate for the Elwha?
Maintain and expand the current adult salmon enumeration activities including redd surveys, SONAR, and the fish weir. Expansion includes other species besides Chinook salmon and steelhead. Expansion to other species and methods is particularly important because of the limited visibility that will occur with dam removal. We recommend augmenting visual surveys with alternate enumeration methods such as the weir and imaging SONAR. While neither of these methods has been tested across seasons in the Elwha, they have been effectively used at other sites, and could be used in other dam removals as well. In addition the weir and sonar have the potential to be complimentary. Further identify salmon populations in other watersheds that track well with salmonids in the Elwha to help identify trends associated with the dam removal v. other factors such as ocean conditions. Adult enumeration needs to be ongoing and annual pre and post dam removal for at least 2 to 3 generations of salmon, which is a function of their life history.
Developing estimates of “standing crop” juvenile salmon populations in different habitats prior to dam removal is important to aid in understand how colonization occurs in the Elwha and at other dam removal locations. Multiple methods such as snorkeling, electroshocking, and seining can be used to meet this objective. While each method for juvenile enumeration is capable of effectively estimating presence/absence and species diversity across a wide range of conditions, snorkeling identifies the largest number of fish and the greatest diversity of fish size. Multi-pass electrofishing and seining are most appropriate for surveying short sections of small streams with shallow, minimally complex habitat and a diverse population assemblage. Seining is most effective of all methods when visibility is poor. We recommend that such efforts be made at least once prior to dam removal and at least three times over a period of a decade to get a better understanding of relative abundance and distribution over time.
More importantly we recommend that a larger effort be taken to maintain and improve the Elwha screw trap for outmigrating salmonid smolts because it is a better indicator of overall juvenile productivity from the watershed. Dam removal will likely affect the trap operation. During the period of high turbidity immediately after the dam removal, the trap efficiency will likely change. Also, the input of large amounts of sediment and wood may substantially change the current trap site requiring the location of another site. Estimates of smolt production could be improved by modifying the trap or site, or moving the trap in order to increase trap efficiency. In addition we recommend increasing and modifying the releases for estimating efficiency by using additional species beyond chum and conducting night efficiency estimates. Smolt outmigration monitoring should be annual pre and post dam removal for at least 2 to 3 generations of salmon.
References
Adult enumeration - The effectiveness and application of different adult salmonid enumeration methods
Ames, J., and Phinney, D.E. 1977. Puget Sound summer-fall Chinook methodology; escapement goals, run size forecasts, and in-season run size estimates. Wash. Dept. Fish. Tech. Rep. No. 29.
Banneheka, S.G., Routledge, R.D., Guthrie, I. C., and Woodey, J.C. 1995. Estimation of in-river fish passage using a combination of transect and stationary hydroacoustic sampling. Can. J. Fish. Aquat. Sci. 52:335-343.
Belcher, E.O., Matsuyama B., and Trimble, G. M.. 2001. Object identification with acoustic lenses. Pp. 6–11 in Conference proceedings MTS/IEEE Oceans, volume 1, session 1. Honolulu Hawaii, November 5–8.
Belcher, E.O., Hanot, W., and Burch J.. 2002. Dual-frequency identification sonar. Pp. 187–192 in Proceedings of the 2002 International Symposium on underwater technology. Tokyo, Japan, April 16–19.
Bocking, R. C., Peterman, R. M. 1988. Preseason forecasts of sockeye salmon – Comparisons of methods and economic considerations. Can. J. Fish. Aquat. Sci. 45:1346-1354.
Bue, B. G., Fried, S. M., Sharr, S., Sharp, D. G., Wilcock, J. A. and Geiger, H. J. 1988. Estimating salmon escapement using under-the-curve, aerial observer efficiency, and stream-life estimates: the Prince William Sound pink salmon example. North Pac. Anadr. Fish. Comm. Bull. 1:240-250.
Cochran, W.G. 1977. Sampling techniques, 3rd edition. John Wiley and Sons, Inc., New York.
Denton, K.D. and Liermann, M. 2009. Enumeration of Summer Chinook Escapement in the Elwha River Using BlueView Multi-beam Sonar Technology. Prepared for the Lower Elwha Klallam Tribe.
Dunbar, R. 2001. Copper River Hydroacoustic Salmon Enumeration Studies, 2000 and 2001. Alaska Department of Fish and Game, Commercial Fisheries Division, Regional Information Report No. 2A01-3, Anchorage.
Dunbar, R. 2003. Anvik River sonar chum salmon escapement study, 2003. Regional Information Report No. 3A03-14. Alaska Department of Fish and Game, Division of Commercial Fisheries, Anchorage.
Dunbar, R. and Pfisterer, C.T.. 2004. Sonar estimation of fall chum salmon abundance in the Sheenjek River, 2002. Regional Information Report No. 3A04-10. Alaska Department of Fish and Game, Division of Commercial Fisheries, Anchorage.
English, K. K., Bocking, R. C., and Irvine, J. R. 1992. A robust procedure for estimating salmon escapement based on the area under the curve method. Can. J. Fish. Aquat. Sci. 49: 19821989.
Fleischman, S. J. and Burwen, D. L. 2003. Mixture models for the species apportionment of hydroacoustic data, with echo-envelope length as the discriminatory variable. ICES Journal of Marine Science 60(3):592-598
Gallagher, S.P. and Gallagher C.M. 2005. Discrimination of Chinook Salmon, Coho Salmon, and Steelhead Redds and Evaluation of the Use of Redd Data for Estimating Escapement in Several Unregulated Streams in Northern California. NAJFM 25: 284-300.
Hilborn, R, Bue, B. G., and Sharr S. 1999. Estimating spawning escapements from periodic counts: a comparison of methods. Can. J. Fish. Aquat. Sci. 56:888-896.
Hill, R. A. 1997. Optimizing aerial count frequency for the area-under-the-curve method of estimating escapement. N. Am. J. Fish. Manage. 17:461-466.
Hiss, J.M. 1995. Elwha river chum salmon (Oncorhynchus keta): Spawner survey and escapement estimate, 1994-1995. USFWS, Western Washington Fisheries Office. Olympia, Washington.
Hoffnagle, T. L., Carmichael, R. W., Frenyea, K. A., and Keniry, P. J. 2008. Run timing, spawn timing, and spawning distribution of hatchery- and natural-origin spring Chinook salmon in the Imnaha River, Oregon. N. Am. J. Fish. Manage. 28:148-164
Holmes, J.A, Cronkite, G.M., Enzenhofer, H.J., and Mulligan, T.J. 2006. Accuracy and precision of fish-count data from a “dual frequency identification sonar” DIDSON imaging system. ICES Journal of Marine Science, 63:543-555
Irvine, J.R., Bocking, R.C., English, K.K., and Labelle M. 1992. Estimating coho salmon (Oncorhynchus kisutsch) spawning escapement by conducting visual surveys in areas using stratified random and stratified index sampling designs. Canadian journal of Fisheries and Aquatic Sciences 49:1972-1981.
Korman, J and Higgins, P. S. 1997. Utility of escapement time series data for monitoring the response of salmon populations to habitat alteration. Can. J. Fish. Aquat. Sci. 54: 2058–2067
Lilja, J, Ridley, T., Cronkite, G. M., Enzenhofer, H. J., and Holmes, J. A. 2008. Optimizing sampling effort within a systematic design for estimating abundant escapement of sockeye salmon (Oncorhynchus nerka) in their natal river. Fisheries Research 90:118-127.
McKinley, W.L. 2002. Sonar enumeration of Pacific salmon into the Nushagak River, 2001. Alaska Department of Fish and Game, Commercial Fisheries Division, Regional Information Report No. 2A02-25, Anchorage.
Muhlfeld, C.C., Taper, M. L., Staples, D. F., and Shepard, B. B. 2006 Observer error structure in bull trout redd counts in Montana streams: Implications for inference on true redd numbers. Transactions of the American Fisheries society. 135:643-654.
Shardlow, T., Hilborn, R. and Lightly, D. 1987. Components analysis of instream escapement methods for Pacific salmon. Can. J. Fish. Aquat. Sci. 44: 1031-1037
Tobin, J.H. 1994. Construction and performance of a portable resistance board weir for counting migrating adult salmon in rivers. U.S. Fish and Wildlife Service, Kenai Fishery Resources Office, Fisheries Technical Report Number 22, Kenai, Alaska.
Westerman, D.L. and Willette, T. M.. 2003. Upper Cook Inlet Salmon Escapement Studies 2003. Alaska Department of Fish and Game, Commercial Fisheries Division, Regional Information Report No. 2A04-03.
Juvenile enumeration - The effectiveness and application of different juvenile salmonid enumeration methods
Bayley, P. B., and R. A. Herendeen. 2000. The efficiency of a seine net. Transactions of the American Fisheries Society 129:901–923.
Cao, Y., D. P. Larsen, and R. M. Hughes. 2001. Evaluating sampling sufficiency in fish assemblage surveys:a similarity based approach. Canadian Journal of Fisheries and Aquatic Sciences 58:1782–1793.
Carlson, S. R., L. Coggins, and C. O. Swanton. 1998. A simple stratified design for mark–recapture of salmon smolt abundance. Alaska Fisheries Research Bulletin 5(2): 88–102. Available: www.adfg.state.ak.us/pubs/afrb/vol5_n2/carlv5n2.pdf (August 2005).
Dolloff, C. A., J. Kershner, and R. Thurow. 1996. Underwater observation. Pages 533-
554 in B. R. Murphy and D. W. Willis, editors. Fisherie s techniques, 2nd edition.
American Fisheries Society, Bethesda, Maryland.
Esrin, E.V. 2009. Comparison of different methods of census of juvenile salmonids (Salmonidae) in the small river of Mikocheva (Western Kamchatka). Journal of Ichthyology 49: 777-785.
Gries, G., and B.H. Letcher. 2002. A night seining technique for sampling juvenile Atlantic salmon in streams. North American Journal of Fisheries Management 22: 595-601.
Grost, R.T., and L. Prendergast. 1999. Summer counts of stream-resident trout can differ between daytime and night. North American Journal of Fisheries Management 19: 837-841.
Hahn, P.K.J., R.E. Bailey, and A. Ritchie. 2002. Beach seining. State of the Salmon Field Protocols Handbook at: www.stateofthesalmon.org/fieldprotocols/
downloads/SFPH_p9.pdf
Hankin, D. G. 1984. Multistage sampling designs in fisheries research: applications in
small streams. Canadian Journal of Fisheries and Aquatic Sciences 41:1575-
1591.
Hankin, D. G., and G. H. Reeves. 1988. Estimating total fish abundance and total habitat
area in small streams based on visual estimation methods. Canadian Journal of
Fisheries and Aquatic Sciences 45:834-844.
Hayes, D. B., C. P. Ferreri, and W. W. Taylor. 1996. Active fish capture methods. Pages 193–220 in B. R. Murphy and D. W. Willis, editors. Fisheries techniques. American Fisheries Society, Bethesda, Maryland.
Hillman, T.W., J.W. Mullan, and J.S. Griffith. 1992. Accuracy of underwater counts of juvenile chinook salmon, coho salmon, and steelhead. North American Journal of Fisheries Management 12: 598-603.
Joyce, M.P., and W.A. Hubert. 2003. Snorkeling as an alternative to depletion electrofishing for assessing cutthroat trout and brown trout in stream pools. Journal of Freshwater Ecology 18(2): 215-222.
Korman, J., R.M. Ahrens, P.S. Higgins, and C.J. Walters. 2002. Effects of observer efficiency, arrival timing, and survey life on estimates of escapement for steelhead trout (Oncorhynchus mykiss) derived from repeat mark-recapture experiments. Canadian Journal of Fisheries and Aquatic Sciences 59: 1116-1131.
Kruse, C.G., and W.A. Hubert. 1998. Single-pass electrofishing predicts trout abundance in mountain streams with sparse habitat. North American Journal of Fisheries Management 18: 940-946.
McHenry, M. L., and G. R. Pess. 2008. An overview of monitoring options for assessing the response of salmonids and their aquatic ecosystems in the Elwha River following dam removal. Northwest Science 82 (Special Issue):29-47.
Murphy, B. R., and D. W. Willis, editors. 1996. Fisheries techniques, 2nd edition. American Fisheries Society, Bethesda, Maryland.
Nielsen, J. L. 1998. Electrofishing California’s endangered fish populations. Fisheries 23(12):6–12.
Peterson, J. T., R. F. Thurow, and J. W. Guzevich. 2004. An evaluation of multipass electrofishing for estimating the abundance of stream-dwelling salmonids. Transactions of the American Fisheries Society 133:462–475.
Peterson, J. T., N. P. Banish, and R. F. Thurow. 2005. Are block nets necessary? Movement of stream-dwelling salmonids in response to three common survey methods. North American Journal of Fisheries Management 25:732–743.
Reid, S.M., G. Yunker, and N.E. Jones. 2009. Evaluation of single-pass backpack electric fishing for stream community monitoring. Fisheries Management and Ecology 16: 1-9.
Reynolds, J. B. 1996. Electrofishing. Pages 221-253 in B. R. Murphy and D. W. Willis,
editors. Fisheries techniques, 2nd edition. American Fisheries Society, Bethesda,
Maryland.
Riley, S. C., and K. D. Fausch. 1992. Underestimation of trout population size by maximum likelihood removal estimates in small streams. North American Journal of Fisheries Management 12:768-776.
Rodgers, J. D., M. F. Solazzi, S. L. Johnson, and M. A. Buckman. 1992. Comparison of
three techniques to estimate juvenile coho salmon populations in small streams.North American Journal of Fisheries Management 12:79-86.
Rosenberger, A. E., and Dunham, J.B. 2005. Validation of abundance estimates from mark recapture and removal techniques for rainbow trout captured by electrofishing in small streams. North American Journal of Fisheries Management 25: 251 - 262.
Roni, P., A. Fayram. 2000. Estimating winter salmonid abundance in small western Washington streams: a comparison of three techniques. North American Journal of Fisheries Management, 20:683-692
Rozas, L. P., and T. J. Minello. 1997. Estimating the densities of small fishes and decapod crustaceans in shallow estuarine habitats: a review of sampling design with a focus on gear selection. Estuaries 20(1):199–213.
Schill, D.J., and J.S. Griffith. 1984. Use of underwater observations to estimate cutthroat trout abundance in the Yellowstone River. North American Journal of Fisheries and Aquatic Management 4: 479-487.
Thompson, A.A., and B.D. Mapstone. Observer effects and training in underwater visual surveys of reef fishes. Marine Ecology Progress Series 154: 53-63.
Thurow, R.F. 1994. Underwater Methods for Study of Salmonids in the Intermountain West. United States Forest Service. General Technical Report INT-GTR-307.
Thurow, R.F., J.T. Peterson, and J.W. Guzevich. 2006. Utility and validation of day and night snorkel counts for estimating bull trout abundance in first- and third-order streams. North American Journal of Fisheries Management 26: 217-232.
Volkhardt, G.C., S.L. Johnson, B.A. Miller, T.E. Nickelson, and D.E. Seiler. 2007. Rotary Screw Traps and Inclined Plane Screen Traps. Pages 235-266, In Salmonid Field Protocols Handbook: Techniques for Assessing Status and Trends in Salmon and Trout Populations. Amercian Fisheries Society, Bethesda, Maryland.
Young, R.G., and J.W. Hayes. 2001. Assessing the accuracy of drift-dive estimates of brown trout (Salmo trutta) abundance in New Zealand rivers: a mark-resighting study. New Zealand Journal of Marine and Freshwater Research 35: 269-275.
Habitat surveys - How does spawning habitat quantity and quality vary by habitat type, spatial location, and pre and post dam removal?
Department of the Interior (DOI). 1996. Sediment analysis and modeling of the river erosion alternative. Elwha Technical Series, PN-95-9, Bureau of Reclamation, Pacific Northwest Region, Boise, ID.
Lisle, T. E. 1982, Effects of aggradation and degradation on riffle-pool morphology in natural gravel channels, northwestern California. Water Resources Research 18:1643-1651.
Madej, M. A., 1999. Temporal and spatial variability in thalweg profiles of a gravel-bed river, Earth Surface Processes and Landforms, 24: 1153–1169.
Quinn, T.P. 2005. The Behavior and Ecology of Pacific Salmon and Trout. American Fisheries Society in association with University of Washington Press, Bethesda. MD.
Wooster, J. K.; Riebe, C. S.; Ligon, F. K.; Overstreet, B. T. 2009. How coarse is too coarse for salmon spawning substrates? American Geophysical Union, Fall Meeting 2009, Abstract #H51D-0790. San Francisco, CA.
Tables and Figures
Adult enumeration - The effectiveness and application of different adult salmonid enumeration methods
Table 1. A summary of the available data for Elwha river salmon and steelhead populations.
Species |
Number of Years |
Methods |
Population range |
Principal group responsible for data collection |
Data quality |
Chinook |
1976 - Current |
Redds/Adults |
|
WDFW/LEKT |
moderate |
|
2008 - Current |
SONAR |
|
NOAA/LEKT |
poor-moderate
|
Coho |
- |
- |
- |
- |
-
|
Chum |
1993,1994 |
Live counts & Mark recapture
|
150-250 |
USFWS |
unknown |
Pink |
2009 |
Adult snorkel |
100 + |
NOAA |
unknown |
|
|
|
|
|
|
Steelhead (winter)
|
2005 - Current |
Redds |
|
LEKT |
low |
Steelhead (summer) |
- |
- |
|
- |
- |
Table 2. Correlation of a.Chinook salmon, b. coho salmon, and c. winter steelhead from 1975 to 2008 for the Elwha, Quillayute, Queets, and Hoh rivers on the Olympic Peninsula, Washington State.
a.
|
Elwha |
Quillayute |
Queets |
Hoh |
Elwha |
1.00 |
0.75 |
0.71 |
0.58 |
|
|
|
|
|
Quillayute
|
0.75 |
1.00 |
0.76 |
0.70 |
Queets |
0.71 |
0.76 |
1.00 |
0.93 |
|
|
|
|
|
Hoh
|
0.58 |
0.70 |
0.93 |
1.00 |
b.
|
Quillayute |
Queets |
Hoh |
Quillayute
|
1.00 |
0.81 |
0.82 |
Queets |
0.81 |
1.00 |
0.79 |
|
|
|
|
Hoh
|
0.82 |
0.79 |
1.00 |
c.
|
Quillayute |
Queets |
Hoh |
Quillayute
|
1.00 |
-0.26 |
0.23 |
Queets |
-0.26 |
1.00 |
0.35 |
|
|
|
|
Hoh
|
0.23 |
0.35 |
1.00 |
Table 3. A comparison of the different methods for estimating adult escapement for salmon in the Elwha River. E = excellent, G = good, F = fair, and P = poor for a given species and method based upon assessment of the method and typical Elwha River water clarity at a given season.
Method |
Chinook |
Coho |
Chum |
Pink |
Steelhead (W) |
Steelhead (S) |
Pros |
Cons |
Visual surveys |
G |
P |
P |
G |
F |
P |
Well understood. Relatively simple to implement. Spatial information.
|
Need good visibility. Effort scales with size of river. |
SONAR |
F |
? |
? |
F? |
? |
F? |
Can work in turbid water. Potential for year round operation. |
Difficulty differentiating species. Long processing time.
|
Weir |
E |
P |
P |
E |
P |
G |
Very accurate. Can handle fish for measurements, tagging and exclusion. |
Cannot operate during much of fall, winter, and spring due to high flows. |
Table 4. Estimated annual rates of increase based on the exponential growth phase of six colonizing populations.
Species |
Location |
Population growth rate (r) |
Pink salmon |
Fraser River (Above Hell's Gate), British Columbia, Canada
|
1.18
|
Pink salmon |
Glacier Bay, Southeast Alaska |
2.01
|
Pink salmon |
South Fork Skykomish, Puget Sound, Washington State
|
1.18
|
Coho salmon |
Cedar River, Puget Sound, Washington State
|
2.08
|
Chinook salmon |
Cedar River, Puget Sound, Washington State
|
1.95
|
Chinook salmon |
South Fork Skykomish, Puget Sound, Washington State |
1.28 |
Figure 1. Daily upstream counts of adult Chinook salmon in the Elwha River as determined by SONAR, and redd counts from WDFW surveys. Red boxes indicate SONAR data that was interpolated from nearby data. Solid black bars indicate daily upstream movement past the SONAR. Continuous solid black line indicates cumulative Chinook salmon redd count.
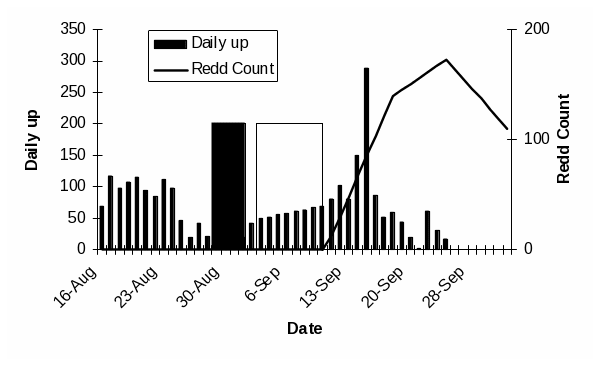

Figure 2. a. Chinook salmon redd locations in the lower Elwha River for 2004 (blue) and 2005 (green).
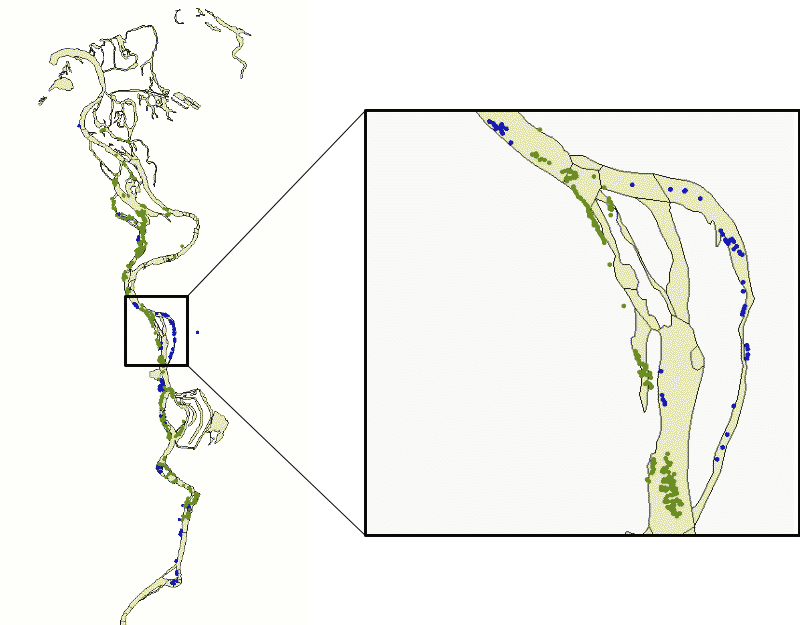
Figure 3. Locations of winter steelhead redds in the Elwha River in 2010. White dots indicate 4/1/2010 survey, yellow dots indicate 4/14/2010 survey, Green dots indicate 4/30/2010 survey, and blue dots indicate 5/10/2010 survey.
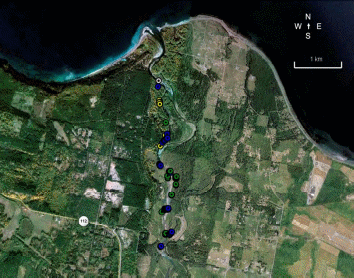
Figure 4. A comparison of adult salmon run size trends for four rivers on the Olympic Peninsula, Washington State for Chinook salmon, coho salmon, and steelhead 1975 to 2008. It is important to note that there are no estimates of coho salmon and steelhead for the Elwha River.
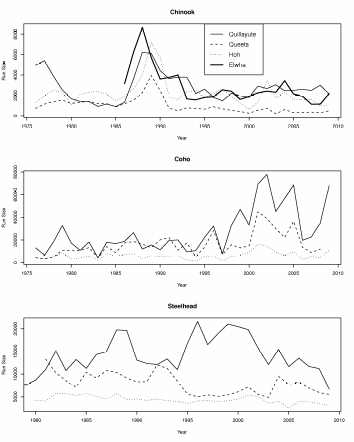
Figure 5. Comparison of the standardized and unstandardized Chinook escapement time series for the Elwha River. Values are logged and centered at zero by subtracting the mean.
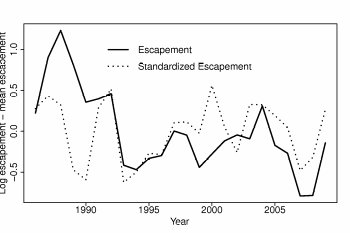
F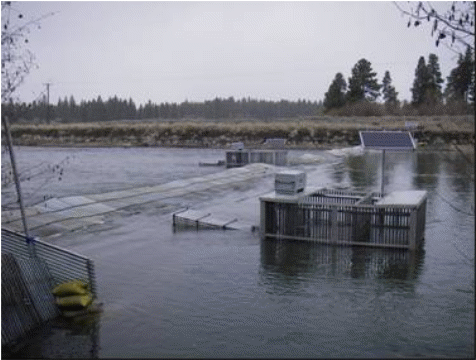 igure
6. Photo of resistance board weir in the Williamson River, OR, a
tributary of the Klamath River in Oregon and Washington state. Flow
is going from right to left, trap boxes are in the center right
foreground and center background of photo.
Figure 7. An example of a simulated standardized time series before and after dam removal for Chinook salmon the Elwha River. The increasing linear trend on the log scale translates to an exponential trend in the standard scale.
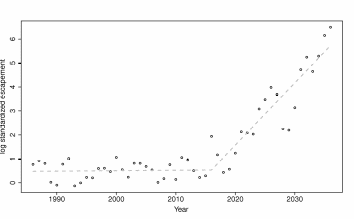
Figure 8. A power analysis to determine the number of years needed to monitor adult Chinook salmon in the Elwha River to determine a “significant” increase in population size due to dam removal. The black region represents the area where the power to detect a change in population size is greater than 0.8.
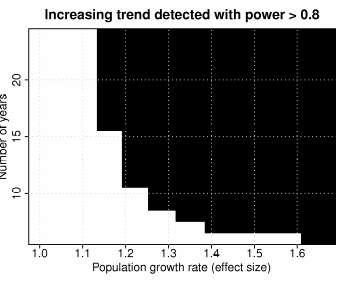
Figure 9. Pink, coho, and Chinook salmon population trajectories for six colonization events across the Western Pacific Rim 1947 to 2010.
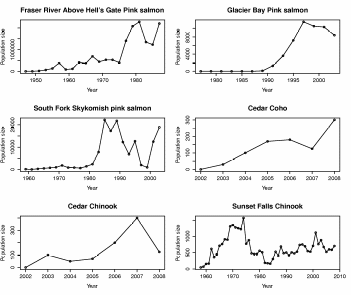
Juvenile enumeration - The effectiveness and application of different juvenile salmonid enumeration methods
Table 5. Description of the relative tradeoffs between the different methods commonly used to enumerate juvenile salmonids in streams, including the conditions under which each method has low and high efficiency, the important factors to consider regarding fish injury, spatial coverage and underwater visibility, the length of stream that can be covered on a daily basis, and the number of people needed to conduct each method.
Method |
Low efficiency |
High efficiency |
Important factors |
Daily coverage |
Crew size |
Electrofishing |
Large and deep streams with complex cover, smaller fish |
Small and shallow streams with minimal cover, medium to larger fish |
Can be injurious to fish and is not influenced by visibility |
100's of meters |
3 - 4 |
Snorkeling |
Shallow streams with complex cover and sometimes smaller fish and juvenile trout, charr |
Streams and rivers with minimal to moderate cover and juvenile salmon and sometimes trout, charr |
Non-injurious to fish and applicable to widest range of stream sizes and depths |
1 - 2 kilometers |
2 - 3 |
Seining |
Large and deep streams with complex cover, smallest-sized fish and benthic species |
Small and shallow streams with minimal cover, larger fish and non-benthic species |
Non-injurious to fish and not influenced by visibility |
100's of meters |
3 - 5 |
Table 6. Description of habitat units sampled during May of 2010.
Unit |
Length (m) |
Width (m) |
Maximum depth (m) |
Tail crest depth (m) |
Instream Cover (m2) |
Cutbank (m) |
Cutbank depth (m) |
Main cover features |
Dominate Substrate |
Subdominate Substrate |
1 |
19.2 |
11.3 |
1.2 |
0.3 |
20 |
5 |
0.1 |
Depth, wood |
Boulder |
Cobble |
2 |
52 |
10.5 |
0.8 |
0.2 |
3 |
13 |
0.3 |
Undercut banks |
Boulder |
Cobble |
3 |
8.1 |
2.4 |
0.3 |
0.1 |
1 |
1 |
0.1 |
Velocity |
Cobble |
Gravel |
4 |
22.4 |
10.5 |
0.3 |
0.1 |
0 |
0 |
0 |
Stream bottom |
Cobble |
Gravel |
5 |
27 |
7 |
1.1 |
0.2 |
1 |
8 |
0.2 |
Depth |
Gravel |
Pebble |
6 |
7 |
5.2 |
1.3 |
0.1 |
0 |
3 |
0.2 |
Depth |
Cobble |
Gravel |
Table 7. Time and sample ability of each unit sample in the Elwha River
Unit |
Snorkel time (min) |
Shock time (min) |
Seine time (min) |
Snorkelability |
Shockability |
Seinability |
1 |
16 |
48 |
40 |
5 |
2 |
4 |
2 |
15 |
37 |
53 |
5 |
3 |
3 |
3 |
4 |
10 |
5 |
5 |
5 |
4 |
4 |
4 |
15 |
12 |
5 |
5 |
5 |
5 |
8 |
15 |
23 |
5 |
3 |
3 |
6 |
4 |
20 |
20 |
5 |
1 |
1 |
Figure 10. Conceptual graph of “sample ability index.”
Eletroshocking
1 2 3 4 5
Consistently deep Sporatically deep
Consistently shallow Roughness everywhere Roughness but in
specified places No obstructions such as wood Short or long Relatively long
Relatively short
Seining
1 2 3 4 5
Large variation in depth Deep but consistent
Consistently shallow Roughness everywhere Roughness but in
specified places No obstructions such as wood Short or long Relatively long
Relatively short
Snorkeling
1 2 3 4 5

Very shallow, Moderately deep Deep Lots of wood everywhere, Some cover
such as wood Wood specified areas to view Longer unit Long unit
Table 8. Total catch by species, age class and origin (hat=hatchery).
|
2005 |
2006 |
2007 |
2008 |
2009 |
bull trout |
1 |
1 |
0 |
0 |
0 |
Chinook 0+ |
5011 |
3376 |
266 |
641 |
1035 |
Chinook 1+ |
0 |
51 |
51 |
1 |
36 |
Chinook hatchery |
4997 |
3898 |
0 |
0 |
NA |
chum |
5255 |
8698 |
1313 |
2208 |
2813 |
coho 0+ |
2696 |
4527 |
129 |
105 |
1276 |
coho 1+ |
1098 |
310 |
68 |
17 |
21 |
coho hatchery |
204 |
227 |
11 |
8 |
6 |
cottids |
141 |
191 |
14 |
629 |
730 |
cutthroat |
4 |
0 |
0 |
0 |
NA |
eulachon |
20 |
20 |
1 |
1 |
3 |
lamprey |
24 |
34 |
4 |
17 |
32 |
pink |
0 |
690 |
0 |
288 |
272 |
starry flounder |
5 |
0 |
0 |
0 |
NA |
steelhead |
0 |
172 |
17 |
5 |
2 |
steelhead hatchery |
283 |
345 |
38 |
29 |
0 |
stickleback |
8 |
38 |
6 |
1 |
0 |
trout 0+ |
53 |
17 |
2 |
3 |
2 |
trout 1+ |
149 |
20 |
3 |
6 |
0 |
trout 2+ |
96 |
7 |
1 |
9 |
1 |
Table 9. Estimates and 95% confidence intervals for the Chinook 0+, pink and chum out migrants for the Elwha River.
Year |
Chinook 0+ |
pink |
chum |
2005 |
17,4019 (±165,924, 182,115) |
0 (±0,0) |
157,125 (±148,621, 165,629) |
|
|
|
|
2006 |
119,357 (±115,914,122,800) |
21,375 (±20,478, 22,271) |
276719 (±271,777, 281,661) |
|
|
|
|
2007 |
14,309 (±10,819, 17,798) |
0 (±0,0) |
58473 (±49,717, 67,229) |
|
|
|
|
2008 |
18,603 (±16,678, 20,528) |
7,052 (±5,992, 8,112) |
46884 (±44,031, 49,736) |
|
|
|
|
2009 |
13,812 (±12,923, 14,702) |
4,129 (±3,630, 4,628) |
45336 (±43,450, 47,222) |
Figure 11. Total number of identified by snorkeling or captured by electroshocking or seining from six units in one side-channel of the Lower Elwha River 2010. Clear boxes indicate average for each method, while solid bars with hash marks at upper and lower end indicate the standard error (S.E.) for each method.
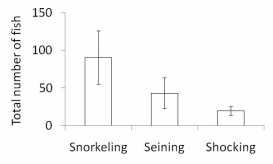
Figure 12. Total number of a. juvenile Chinook salmon, b. juvenile coho salmon, and c. juvenile rainbow trout/steelhead identified by snorkeling or captured by electroshocking or seining from six units in one side-channel of the Lower Elwha River 2010. Clear boxes indicate average for each method, while solid bars with hash marks at upper and lower end indicate the standard error (S.E.) for each method.
a.
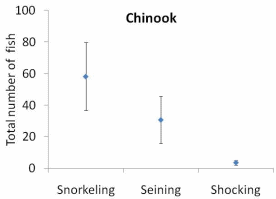
b.
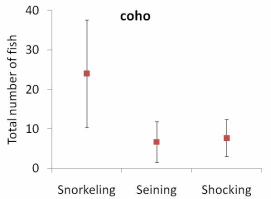
c.
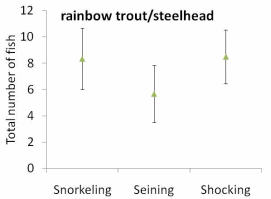
Figure 13. Difference in sample ability between snorkeling and the other methods (either electroshocking or seining) v. % see during snorkel v. the other methods. The greater the difference in sample ability the greater the degree of difficulty in using either electroshocking or seining relative to the snorkelability for a given area of stream.
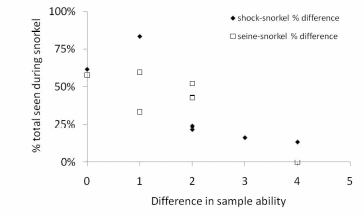
Figure 14. Differences in the size class distribution of a. juvenile Chinook salmon, b. juvenile coho salmon, and c. juvenile rainbow trout/steelhead captured by electroshocking and seining from six units in one side-channel of the Lower Elwha River 2010.
a.
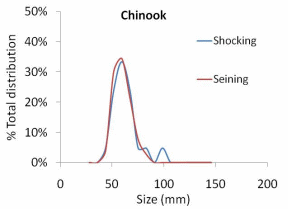
b.
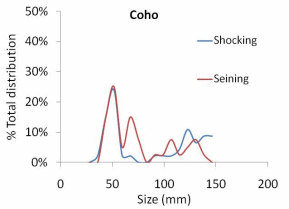
c.
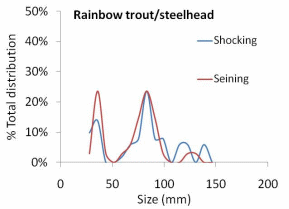
Figure 15. Plots illustrating the process of estimating total Chinook 0+ out migrants for 2009. The top panel shows the catch data in gray, the loess model fit to the data (the line), and the interpolated values where catch data was missing (black bars). The middle panel shows efficiency over time, and the bottom panel is the final estimate of total out migrants.
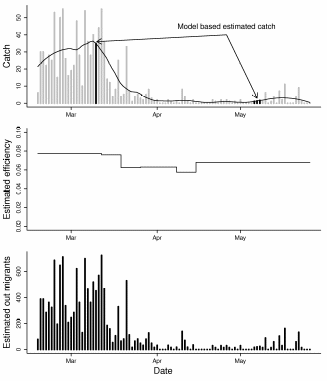
Figure 16. Trends in total out migrants for Chinook 0+, pink and chum salmon. The solid line represents the Elwha estimates and the dashed line the Dungeness River estimates. For pink salmon the Dungeness estimates were multiplied by the mean of the Elwha series divided by the mean of the Dungeness series in order to place the values on a comparable scale (raw Dungeness values are much higher than the Elwha values).
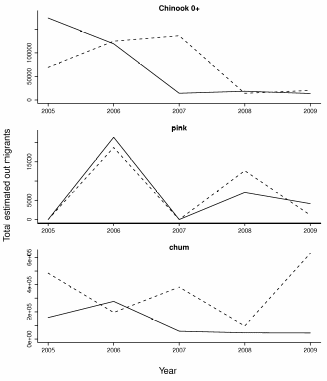
Figure 17: Total estimated out migrants for 2005-2009, Chinook 0+, chum, and pink (the species for which efficiency estimates were deemed reliable).
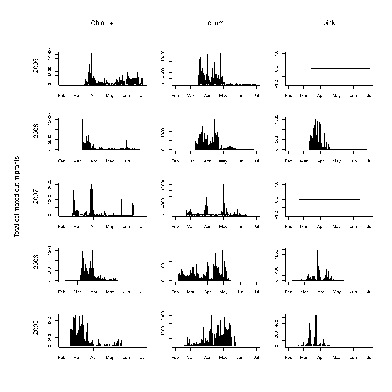
Figure 18. Total catch for 2005-2009, Chinook 1+, coho 1+, and steelhead (the species with larger bodied smolts for which efficiency estimates were deemed unreliable).
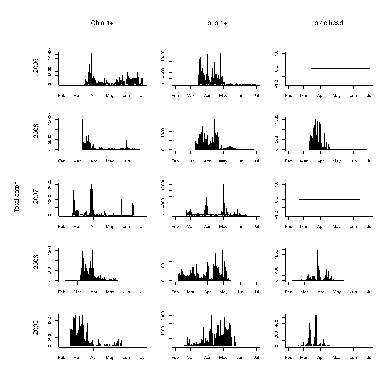
Habitat surveys - How does spawning habitat quantity and quality vary by habitat type, spatial location, and pre and post dam removal?
Table 10. Data collect for habitat quality parameters – residual pool depth and particle size distribution.
Site |
Longitude |
Latitude |
Reach location |
River mile |
River kilometer |
Pool length |
Pool width |
Stream bankfull width |
Pool maximum depth |
Pool tail depth |
Pool residual pool depth |
Riffle area upstream |
Riffle area downstream |
Particle size for each rock measured (200 per riffle, 100 on the upstream side and 100 on the downstream side) |
Table 11. Distribution of particle size distribution between the middle and lower Elwha River. Standard error is in parentheses.
Particle Size (mm) |
Lower Elwha |
Middle Elwha |
D16 |
52 (±4) |
52 (±4) |
D50 |
114 (±7) |
136 (±6) |
D75 |
170 (±9) |
230 (±8) |
D84 |
202 (±10) |
275 (±9) |
Table 12. Average particle size distribution for each riffle crest sampled in the Lower and Middle Elwha River 2009. Bold indicates that p-value was less than 0.10.
Location
|
Upstream(mm)
|
Downstream (mm)
|
P – value |
p2 |
110 |
103 |
0.373 |
p4 |
110 |
133 |
0.036 |
p8 |
83 |
92 |
0.150 |
p100 |
250 |
240 |
0.650 |
p101 |
247 |
451 |
0.157 |
p102 |
284 |
193 |
0.002 |
p103 |
283 |
426 |
0.472 |
p105 |
169 |
189 |
0.240 |
p107 |
142 |
139 |
0.792 |
p108 |
93 |
77 |
0.166 |
p109 |
141 |
142 |
0.942 |
p110 |
97 |
80 |
0.074 |
p111 |
116 |
127 |
0.270 |
p112 |
98 |
104 |
0.417 |
p113 |
102 |
118 |
0.100 |
p114 |
104 |
118 |
0.096 |
lerc6 |
51 |
53 |
0.892 |
lep7 |
66 |
92 |
0.003 |
lerc10 |
82 |
111 |
0.007 |
lep12 |
121 |
124 |
0.757 |
lep13 |
112 |
123 |
0.235 |
lep114 |
107 |
90 |
0.030 |
lep115 |
123 |
143 |
0.068 |
mep1 |
163 |
200 |
0.035 |
mep2 |
200 |
221 |
0.258 |
merc3 |
173 |
183 |
0.554 |
mep4 |
121 |
151 |
0.048 |
mep5 |
122 |
158 |
0.017 |
mep6 |
175 |
195 |
0.357 |
mep7 |
190 |
197 |
0.671 |
mep8 |
185 |
159 |
0.134 |
mep9 |
204 |
152 |
0.026 |
mep10 |
145 |
178 |
0.092 |
mep11 |
167 |
141 |
0.289 |
mep12 |
168 |
204 |
0.097 |
mep13 |
124 |
140 |
0.294 |
mep14 |
204 |
186 |
0.404 |
mep115 |
118 |
148 |
0.005 |
mep116 |
123 |
149 |
0.036 |
Figure 19. Conceptual graph of residual pool depth (Maximum depth – tail depth) pre and post dam removal in the Elwha River. The goal is to capture change in the depth of pool habitats and the change in streambed size due to the influx of sediment that occurs with dam removal.
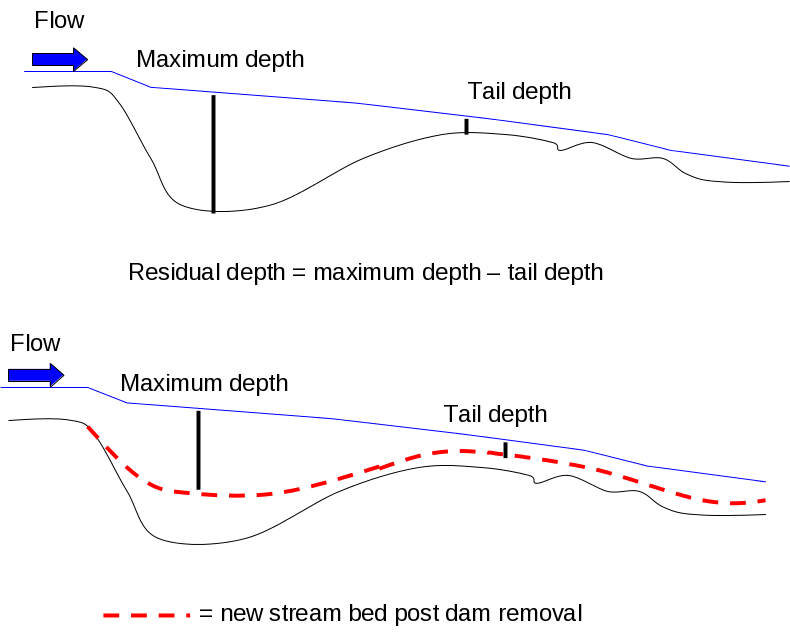
Figure 20. Percent area spawnable as a function of the percent fraction that is immobile. Adopted from Wooster et al. 2009. Percent spawnable for pink salmon is y = -4E-05*%fraction immobile4 + 0.0036*%fraction immobile 3 - 0.1233*%fraction immobile 3 + 1.3548*%fraction immobile + 94.55. Percent spawnable for Chinook salmon is y = -2E-05*%fraction immobile4 + 0.0002*%fraction immobile 3 =0.0281*%fraction immobile 3 - 0.7958*%fraction immobile + 45.10.
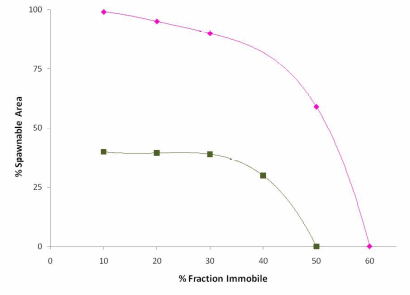
Figure 21. Map of residual pool depth and pebble count locations in the a. Lower and b. Middle Elwha River.
a.
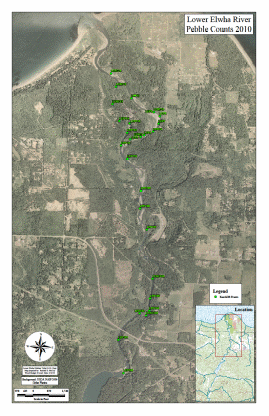

b.
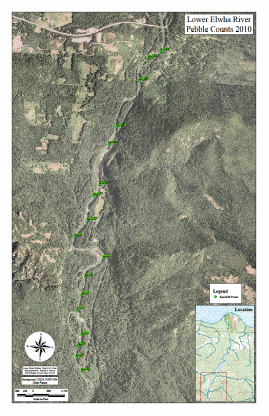

Figure 22. a. Trend in stream bed particle size in Middle and Lower Elwha River. b. Trend in stream bed particle size in the Lower Elwha. D50 = 19.77 (Rkm) + 45.51, R² = 0.63. c. Trend in stream bed particle size in the Middle Elwha. D50 = 4.88 (Rkm) + 61.13, R² = 0.17.
a.
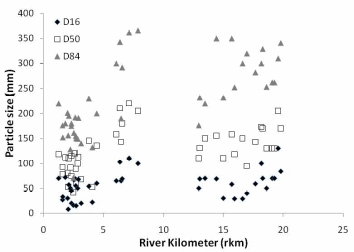
b.
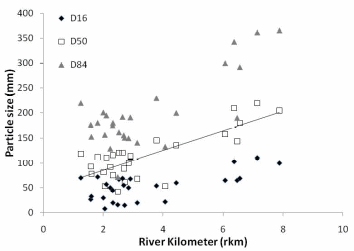
c.
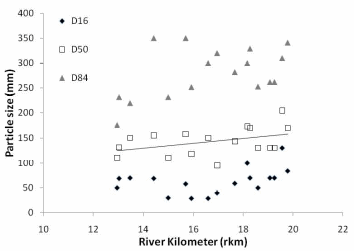
Figure 23. Residual pool depth in the Lower and Middle Elwha River.
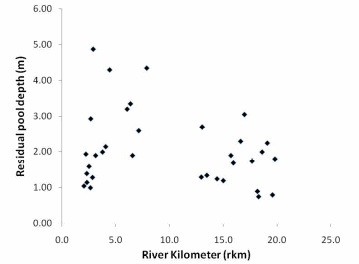
Figure 24. A comparison of residual pool in the Lower Elwha River – 2000 v. 2009.
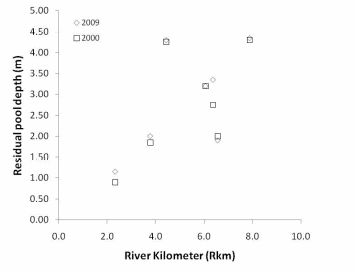
Figure 25. Percent fraction immobile by species in the Middle and Lower Elwha River.
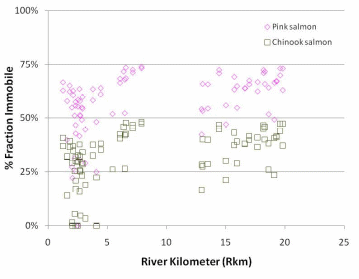
Figure 26. Percent spawnable by species in the Middle and Lower Elwha River.
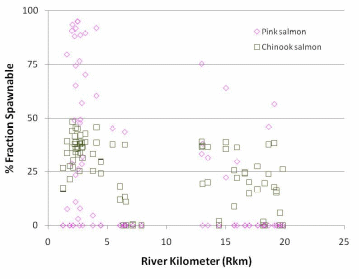
Appendices
Appendix A - Adult enumeration - Using imaging sonar to count adult Chinook passage into the lower river
On the Elwha, NOAA fisheries and the Lower Elwha Klallam Tribe (LEKT) have run an imaging SONAR project to enumerate summer Chinook in 2008 and 2009 and winter steelhead in 2009. A multi-beam, imaging SONAR was active in the Hunt’s road side channel (RKM 2.5) from August 16th to September 25th, 2008 and from June 1st to September 30th, 2009. The SONAR setup includes a BlueView Technologies, Proviewer (900 kHz, P900-20) imaging SONAR unit powered by an array of four solar panels which continuously charge six 12-volt batteries. Blueview proprietary software records hour long (1 GB) files onto a hard drive which is downloaded every 2 weeks. The SONAR project records an extraordinary amount of data; ~ 1000 hours in 2008 and ~2500 hours in 2009, therefore the data must be subsampled. Ten minute sections were counted from each even hour of data and counts were bootstrapped to fill in the uncounted portions of the data (Lilja et al. 2008). In addition to raw count information, data on fish size and the general quality of the fish image was collected for the 2009 data. Multiple observers also analyzed specific sets of data in 2009. This additional data will allow us to add confidence intervals to our estimates and determine the major sources of error in our analysis.
Appendix B - Juvenile and adult enumeration - An analysis of existing baseline conditions of relative juvenile and adult salmonid distribution and abundance across the Elwha River (Taken from a paper that is currently being written by Sam Brenkman, Jeff Duda, Roger Peters, Christian Torgerson, Ethan Welty, and George Pess)
Introduction
Snorkeling provides the best balance of effectiveness and efficiency for enumerating fish over long stretches of small to large streams with deeper, more complex habitat. Snorkeling can also be used to identify associations between a few species and river habitat at the reach or section scale. Snorkeling extensive sections of river allows us to develop a baseline condition of relative juvenile and adult salmonid distribution and abundance across the entire Elwha River, including the largest section – the area above both dams. This baseline information is critical to help in identifying the correlation between habitat characteristics, fish species, and fish size class and will help determine why specific patterns occur pre and post dam removal. It will also help identify how fish response is related to habitat condition change over time.
Aquatic environments are inherently difficult to sample, and large systems such as the Elwha River pose numerous challenges to collecting information about fish populations. The use of traditional fisheries methods is particularly challenging in the Elwha River because of prolonged periods of high flow, low water visibility from glacial melt, difficult access in rugged wilderness areas, and restrictions on allowable sampling methods in National Park waters. These challenges are compounded by the presence of migratory fishes, whose extensive movements in rivers add complexity to sampling.
We conducted a 65 rkm survey of fish communities and habitat conditions to provide baseline data and facilitate inferences about salmon recolonization throughout the watershed following dam removal. The snorkel surveys were used to characterize the fish assemblage structure, spatial distribution, and relative abundances of salmonids in the Elwha River from the headwaters to the sea in August, 2007 and 2008. Our goal was to provide a basin-scale assessment of the fish populations and habitat conditions throughout the Elwha River over two consecutive years. Specific objectives were to: a) determine the spatial extent of existing salmonids in the main stem river from rkm 65 to rkm 0; b) assess the patterns of species composition, abundance, and length classes across a longitudinal gradient of consecutive habitat units; and c) assess longitudinal distribution of major habitat features throughout the river (e.g., habitat types, large woody debris, substrate types).
Methods
Longitudinal Surveys of Fish Species
We conducted spatially continuous snorkel surveys throughout 65 rkm of the Elwha River during summer low-flow periods in August, 2007 and in August and September, 2008. Snorkel surveys can provide precise and reliable estimates of fish abundance (Northcote and Wilkie 1963, Schill and Griffith 1984, Thurow 1994), provide longitudinal profiles of fish distributions (Torgersen et al. 2006), and are useful in the simultaneous assessment of multiple species. Useful in deep, clear rivers where the effectiveness of other methods is limited, snorkeling is often the only approach possible in roadless or wilderness areas because of the relatively small amount of equipment required (Thurow 1994). The upper sections of the Elwha River could not be effectively surveyed by boat or other wading techniques due to the depth of pools and difficult access. Additionally, the passive nature of the technique (e.g., no handling of fish) is conducive to sampling protected fish stocks that inhabit National Park waters where invasive methods are less desired.
In 2007 and 2008, 20 surveyors were divided into teams of four and distributed throughout 65 rkm. In each year, surveyors were professional biologists experienced in snorkel techniques and fish identification. To access remote sites in the uppermost portions of the watershed, we used pack mules to carry and distribute field sampling and camping equipment at strategically located base camps. Prior to the weeklong surveys, we also conducted aerial reconnaissance in a Cessna 172 to demark log jams and other hazards along the river and conducted foot surveys to denote the upstream and downstream ends of remote canyons with flagging to increase safety.
Two divers, one on each side of the river, proceeded downstream at the speed of the current and counted each species that was > 10 cm in length. Divers recorded length classes of bull trout and rainbow trout in categories of 10-20 cm, >20-30 cm, >30 cm. Three divers were used in the widest sections of the river in-between the dams and downstream of Elwha Dam. The diver on the left bank (looking downstream) counted and recorded fish from the midpoint of the river channel to the left bank. The diver on the right bank counted fish from the midpoint of the river channel to the right bank. We did not survey Lake Mills and Lake Aldwell, and were unable to survey three canyon sections (ca. 10.4 rkm) rendered inaccessible by prohibitively steep slopes and dangerous river crossings.
The primary targets were Pacific salmonids based on their relative abundance and ease of identification. When fish were observed in large aggregations or near wood jams, divers made two passes in their respective lanes and averaged the counts as necessary. Divers made frequent data recording stops (~every 100 m) to compare observations and minimize duplication of counts. Because of the difficulty in distinguishing between cutthroat trout and rainbow trout underwater, counts were combined as cutthroat/rainbow trout (hereafter trout). The snorkeling procedures were consistent in 2007 and 2008.
Longitudinal Surveys of Aquatic Habitat
In 2008, we conducted a spatially continuous habitat survey throughout the entire river concurrent with the fish survey. Following the two divers counting fish, two habitat surveyors walked downstream along gravel bars and measured physical habitat variables including: channel type (main, secondary, or side channel), habitat type (riffle, pool, glide-like riffle, and glide-like pool) according to Bisson et al. (1982), habitat unit length (m) and wetted width (m). Wetted width was measured at three locations for every unit, approximately 25 percent, 50 percent and 75 percent of the distance from the upstream end to downstream end of the unit. All distances were measured using laser range finders (TruPulse 200, Laser Technology Impulse).
We measured the extent of overhanging vegetation, boulders and log jams (fish cover) in each habitat unit. The percent of bank habitat with vegetation overhanging the wetted channel within 30 cm of the water surface was estimated visually. The percent of the habitat unit surface area with boulder cover (>256 mm) was also estimated visually. The number of wood pieces or aggregations (i.e. logjams) with wood pieces >10cm diameter base height was counted and the surface area of these jams was measured using laser range finders. The two divers counting fish relayed the dominant and subdominant substrate types and estimated the mean and maximum depth (m) of each habitat unit. Substrate was classified according to Cummins (1962) as bedrock (including hardpan clay), boulder (> 256 mm, including riprap), cobble (64-256 mm), gravel (2-64 mm), sand (< 2 mm), silt (< 0.6 mm) or organic debris.
A handheld GPS unit (Garmin GPSMap 60CSx) was used to map locations of each habitat unit, and the GPS tracklog function allowed the continuous collection of position data throughout the entire 65 rkm. Waypoints were recorded at the upstream and downstream ends of each habitat unit. During times of poor satellite geometry, where accurate position fixes were not possible, habitat unit lengths were measured with the laser rangefinder.
Spatially Continuous Fish and Habitat Relationship Analysis
We used several steps to correlate fish species abundance with physical habitat characteristics in the Elwha River Basin. We used species abundance (fish/km) as the response variable and stream habitat characteristics were the independent variables. We implemented a linear modeling approach using Akaike’s Information Criterion, adjusted for small sample sizes (AICc), to determine which model best fit the data (Burnham and Anderson 2002). The difference between the AICc of a candidate model and the one with the lowest AICc provided the ranking metric (∆AICc). Generally speaking, ∆AICc between 0 and 4 indicates substantial support for a model being as good as the best approximating model, ∆AICc between 4 and 7 represents less support, and ∆AICc of greater than 7 indicates very little support for a candidate model relative to the best model (Burnham and Anderson 2002). Akaike weights (wi) were calculated, representing the strength of evidence in favor of model i being the best model. The ratio of Akaike weights (wi /w j) indicates the plausibility of the best-fitting model compared to other models (Burnham and Anderson 2002). Models with an evidence ratio of 10 or less were considered plausible (Burnham and Anderson 2002). If models were not clearly the “best” model based on the preceding criteria, then models within three AICc were considered competing models and results were averaged to determine the maximum likelihood estimate for the intercept and each of the independent variables that are part of the models (Burnham and Anderson 2002, Haring and Fausch, 2002).
Results
Spatially Continuous Fish and Habitat Relationships
Correlating rainbow trout and bull trout abundance with habitat attributes from the different streams in the Elwha River basin revealed that several variables were consistently positively correlated including the amount of habitat area, substrate type, instream cover variables, and river section (Tables B1 through B3). Almost all the rainbow trout models (total and each size class) with the best AICc scores included total habitat area (Tables B1 and B3). The amount of boulder area or amount of instream boulder cover, log jam area or the number of log jams, and river section were in the majority of the best rainbow trout candidate models (Tables B1 and B3). Total habitat area and gravel (%) were in the all the bull trout candidate models with the best AICc scores (Tables B2 and B3). River section and the total number of log jams were the only other independent variables that were in the bull trout candidate models with the best AICc scores.
The relationship between rainbow trout/km and total habitat area and boulders (%) was always positive, while there was always a negative correlation between rainbow trout/km and river section or instream boulders (%) (Table B3). Log jam area and the number of log jams were, for the most part, positively correlated to rainbow trout/km (Table B3). Total habitat area, river section, and gravel (%) were positively correlated to bull trout/km, while the number of log jams was negatively correlated to bull trout/km (Table B3).
Discussion
Spatially Continuous Fish and Habitat Relationships
Habitat area, the amount of in-channel cover, and streambed particle size were important descriptive variables related to the abundance of rainbow and bull trout. An increase in habitat area alone, without changes to habitat types or increased resilience to disturbance, can result in an increase in the occurrence and abundance of animals (Steffan-Dewenter 2003). Bull trout persistence has previously been positively correlated to an increase in habitat area (Watson and Hillman 1997, Dunham and Reiman 1999), and has also been hypothesized to allow existing populations to be less vulnerable to natural and anthropogenic disturbance. This can reduce the potential for extinction, increase the potential for persistence, and result in larger populations in larger habitat areas (Lande 1993, Dunham Reiman 1999). An increase in habitat area has also been hypothesized to result in a greater diversity of habitat types that may be needed to promote life-stage specific survival of enough individuals to sustain populations (Haring and Fausch 2002). The occurrence and abundance of other adult salmonid species such as pink (Oncorhynchus gorbuscha), chum (O. keta), and Chinook salmon (O. tshawytscha) has also been correlated to increasing habitat area in Alaska (Pess 2009) and throughout the Pacific Rim (Liermann et al. 2009).
The amount of in-channel cover, regardless of type (e.g., boulder, wood, depth etc) has consistently been shown to be an important correlate to salmonid fish densities (Shirvell 1990, Fausch 1993, Beechie et al. 2005). O. mykiss have been shown to prefer boulder cover, overhead cover (Shirvell 1990; Fausch 1993), and wood cover (Beechie et al. 2005). The correlation between larger cover types and O. mykiss densities may, in part, be spurious and the result of competition with other species, or an artifact of their ability to occupy higher-velocity habitats (Bisson et al. 1988). Thus O. mykiss may choose habitats based on characteristics other than cover type, and simply the predominance of cobble– boulder cover (more than 50% of sample points with that cover type) suggests a preference that may not exist (Beechie et al. 2005).
Juvenile enumeration – An analysis of existing baseline conditions of relative juvenile and adult salmonid distribution and abundance across the Elwha River
Beechie, T. J., M. Liermann, E. M. Beamer, R. Henderson. 2005. A classification of habitat types in a large river and their use by juvenile salmonids. Transactions of the American Fisheries Society, 134:717-729.
Bisson, P.A., J.L. Nielsen, R.A. Palmason, and L.E. Grove. 1982. A system of naming habitat
types in small streams, with examples of habitat utilization by salmonids during low streamflow. Pages 62-73 in N.B. Armantrout, editor. Acquisition and utilization of aquatic habitat inventory information. American Fisheries Society, Bethesda, Maryland.
Bisson, P. A., K. Sullivan, and J. L. Nielsen. 1988. Channel hydraulics, habitat use, and body form of juvenile coho salmon, steelhead, and cutthroat trout in streams. Transactions of the American Fisheries Society 117:262–273.
Burnham, K. P., and D. R. Anderson. 2002. Model selection and multimodel inference: a practical information–theoretic approach. Second edition. Springer-Verlag, New York, New York, USA.
Dunham, J.B, and B.E. Rieman. 1999. Metapopulation structure of bull trout: influences of physical, biotic, and geometrical landscape characteristics. Ecological Applications 9:642-655.
Fausch, K. D. 1993. Experimental analysis of microhabitat selection by juveniles steelhead (Oncorhynchus mykiss) and coho salmon (O. kisutch) in a British Columbia stream. Canadian Journal of Fisheries and Aquatic Sciences 50:1198–1207.
Haring, A.L., and K.D. Fausch. 2002. Minimum habitat requirements for establishing translocated cutthroat trout populations. Ecological Applications. 12:535-551.
Liermann, M.C., R. Sharma, and C. Parken. 2010. Using accessible watershed size to predict management parameters for Chinook salmon, Oncorhynchus tshawytscha, populations with little or no spawner-recruit data: a Bayesian hierarchical modelling approach. Fish Ecology and Management 17: 40-51.
Magnuson, J.J., W.M. Tonn, A. Baneriee, J. Toivonen. 1998. Isolation vs. extinction in the assembly of fishes in small northern lakes. Ecology 79: 2941-2956
Northcote, T.G., and D.W. Wilkie. 1963. Underwater census of stream fish populations. Transactions of the American Fisheries Society 92,146-151.
Pess, G. R., D. R. Montgomery, E. A. Steel, R. E. Bilby, B. E. Feist, H. M. Greenberg. 2002. Landscape characteristics, land use, and coho salmon (Oncorhynchus kisutch) abundance, Snohomish River, Wash., USA. Canadian Journal of Fisheries and Aquatic Sciences, 59:613-623.
Pess,G.R. 2009. Patterns and processes of salmon colonization. University of Washington School of Aquatic and Fishery Sciences. Phd. dissertation. Seatt,e WA.
Rieman, B. E., and J. B. Dunham. 2000. Metapopulations and salmonids: a synthesis of life history patterns and empirical observations. Ecology of Freshwater Fish 9:51–64.
Schill, D.J., and J.S. Griffith. 1984. Use of underwater observations to estimate cutthroat trout abundance in the Yellowstone River. North American Journal of Fisheries Management 4, 479-487.
Shirvell, C. S. 1990. Role of instream rootwads as juvenile coho salmon (Oncorhynchus kisutch) and steelhead trout (O. mykiss) cover habitat under varying streamflows. Canadian Journal of Fisheries and Aquatic Sciences 47:852–861.
Steffan-Dewenter, I. 2003. Importance of habitat area and landscape context for species richness of bees and wasps in fragmented orchard meadows. Conservation Biology 17:1036 – 1044.
Thurow, R.F. 1994. Underwater Methods for Study of Salmonids in the Intermountain West. U.S. Forest Service, Intermountain Research Station, General Technical Report INT-GTR-307, Ogden, Utah.
Watson, G., and T. W. Hillman. 1997. Factors affecting the distribution and abundance of bull trout: an investigation at hierarchical scales. North American Journal of Fisheries Management 17:237–252.
Tables and Figures
Table B1. Model selection results for factors that affected Rainbow trout abundance (rainbow trout/km) in the Elwha River basin. Models are ranked from most plausible (∆AICc=0) to least plausible; p is the number of parameters. The ratio of Akaike weights (wI/wi) indicates the plausibility of the best fitting model (wI) compared to other models (wi).
Rainbow trout |
Model |
Log Likelihood |
p |
∆AICc |
Akaike weight (wi) |
R2 |
wI / wi |
Total |
Number of log jams, total habitat area, boulders (%)
|
-220.99 |
4 |
0.00 |
0.94 |
0.83 |
1.000
|
>10cm & < 20cm |
River section, log jam area, instream boulder cover (%) |
-170.84 |
4 |
0.00 |
0.28 |
0.86 |
1.000 |
|
River section, log jam area, mean depth |
-171.15 |
4 |
0.62 |
0.21 |
0.86 |
1.363 |
|
River section, log jam area, boulders (%) |
-171.76 |
4 |
1.84 |
0.11 |
0.86 |
2.509 |
|
River section, log jam area |
-173.36 |
3 |
2.55 |
0.08 |
0.84 |
3.578 |
|
River section, bull trout abundance, log jam area |
-172.21 |
4 |
2.74 |
0.07 |
0.85 |
3.935 |
|
River section, log jam area, SA_SI |
-172.39 |
4 |
3.10 |
0.06 |
0.85 |
4.711 |
|
River section, log jam area, gravel (%)
|
-172.59 |
4 |
3.49 |
0.05 |
0.85 |
5.726 |
>20cm & < 30cm |
Habitat area, boulders (%), instream overhanging vegetation (%)
|
-203.84 |
4 |
0.00 |
0.73 |
0.74 |
1.000 |
>30cm & <40cm |
River section, boulders (%), instream boulders (%) |
-172.31 |
4 |
0.00 |
0.39 |
0.77 |
1.000 |
|
Total habitat area, boulders (%), instream boulders (%) |
-172.38 |
4 |
0.14 |
0.36 |
0.77 |
1.072 |
|
Boulders (%), instream boulders (%), wetted width
|
-173.77 |
4 |
2.93 |
0.09 |
0.76 |
4.328 |
> 40cm |
Log jam area, total habitat area, instream boulders (%) |
-117.63 |
4 |
0.00 |
0.43 |
0.73 |
1.000 |
|
Total habitat area, instream boulders (%), wetted width |
-118.74 |
4 |
2.23 |
0.14 |
0.71 |
3.049 |
Table B2. Model selection results for factors that affected bull trout abundance (bull trout/km) in the Elwha River basin. Models are ranked from most plausible (∆AICc=0) to least plausible; p is the number of parameters. The ratio of Akaike weights (wI/wi) indicates the plausibility of the best fitting model (wI) compared to other models (wi).
Bull trout |
Model |
Log Likelihood |
p |
∆AICc |
Akaike weight (wi) |
R2 |
wI / wi |
Total |
River section, total habitat area, gravel (%) |
-129.87 |
4 |
0.00 |
0.58 |
0.45 |
1.000 |
|
Number of log jams, total habitat area, gravel (%)
|
-131.74 |
4 |
3.74 |
0.09 |
0.40 |
6.488 |
>40cm |
River section, total habitat area, gravel (%) |
-127.02 |
4 |
0.00 |
0.50 |
0.47 |
1.000 |
|
Number of log jams, total habitat area, gravel (%) |
-127.94 |
4 |
1.84 |
0.20 |
0.45 |
2.509 |
Table B3. Maximum-likelihood estimates of intercept and slope parameters for the “best approximating” models predicting rainbow trout and bull trout abundance. a. rainbow trout total and >10cm & <20cm. b. rainbow trout >20cm & <30cm, >30 & <40cm, and >40cm. c. bull trout. Standard errors are in parentheses.
a.
Rainbow trout |
Model |
Intercept |
Total habitat area |
River section |
Boulders (%) |
Log jams |
Log jam area |
Gravel |
Instream boulders |
Instream overhanging vegetation |
Mean depth |
Wetted width |
Bull trout |
SA_SI |
Total |
Number of log jams, total habitat area, boulders (%)
|
-111.96 (15.64) |
0.003 (0.0004) |
-- |
1.375 (0.280) |
4.034 (0.915) |
-- |
-- |
-- |
-- |
-- |
-- |
-- |
-- |
>10cm & <20cm |
River section, log jam area, instream boulder cover (%) |
36.555 (7.387) |
-- |
-15.225 (2.644) |
-- |
-- |
0.015 (0.001)
|
-- |
0.280 (0.127) |
-- |
-- |
-- |
-- |
-- |
|
River section, log jam area, mean depth |
18.788 (12.988)
|
-- |
-12.057 (3.125) |
-- |
-- |
0.016 (0.001) |
-- |
-- |
-- |
13.845 (6.736) |
-- |
-- |
-- |
|
River section, log jam area, boulders (%) |
30.227 (9.571) |
-- |
-13.164 (2.997) |
0.131 (0.076) |
-- |
0.016 (0.001) |
-- |
-- |
-- |
-- |
-- |
-- |
-- |
|
River section, log jam area |
41.078 (7.421) |
-- |
-15.426 (2.764)
|
-- |
-- |
0.015 (0.001) |
-- |
-- |
-- |
-- |
-- |
-- |
-- |
|
River section, bull trout abundance, log jam area |
40.914 (7.322) |
-- |
-14.936 (2.747) |
-- |
-- |
0.015) (0.001) |
-- |
--
|
-- |
-- |
-- |
-0.457 (0.313) |
-- |
|
River section, log jam area, SA_SI |
43.288 (7.532)
|
-- |
-17.144 (3.022) |
-- |
-- |
0.015 |
-- |
-- |
-- |
-- |
-- |
-- |
0.702 (0.523) |
|
River section, log jam area, gravel (%)
|
39.821 (7.457) |
-- |
-14.057 (2.978) |
-- |
-- |
0.015 (0.001) |
-1.05 (0.088) |
-- |
-- |
-- |
-- |
-- |
-- |
b.
Rainbow trout |
Model |
Intercept |
Total habitat area |
River section |
Boulders (%) |
Log jams |
Log jam area |
Gravel |
Instream boulders |
Instream overhanging vegetation |
Mean depth |
Wetted width |
Bull trout |
SA_SI |
>20cm & < 30cm |
Habitat area, boulders (%), instream overhanging vegetation (%)
|
-53.24 (1.471) |
0.002 (0.0003) |
-- |
0.656 (0.167) |
-- |
-- |
-- |
-- |
1.471 (0.465) |
-- |
-- |
-- |
-- |
>30cm & <40cm |
River section, boulders (%), instream boulders (%) |
25.539 (8.778) |
-- |
-7.994 (2.895) |
0.741 (0.081) |
-- |
-- |
-- |
-0.855 (0.145) |
-- |
-- |
-- |
-- |
-- |
|
Total habitat area, boulders (%), instream boulders (%) |
-6.096 (4.665) |
0.0004 (0.0001) |
-- |
0.658 (0.097) |
-- |
-- |
-- |
-0.731 (0.159) |
-- |
-- |
-- |
-- |
-- |
|
Boulders (%), instream boulders (%), wetted width
|
-6.246 (5.492) |
-- |
-- |
0.644 (0.116) |
-- |
-- |
-- |
-0.821 (0.155) |
-- |
-- |
0.532 (0.249) |
-- |
-- |
> 40cm |
Log jam area, total habitat area, instream boulders (%) |
-1.694 (1.362) |
0.0003 (0.00003) |
-- |
-- |
-- |
-0.0012 (0.0004) |
-- |
-0.086 (0.039) |
-- |
-- |
-- |
-- |
-- |
|
Total habitat area, instream boulders (%), wetted width |
-3.996 (1.458) |
0.0002 (0.00005) |
-- |
-- |
-- |
-- |
-- |
-1.228 (0.039) |
-- |
-- |
0.247 (0.068) |
-- |
-- |
c.
Bull trout |
Model |
Intercept |
Total habitat area |
River section |
Boulders (%) |
Log jams |
Log jam area |
Gravel |
Instream boulders |
Instream overhanging vegetation |
Mean depth |
Wetted width |
Rainbow trout |
SA_SI |
Total |
River section, total habitat area, gravel (%) |
-21.542 (5.874) |
0.0003 (0.0001) |
4.295 (1.541) |
-- |
-- |
-- |
0.167 (0.035) |
-- |
-- |
-- |
-- |
-- |
-- |
|
Number of log jams, total habitat area, gravel (%)
|
-5.985 (2.246) |
0.0002 (0.00005) |
-- |
-- |
-0.245 (0.125) |
-- |
0.210 (0.043) |
-- |
-- |
-- |
-- |
-- |
-- |
>40cm |
River section, total habitat area, gravel (%) |
-21.45 (5.505) |
0.0003 (0.00006) |
4.067 (1.444) |
-- |
-- |
-- |
0.164 (0.032) |
-- |
-- |
-- |
-- |
-- |
-- |
|
Number of log jams, total habitat area, gravel (%) |
-6.68 (2.059) |
0.0002 0.00004) |
-- |
-- |
-0.279 (0.114) |
-- |
0.213 (0.039) |
-- |
-- |
-- |
-- |
-- |
-- |
Appendix C - Foodweb - Primary and secondary productivity trends
Introduction
Primary and secondary producers serve vital roles in the structure and function of aquatic ecosystems. In medium and large rivers in particular (≥ 4th order), primary production by periphyton is a major food source for higher trophic levels (Thorp & Delong 2002). Secondary producers (e.g. aquatic invertebrates) serve as a direct food source for fish and strongly influence nutrient cycling and primary productivity (Merritt & Cummins 1996; Wallace & Webster 1996). As periphyton and invertebrates are directly associated with the benthos, they are likely to be profoundly influenced by both the presence and removal of dams (Bednarek 2001; Doyle et al. 2005; Thomson et al. 2005). The rapid response and recovery that periphyton and benthic invertebrates typically display to disturbance are also well suited to monitoring efforts seeking to capture ecological response trajectories to dam removal (Shannon et al 2001; Doyle et al. 2005). Along with fish, periphyton and benthic invertebrates are the best studied and most commonly included taxa in stream and river biological assessment protocols (Davis & Simon 1995; Barbour et al. 1999; Moulton et al. 2002). Thus, much is known about their biology, how they respond to different types of disturbance, and many regional datasets exist for comparative purposes.
In the Elwha River, the first reported study of benthic invertebrates was done by the University of Oregon in a report to the Lower Elwha Tribal Council (Li 1990). This work was expanded in the mid 1990’s with a survey conducted by the USGS Washington Water Science Center that examined 26 sites across the river basin (Munn et al 1996). In 2004, benthic invertebrate monitoring on the Elwha was taken up again by NOAA’s Northwest Fisheries Science Center and USGS’s Western Fisheries Research Center, who added periphyton as an additional sample parameter and sampled 52 sites over three years (Figure C1; Morley et al. 2008). Results from the three studies are similar. Morley et al. (2008) did not observe major shifts in total taxa richness across regulated and unregulated river sections, but did detect distinct differences in benthic invertebrate taxonomic composition above the dams compared to sites between and below (Figure C2). Similar patterns were observed by Munn et al. (1996). Periphyton biomass was consistently higher in regulated than unregulated sections (Morley et al. 2008)—a pattern though to reflect a high abundance of filamentous algae related to increased water temperature and water clarity, and decreased bed movement (Li 1990; Munn and Brusven 2004).
Another focus of foodweb research in the Elwha River has been on changes in nutrient dynamics following re-colonization by anadromous salmonids. With the majority of their body mass obtained at sea, adult salmon return to freshwater spawning grounds enriched with marine-derived nutrients (MDN). These MDN influence the productivity and ecology of freshwater ecosystems via deposition of carcasses, gametes, and excretion of waste when salmon complete their life cycle (Gende et al. 2002; Schindler et al. 2003). Understanding the dynamics associated with reintroduction of anadromous salmonids and the nutrient subsidy provided to their spawning habitats and surrounding ecosystems in an important component of evaluating the recovery of the Elwha River ecosystem, as well as the restoration of other salmon-bearing rivers. Tracing the movement and magnitude of MDN inputs into freshwater and riparian ecosystems is frequently done with stable isotope analysis, a technique which relies upon measuring the isotopic ratio of carbon and nitrogen heavy stable isotopes (more prevalent in marine environments) to their lighter counterparts (Fry 2006). In an extensive survey conducted from 2004-2006 across the Elwha basin, Duda et al (2010) found that δ15N was significantly higher in fish, stoneflies, black flies, periphyton, and macroalgae where salmon still have access (Figure C3). Fish and chloroperlid stoneflies were enriched in δ13C, but the values were more variable than in δ15N. For some taxa, there were also differences between the two river sections that lack salmon, suggesting that factors other than marine-derived nutrients are structuring longitudinal isotopic profiles. Water chemistry analyses confirmed earlier reports that the river is oligotrophic (Munn et al. 1999).
All of the above studies serve an important purpose of establishing baseline datasets to which post dam-removal comparisons can be made. Morley et al. (2008) and Duda et al. (2010) also serve as examples of the importance of standardizing data collection protocols, coordinating field collections among multiple collaborators, and incorporating detailed metadata at all steps along the way. Some examples of this documentation are found in the appendix of this report (e.g., Access database, Google Earth map files). From the studies described above, some useful foodweb metrics have emerged, and some data gaps remain. In Table C1 and Table C2 we focus on the question of how the presence of the Elwha dams has affected primary and secondary productivity and identify what foodweb research questions are currently addressed by ongoing monitoring efforts, and what questions are not being studied. We conclude with recommendations for appropriate foodweb response metrics for the Elwha and other dam removal monitoring efforts, and provide brief logistical information related to labor, time, and funding requirements at the current level of baseline monitoring.
Discussion
Recommendations for protocol use at Elwha and pre-dam removal conclusions
The suite of foodweb metrics that have been collected thus far in baseline studies on the Elwha should be continued and expanded upon as we move closer to post dam-removal monitoring. Metrics that are highly variable (e.g., standing crop of periphyton) should be supplemented by measures of rates and processes (e.g., algal growth rates and nutrient limitations status). Sampling should also be expanded beyond the late summer index period to capture natural seasonal variability. Greater effort should be made to link foodweb monitoring with fish monitoring efforts; for instance, by incorporating the collection of invertebrate drift and fish diet samples into ongoing monitoring efforts. For data gaps that are not currently being addressed, we recommend pursuing additional research funds and seeking to involve other researchers with complimentary expertise. Emphasis on methodological standardization and metadata development should continue on the Elwha, as well as across other dam removal monitoring efforts. An ultimate goal of Elwha dam removal monitoring is the testing of hypotheses across larger spatial and temporal scales.
The current foodweb monitoring described above can be accomplished with a crew of 2-3. Two people are ideal for benthic invertebrate sampling, while only one is needed for periphyton and water chemistry. If sample sites are relatively nearby, a 3 person crew can typically sample 3 sites in a day. Equipment costs are relatively low (< $1,000 to put together a complete sampling kit). With the exception of benthic invertebrate taxonomy, sample processing costs are generally < $25 per sample. It is typically most efficient and cost effective to send invertebrate samples to professional taxonomy labs for analysis. Cost per sample ranges from $200-400 depending on level of taxonomic resolution and total number of organisms counted. Measurements of algal growth rates and nutrient limitation status can also be done with a crew of two. Equipment costs are again low (< $750), but labor requirements greater due to the need for more frequent site visits, and pre and post sample processing requirements.
Literature Cited
Barbour, M.T., J. Gerritsen, B.D. Snyder, and J.B. Stribling. 1999. Rapid bioassessment protocols for use in streams and wadeable rivers: periphyton, benthic macroinvertebrates and fish, second edition. U.S. Environmental Protection Agency, Washington, D.C.
Bednarek, A.G. 2001. Undamming rivers: a review of the ecological impacts of dam removal. Environmental Management 27:803-814.
Clarke, K. R., and R. N. Gorley. 2006. Primer v6: User Manual/Tutorial. PRIMER-E, Plymouth, UK.
Davis, S.W. and T.P. Simon, editors. 1995. Biological assessment and criteria: tools for water resource planning and decision making. CRC Press, Boca Raton, FL.
Doyle, M. W., E. H. Stanley, C. H. Orr, A. R. Selle, S. A. Sethi, and J. M. Harbor. 2005. Stream ecosystem response to small dam removal: lessons from the Heartland. Geomorphology 71:227-244.
Duda, J.J., H..J. Coe, S.A. Morley, and K.K. Kloehn. 2010. Establishing spatial trends in water chemistry and stable isotopes (δ15N and δ 13C) in the Elwha River prior to dam removal and salmon recolonization. River Research and Applications DOI: 10.1002/rra.1413
Fry B. 2006. Stable Isotope Ecology. Springer: New York.
Gende SM, Edwards RT, Willson MF, Wipfli MS. 2002. Pacific salmon in aquatic and terrestrial ecosystems. Bioscience 52: 917-928.
Li, J. L. 1990. Macroinvertebrates of the Elwha River during high flow. Report prepared for the Lower Elwha Tribal Council, Port Angeles, WA.
Merritt, R. W., and Cummins, K. W. 1996. An introduction to the aquatic insects of North America. Kendall/Hunt Publishing Company, Dubuque, IA.
Morley, S.A., H.J. Coe, L.S. Dunphy, J.J. Duda, M.L. McHenry, B.R. Beckman. In Prep. Food web response to salmon carcass addition in the Elwha River. To be submitted to Canadian Journal of Aquatic and Fishery Sciences.
Morley, S.A, J.J. Duda, H.J. Coe, K.K. Kloehn. 2008. Benthic invertebrate and periphyton in the Elwha River basin: current conditions and predicted response to dam removal. Northwest Science 82: 179-198.
Moulton, S. R., J. G. Kennen, R. M. Goldstein, and J.A. Hambrook. 2002. Revised protocols for sampling algal, invertebrate, and fish communities as part of the National Water-Quality Assessment Program. US Geological Survey Open-File Report 02-150, Reston, VA.
Munn MD, Black RW, Haggland AL, Hummling MA, Huffman RL. 1999. An assessment of stream habitat and nutrients in the Elwha River basin: Implications for restoration. US Geological Survey Water-Resources Investigations Report 98-4223, Tacoma, WA.
Munn, M. D. and M. A. Brusven. 2004. The influence of Dworshak Dam on epilithic community metabolism in the Clearwater River, U.S.A. Hydrobiologia 513:121-127.
Munn, M. D., M. L. McHenry, and V. Sampson. 1996. Benthic macroinvertebrate communities in the Elwha River Basin, 1994-1995. U.S. Geological Survey Open-File Report 96-588, Tacoma, WA.
Sanderson, B.L., H.J. Coe, C.D. Tran, K.H. Macneale, D.L. Harstad, and A.B. Goodwin. 2009. Nutrient limitation of periphyton in Idaho streams: results from nutrient diffusing substrate experiments. Journal of the North American Benthological Society 28:832-845.
Schindler DE, Scheuerell MD, Moore JM, Gende SM, Francis TB, Palen WJ. 2003. Pacific salmon and the ecology of coastal ecosystems. Frontiers in Ecology and the Environment 1: 31-37.
Shannon, J. P., D. W. Blinn, T. McKinney, E. P. Benanti, K. P. Wilson, and C. O’Brien. 2001. Aquatic food base responses to the 1996 test flood below Glen Canyon Dam, Colorado River, Arizona. Ecological Applications 11:672-685.
Thomson, J. R., D. D. Hart, D. F. Charles, T. L. Nightengale, and D. M. Winter. 2005. Effects of removal of a small dam on downstream macroinvertebrate and algal assemblages in a Pennsylvania stream. Journal of the North American Benthological Society 24:192-207.
Thorp, J. H., and M. D. Delong. 2002. Dominance of autochthonous autotrophic carbon in food webs of heterotrophic rivers. Oikos 96:543-550.
Wallace, J. B. and J. R. Webster. 1996. The role of macroinvertebrates in stream ecosystem function. Annual Review of Entomology 41:115-139.
Tables and Figures
Table C1. Ongoing primary and secondary productivity research related to the Elwha River dam removal.
Category |
Metric |
Analysis |
Benthic invertebrates |
Numerical density, Total taxa richness, Relative abundance EPT taxa vs. Chironomidae taxa |
Analysis of similarities (ANOSIM), Pairwise similarity percentages (SIMPER) |
Periphyton |
Standing crop density (ash-free dry mass), Algal densities (chlorophyll-a), Algal growth rates Nutrient limitations (Morley et al., in prep; Sanderson et al. 2009) |
Analysis of Variance (ANOVA) |
Stable isotopes |
δ15N and δ13C values of fish, invertebrate, and algae tissues. |
Analysis of Variance (ANOVA) |
Water chemistry |
Concentration of total nitrogen, total phosphorous, nitrate, nitrite, ammonium
|
Analysis of Variance (ANOVA) |
Table C2. Primary and secondary productivity research NOT currently being examined related to the Elwha River dam removal.
Category |
Metric |
Drift patterns of aquatic invertebrates |
Drift rates by numerical abundance and biomass Relative abundance of aquatic v. terrestrial food sources |
Fish diet composition |
Relative abundance of different food sources (e.g., drift vs. benthos, invertebrate vs. fish) |
Periphyton taxonomic composition |
Taxonomic composition of algal, fungal, and microbial assemblages |
Hyporheic processes |
Exchange rates of water, nutrients, and invertebrates
|
F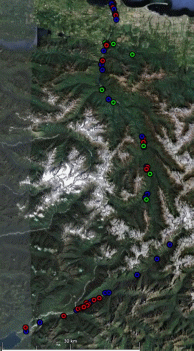 igure
C1. Locations of Elwha and Quinault Rivers foodweb monitoring
locations sampled from 2004-2006 for Morley et al (2006) and Duda et
al. (In Press). Blue circles indicate mainstem sites, red
circles indicate side channel sites, and green dots indicate
tributaries.
Figure C2. Non-metric multidimensional scaling (nMDS) plots of benthic invertebrate community composition data (√ transformed) collected from MS (filled), SC (open) and TR (shaded) habitats in LE (triangles), ME (squares), UE (circles) and QU (diamonds) (from Morley et al. 2008).
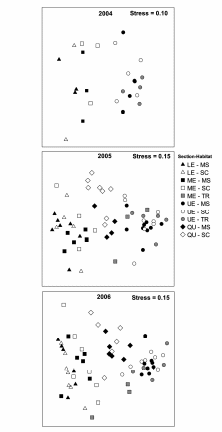
Figure C3. Plots of mean (SD) δ15N (ordinate) and δ13C (abscissa) values for macroalgae, periphyton, benthic invertebrates, and fish collected above (UE), between (ME), and below (LE) two dams in the Elwha River during 2005 and 2006 (combined).
(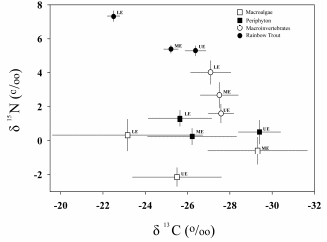 from
Duda et al. 2010)
1 In 2007 the 8’ trap was not operated due to a fatal car accident close to the trap site. A smaller 5’ trap was fished for part of the season.
|
Page
|
|
|
|
| File Type | application/vnd.openxmlformats-officedocument.wordprocessingml.document |
| File Title | Elwha River baseline monitoring report 2009 |
| Author | Pess, George |
| File Modified | 0000-00-00 |
| File Created | 2021-01-30 |
© 2026 OMB.report | Privacy Policy