FRS Form 1 (in BAL-003 Reliability Std)
FRS_FORM_1 (BAL-003 Reliability Std).xls
FERC-725R (NOPR in RM13-11) Mandatory Reliability Standards: Reliability Standard BAL-003-1.
FRS Form 1 (in BAL-003 Reliability Std)
OMB: 1902-0268
⚠️ Notice: This form may be outdated. More recent filings and information on OMB 1902-0268 can be found here:
Document [xlsx]
Download: xlsx | pdf
Data Entry
Form 714 Data
Adjustments
Variable Bias Supplemental Info
BA Form 2 Event Data
TimeZone Ref
Event Frequency Graphs
Frequency Response Initiative


Overview
InstructionsData Entry
Form 714 Data
Adjustments
Variable Bias Supplemental Info
BA Form 2 Event Data
TimeZone Ref
Event Frequency Graphs
Frequency Response Initiative
Sheet 1: Instructions
| Instructions | ||||||||
| Step 1 | Enter data in all green cells on the "Data Entry" worksheet. Cell G1 with the BA name. Cells R11 through R13 with contact information. Cell R24 with BA Bias Type, Fixed or Variable. | |||||||
| Step 2 | For identified events in column C of the "Data Entry" worksheet, collect data and complete one FRS Form 2 workbook for each event in the list. | |||||||
| Detailed Instructions for utilizing the "Adjustments" are located on the "Adjustments" worksheet below the table. | ||||||||
| Step 3 | PasteSpecial/Values data from FRS Form 2 "Form 1 Summary Data" worksheet into "BA Form 2 Event Data" worksheet of this workbook. Do this for each event in the list. | |||||||
| Step 4 | Enter FERC Form 714 data from the most recent completed Form 714 in the worksheet "Form 714 Data" in cells C7 through D18. Use Copy/PasteSpecial/Values to enter data. | |||||||
| Your current year's Frequency Response Obligation will be calculated in cell R20 of the "Data Entry" worksheet. | ||||||||
| Step 5 | a) If a Fixed Bias was selected, cell R27 will calculate the minimum Bias (least negative) allowed based on your Peak Demand or Peak Generation for Generation only BAs. | |||||||
| b) If a Fixed Bias was selected, cell R28 will calculate the minimum (in absolute terms) Bias allowed based on 100% of your FRM. | ||||||||
| c) If a Fixed Bias was selected, cell R29 will calculate the maximum Bias (in absolute terms) allowed based on 125% of your FRM. | ||||||||
| d) If R29 was more negative than the value in R27, you may choose a Bias setting that is between R29 and the lesser of R27 or R28 and enter it here. Based on your choice, your Bias Setting will appear in cell R33. | ||||||||
| Step 6 | a) If a Variable Bias was selected, cell R27 will indicate "not applicable" where there is no maximum or minimum Bias Setting. | |||||||
| b) If a Variable Bias was selected, enter "Variable" in cell R31. | ||||||||
| c) If a Variable Bias was selected, cell R30 will calculate the minimum Bias (in absolute terms) allowed based on your FRM and Peak Demand/Peak Generation. Calculate your monthly one minute average Variable Bias setting when frequency is lower than 59.964 Hz or higher than 60.036 Hz and enter these monthly values on the "Variable Bias Supplemental Info" worksheet in cells B2 through D13. | ||||||||
| d) If the "average annual Variable Bias Setting" in cell D14 on the "Variable Bias Supplemental Info" worksheet is less negative than cell E14 of this worksheet, R3 of the standard has not been met and cell D14 on the "Variable Bias Supplementa Info" worksheet will turn red. The average minimum Bias Setting will cover two different reporting periods and Cells J3 through K10 require past year's data from those year's Form 1s for this evaluation. | ||||||||
| e) Depending on when the Implementation date is each year for the annual Bias Setting, the ERO may be required to edit the selection of each months' minimum average FBS value. This should be completed by the ERO before each year's FRS Form 1 is published. | ||||||||
| f) The comparison to the FBS minimum will be from two previous year's analysis prior to the current year and the dates in the table starting at J3 will indicate the appropriate year's data to use. For example, if it is Feb 1, 2013 and you are calculating your 2012 FBS time weigted average, the minimum FBS value will be determined from your FRM that you calculated in Feb of 2012 and based on the Peak Demand/Peak Gen reported in June of 2011 for 2010 data. Enter each field in green using the appropriate year's data. | ||||||||
| Step 7 | Two FRMs are calculated. One for the BA Bias Setting and one for meeting R1 of the standard. | |||||||
| The FRM for the BA Bias Setting will use all selected events and all SEFRD values will use the delta frequency as measured. | ||||||||
| The FRM for the BA compliance to R1 will limit the delta frequency to no greater than those listed in Table 2 of Attachment A for each Interconnection. (Eastern +/-0.500 Hz, Western +/-0.500 Hz, ERCOT +/-0.700 Hz and HQ +/-1.500 Hz.) | ||||||||
| Step 7 | Save this workbook using the following file name format:NYISO_yyyy_FRS_Form_1.9.xlsx. (where NYISO is replaced with your Balancing Authority abbreviation). See cell "G74" on the Data Entry worksheet for your exact file name. | |||||||
| Step 8 | Send completed Form 1 and each Form 2 to NERC. | |||||||
Sheet 2: Data Entry
| Balancing Authority | MyBA | NERC FRS FORM 1 20 to 52 second Value B | Enter Addition Data in column W ==> | Information | Select Reason(s) for adjustment | Columns BA, BB, BC, BD, BE, BF and BG are reserved for calculation of the linear regression. | ||||||||||||||||||||||||||||||||||||||||||||||||||||
| Event | UTC (t-0) | Date/Time (t-0) | Time | Date/Time (t-0) | BA | BA | BA | Relay Lmt | Value "A" Information | Value "B" Information | SEFRD (FRM) | Exclude for | Enter Data in Green Highlighted Cells | Value "A" | Value "B" | BA Delta | 10 X BA | 10 X BA | SEFRDB | SEFRDR | Regression | |||||||||||||||||||||||||||||||||||||
| Time | Bias | R1 | for Bias | for R1 | NAI | DelFreq | DelFreq | (MW/0.1Hz) | (MW/0.1Hz) | Statistics | ||||||||||||||||||||||||||||||||||||||||||||||||
| Number | Date / Time (MM/DD/YY HH:MM:SS) |
(Central Prevailing) | Zone | BA Time | Zone | DelFreq | Time | DelFreq | DelFreq | NAI | Adjustment | NAI | Adjustment | (MW/0.1Hz) | (MW/0.1Hz) | data error * | 0.9 | Send copy to: | [email protected] | Load | Load | Reason(s) | For Bias | For R1 | For Bias | |||||||||||||||||||||||||||||||||
| 1 | 12/30/1899 6:00:00 | CST | 12/30/1899 0:00:00 | CST | 0:00:00 | 0.000 | 0.000 | 0.0 | 0.0 | 0.0 | 0.0 | #DIV/0! | 0.0 | N | 0.0 | 0.0 | 0.0 | -0.058 | 23.2 | Dynamic schedules for joint-owned units (DS) | 0 | 0 | 595 | #DIV/0! | 0 | #VALUE! | #VALUE! | |||||||||||||||||||||||||||||||
| 2 | 12/30/1899 6:00:00 | CST | 12/30/1899 0:00:00 | CST | 0:00:00 | 0.000 | 0.000 | 0.0 | 0.0 | 0.0 | 0.0 | #DIV/0! | 0.0 | N | 0.0 | 0.0 | 0.0 | -0.066 | 27.7 | Nonconforming load (NL) | 0 | 0 | 595 | #DIV/0! | 0 | #VALUE! | #VALUE! | |||||||||||||||||||||||||||||||
| 3 | 12/30/1899 6:00:00 | CST | 12/30/1899 0:00:00 | CST | 0:00:00 | 0.000 | 0.000 | 0.0 | 0.0 | 0.0 | 0.0 | #DIV/0! | 0.0 | N | 0.0 | 0.0 | 0.0 | -0.040 | 10.7 | Pumped hydro (PH) | 0 | 0 | 595 | #DIV/0! | 0 | #VALUE! | #VALUE! | |||||||||||||||||||||||||||||||
| 4 | 12/30/1899 6:00:00 | CST | 12/30/1899 0:00:00 | CST | 0:00:00 | 0.000 | 0.000 | 0.0 | 0.0 | 0.0 | 0.0 | #DIV/0! | 0.0 | N | 0.0 | 1900 | Bias Calculation Form 1 for Year | 0.0 | 0.0 | -0.052524929954899 | 80.6608905519758 | Invalid Data (ID) | 0 | 0 | 595 | #DIV/0! | 0 | #VALUE! | #VALUE! | |||||||||||||||||||||||||||||
| 5 | 12/30/1899 6:00:00 | CST | 12/30/1899 0:00:00 | CST | 0:00:00 | 0.000 | 0.000 | 0.0 | 0.0 | 0.0 | 0.0 | #DIV/0! | 0.0 | N | 0.0 | Eastern | Interconnection | 0.0 | 0.0 | -0.070905231294198 | -26.8976089613778 | Transfered Frequency Response (TFR) | 0 | 0 | 595 | #DIV/0! | 0 | #VALUE! | #VALUE! | |||||||||||||||||||||||||||||
| 6 | 12/30/1899 6:00:00 | CST | 12/30/1899 0:00:00 | CST | 0:00:00 | 0.000 | 0.000 | 0.0 | 0.0 | 0.0 | 0.0 | #DIV/0! | 0.0 | N | 0.0 | MyBA | Balancing Authority | 0.0 | 0.0 | -0.051906767345699 | 9.95544917881489 | Contingent BA adjustment for loss of units (CBA) | 0 | 0 | 595 | #DIV/0! | 0 | |||||||||||||||||||||||||||||||
| 7 | 12/30/1899 6:00:00 | CST | 12/30/1899 0:00:00 | CST | 0:00:00 | 0.000 | 0.000 | 0.0 | 0.0 | 0.0 | 0.0 | #DIV/0! | 0.0 | N | 0.0 | Contact Name | 0.0 | 0.0 | -0.058047703334303 | 3.36702401297433 | DS & NL | 0 | 0 | 595 | #DIV/0! | 0 | For R1 | |||||||||||||||||||||||||||||||
| 8 | 12/30/1899 6:00:00 | CST | 12/30/1899 0:00:00 | CST | 0:00:00 | 0.000 | 0.000 | 0.0 | 0.0 | 0.0 | 0.0 | #DIV/0! | 0.0 | N | 0.0 | Contact Phone # | 0.0 | 0.0 | -0.075572422572499 | 36.3344268798828 | DS & PH | 0 | 0 | 595 | #DIV/0! | 0 | 0 | 0 | ||||||||||||||||||||||||||||||
| 9 | 12/30/1899 6:00:00 | CST | 12/30/1899 0:00:00 | CST | 0:00:00 | 0.000 | 0.000 | 0.0 | 0.0 | 0.0 | 0.0 | #DIV/0! | 0.0 | N | 0.0 | Contact e-mail | 0.0 | 0.0 | -0.056380498976999 | 0.488253044359624 | DS & ID | 0 | 0 | 595 | #DIV/0! | 0 | 0 | #N/A | ||||||||||||||||||||||||||||||
| 10 | 12/30/1899 6:00:00 | CST | 12/30/1899 0:00:00 | CST | 0:00:00 | 0.000 | 0.000 | 0.0 | 0.0 | 0.0 | 0.0 | #DIV/0! | 0.0 | N | 0.0 |
|
0.0 | 0.0 | -0.057332901727598 | 2.75803693135579 | DS & TFR | 0 | 0 | 595 | #DIV/0! | 0 | 1 | 0 | ||||||||||||||||||||||||||||||
| 11 | 12/30/1899 6:00:00 | CST | 12/30/1899 0:00:00 | CST | 0:00:00 | 0.000 | 0.000 | 0.0 | 0.0 | 0.0 | 0.0 | #DIV/0! | 0.0 | N | 0.0 |
|
0.0 | 0.0 | -0.051760900588299 | 13.6434168815613 | DS & CBA | 0 | 0 | 595 | #DIV/0! | 0 | #N/A | 11 | ||||||||||||||||||||||||||||||
| 12 | 12/30/1899 6:00:00 | CST | 12/30/1899 0:00:00 | CST | 0:00:00 | 0.000 | 0.000 | 0.0 | 0.0 | 0.0 | 0.0 | #DIV/0! | 0.0 | N | 0.0 |
|
MWh Annual GenINT is the Sum of all Annual GenBA values in this interconnection | 0.0 | 0.0 | -0.049999237060547 | 11.1007459163666 | DS & NL & PH | 0 | 0 | 595 | #DIV/0! | 0 | 0 | 0 | |||||||||||||||||||||||||||||
| 13 | 12/30/1899 6:00:00 | CST | 12/30/1899 0:00:00 | CST | 0:00:00 | 0.000 | 0.000 | 0.0 | 0.0 | 0.0 | 0.0 | Y | MWh Annual LoadINT is the Sum of all Annual LoadBA values in this interconnection | 0.0 | 0.0 | -0.052 | -19.9068464835485 | DS & NL & ID | ||||||||||||||||||||||||||||||||||||||||
| 14 | 12/30/1899 6:00:00 | CST | 12/30/1899 0:00:00 | CST | 0:00:00 | 0.000 | 0.000 | 0.0 | 0.0 | 0.0 | 0.0 | Y | -964 | Interconnection Frequency Response Obligation (FRO) MW/0.1 Hz. Determined by ERO. | 0.0 | 0.0 | -0.055999755859375 | 12.3254643016391 | JOU DS & NL & TFR | |||||||||||||||||||||||||||||||||||||||
| 15 | 12/30/1899 6:00:00 | CST | 12/30/1899 0:00:00 | CST | 0:00:00 | 0.000 | 0.000 | 0.0 | 0.0 | 0.0 | 0.0 | Y | 1899 | Current data year (December thru November) | 0.0 | 0.0 | -0.058498382568359 | 0.750191847483315 | DS & NL & CBA | |||||||||||||||||||||||||||||||||||||||
| 16 | 12/30/1899 6:00:00 | CST | 12/30/1899 0:00:00 | CST | 0:00:00 | 0.000 | 0.000 | 0.0 | 0.0 | 0.0 | 0.0 | Y | #DIV/0! | 1900 BA Frequency Response Obligation (FRO) for next year's FRM | 0.0 | 0.0 | -0.048500061035156 | 2.23005777994791 | DS & NL & PH & ID | |||||||||||||||||||||||||||||||||||||||
| 17 | 12/30/1899 6:00:00 | CST | 12/30/1899 0:00:00 | CST | 0:00:00 | 0.000 | 0.000 | 0.0 | 0.0 | 0.0 | 0.0 | Y | 1899 BA Frequency Response Obligation (FRO) for this year's FRM from your last year's Form 1. | 0.0 | 0.0 | -0.045000076293945 | 9.47785933017731 | DS & NL & PH & TFR | ||||||||||||||||||||||||||||||||||||||||
| 18 | 12/30/1899 6:00:00 | CST | 12/30/1899 0:00:00 | CST | 0:00:00 | 0.000 | 0.000 | 0.0 | 0.0 | 0.0 | 0.0 | Y | 0.0 | 0.0 | -0.037502288818359 | 0.355309009552002 | DS & NL & PH & CBA | |||||||||||||||||||||||||||||||||||||||||
| 19 | 12/30/1899 6:00:00 | CST | 12/30/1899 0:00:00 | CST | 0:00:00 | 0.000 | 0.000 | 0.0 | 0.0 | 0.0 | 0.0 | Y | BA Bias Type and Bias Setting | 0.0 | 0.0 | -0.047500610351563 | 2.17070185343425 | DS & NL & PH & ID & TFR | ||||||||||||||||||||||||||||||||||||||||
| 20 | 12/30/1899 6:00:00 | CST | 12/30/1899 0:00:00 | CST | 0:00:00 | 0.000 | 0.000 | 0.0 | 0.0 | 0.0 | 0.0 | Y | Fixed | Bias Type utilized. | 0.0 | 0.0 | -0.055500030517578 | 29.3820742766062 | DS & NL & PH & ID & CBA | |||||||||||||||||||||||||||||||||||||||
| 21 | 12/30/1899 6:00:00 | CST | 12/30/1899 0:00:00 | CST | 0:00:00 | 0.000 | 0.000 | 0.0 | 0.0 | 0.0 | 0.0 | Y | 0.90% | Interconnection Minimum Fixed Frequency Bias Setting % of Peak Demand or Peak Generation (Set by ERO) | 0.0 | 0.0 | -0.047 | 4.60138130187988 | DS & NL & PH & ID & TFR & CBA | |||||||||||||||||||||||||||||||||||||||
| 22 | 12/30/1899 6:00:00 | CST | 12/30/1899 0:00:00 | CST | 0:00:00 | 0.000 | 0.000 | 0.0 | 0.0 | 0.0 | 0.0 | Y | 621018 | The Sum of the Non-Coincident peak demands for all Bas on the interconnection from FERC Form No. 714, provided by ERO. | 0.0 | 0.0 | -0.060000000000002 | 1.59351487954458 | NL & PH | |||||||||||||||||||||||||||||||||||||||
| 23 | 12/30/1899 6:00:00 | CST | 12/30/1899 0:00:00 | CST | 0:00:00 | 0.000 | 0.000 | 0.0 | 0.0 | 0.0 | 0.0 | Y | #DIV/0! | Your BA's lowest absolute Fixed Frequency Bias Setting based on interconnection non-coincident peak demand. | 0.0 | 0.0 | -0.059999999999995 | 52.3709077835083 | NL & ID | |||||||||||||||||||||||||||||||||||||||
| 24 | 12/30/1899 6:00:00 | CST | 12/30/1899 0:00:00 | CST | 0:00:00 | 0.000 | 0.000 | 0.0 | 0.0 | 0.0 | 0.0 | Y | #DIV/0! | Your BA's lowest absolute Fixed Frequency Bias Setting based on 100% of FRM. | 0.0 | 0.0 | -0.051000000000002 | 33.9478736718496 | NL & TFR | |||||||||||||||||||||||||||||||||||||||
| 25 | 12/30/1899 6:00:00 | CST | 12/30/1899 0:00:00 | CST | 0:00:00 | 0.000 | 0.000 | 0.0 | 0.0 | 0.0 | 0.0 | Y | #DIV/0! | Your BA's highest absolute Fixed Bias Setting: 125% of FRM. | 0.0 | 0.0 | -0.1 | 100 | NL & CBA | |||||||||||||||||||||||||||||||||||||||
| 26 | 12/30/1899 6:00:00 | CST | 12/30/1899 0:00:00 | CST | 0:00:00 | 0.000 | 0.000 | 0.0 | 0.0 | 0.0 | 0.0 | Y | n/a | Balancing Authority lowest absolute Variable Bias Setting (least negative one minute average Bias while frequency is less than 59.964 or greater than 60.036 Hz). | 0.0 | 0.0 | NL & PH & ID | |||||||||||||||||||||||||||||||||||||||||
| 27 | 12/30/1899 6:00:00 | CST | 12/30/1899 0:00:00 | CST | 0:00:00 | 0.000 | 0.000 | 0.0 | 0.0 | 0.0 | 0.0 | Y | -20.87 | Balancing Authority desired Bias Setting: May be set to a value between 100% to 125% of its FRM if this value is more negative than the minimum Bias based on Peak Demand. If not more negative, then the Bias must be the minimum Bias based on Peak Demand. If variable Bias is used, enter "Variable". | 0.0 | 0.0 | NL & PH & TFR | |||||||||||||||||||||||||||||||||||||||||
| 28 | 12/30/1899 6:00:00 | CST | 12/30/1899 0:00:00 | CST | 0:00:00 | 0.000 | 0.000 | 0.0 | 0.0 | 0.0 | 0.0 | Y | 0.0 | 0.0 | NL & PH & BAA | |||||||||||||||||||||||||||||||||||||||||||
| 29 | 12/30/1899 6:00:00 | CST | 12/30/1899 0:00:00 | CST | 0:00:00 | 0.000 | 0.000 | 0.0 | 0.0 | 0.0 | 0.0 | Y | #DIV/0! | 1900 Frequency Bias Setting - (minimum of 100% to 125% of FRM, or 0.9% of Historical Peak Demand if not Variable) | 0.0 | 0.0 | NL & PH & ID & TFR | |||||||||||||||||||||||||||||||||||||||||
| 30 | 12/30/1899 6:00:00 | CST | 12/30/1899 0:00:00 | CST | 0:00:00 | 0.000 | 0.000 | 0.0 | 0.0 | 0.0 | 0.0 | Y | 0.0 | 0.0 | N | NL & PH & ID & CBA | ||||||||||||||||||||||||||||||||||||||||||
| 31 | 12/30/1899 6:00:00 | CST | 12/30/1899 0:00:00 | CST | 0:00:00 | 0.000 | 0.000 | 0.0 | 0.0 | 0.0 | 0.0 | Y | #DIV/0! | 1899 FRM - Average Estimated Frequency Response MW/0.1 Hz using SEFRD for Bias | 0.0 | 0.0 | Y | NL & PH & ID & TFR & CBA | ||||||||||||||||||||||||||||||||||||||||
| 32 | 0:00:00 | 0.000 | 0.000 | 0.0 | 0.0 | 0.0 | 0.0 | Y | #VALUE! | 1899 FRM - Regression Estimated Frequency Response MW/0.1Hz using SEFRD for Bias | 0.0 | 0.0 | PH & ID | |||||||||||||||||||||||||||||||||||||||||||||
| 33 | 0:00:00 | 0.000 | 0.000 | 0.0 | 0.0 | 0.0 | 0.0 | Y | #DIV/0! | 1899 FRM - Median Estimated Frequency Response MW/0.1Hz using SEFRD for Bias | 0.0 | 0.0 | PH & TFR | |||||||||||||||||||||||||||||||||||||||||||||
| 34 | 0:00:00 | 0.000 | 0.000 | 0.0 | 0.0 | 0.0 | 0.0 | Y | 0.00 | 1899 FRM - Average Estimated Frequency Response MW/0.1 Hz using SEFRD for R1 | 0.0 | 0.0 | PH & CBA | |||||||||||||||||||||||||||||||||||||||||||||
| 35 | 0:00:00 | 0.000 | 0.000 | 0.0 | 0.0 | 0.0 | 0.0 | Y | 0.00 | 1899 FRM - Regression Estimated Frequency Response MW/0.1Hz using SEFRD for R1 | 0.0 | 0.0 | PH & ID & TFR | |||||||||||||||||||||||||||||||||||||||||||||
| 36 | 0:00:00 | 0.000 | 0.000 | 0.0 | 0.0 | 0.0 | 0.0 | Y | 0.00 | 1899 FRM - Median Estimated Frequency Response MW/0.1Hz for BA Compliance to R1, minimum Frequency Response | 0.0 | 0.0 | PH & ID & CBA | |||||||||||||||||||||||||||||||||||||||||||||
| 37 | 0:00:00 | 0.000 | 0.000 | 0.0 | 0.0 | 0.0 | 0.0 | Y | N | Do you RECEIVE Overlap regulation? | 0.0 | 0.0 | PH & TFR | |||||||||||||||||||||||||||||||||||||||||||||
| 38 | 0:00:00 | 0.000 | 0.000 | 0.0 | 0.0 | 0.0 | 0.0 | Y | If Yes, list the BA name and the associated Bias of that BA in the table below. | 0.0 | 0.0 | PH & CBA | ||||||||||||||||||||||||||||||||||||||||||||||
| 39 | 0:00:00 | 0.000 | 0.000 | 0.0 | 0.0 | 0.0 | 0.0 | Y | 0.0 | 0.0 | PH & ID & TFR | |||||||||||||||||||||||||||||||||||||||||||||||
| 40 | 0:00:00 | 0.000 | 0.000 | 0.0 | 0.0 | 0.0 | 0.0 | Y | Bias -MW/0.1 Hz | Balancing Authority | 0.0 | 0.0 | PH & ID & CBA | |||||||||||||||||||||||||||||||||||||||||||||
| 41 | 0:00:00 | 0.000 | 0.000 | 0.0 | 0.0 | 0.0 | 0.0 | Y | 0.0 | 0.0 | PH & TFR | |||||||||||||||||||||||||||||||||||||||||||||||
| 42 | 0:00:00 | 0.000 | 0.000 | 0.0 | 0.0 | 0.0 | 0.0 | Y | 0.0 | 0.0 | PH & CBA | |||||||||||||||||||||||||||||||||||||||||||||||
| PH & ID & TFR & CBA | ||||||||||||||||||||||||||||||||||||||||||||||||||||||||||
| RU & TFR | ||||||||||||||||||||||||||||||||||||||||||||||||||||||||||
| RU & CBA | ||||||||||||||||||||||||||||||||||||||||||||||||||||||||||
| RU & TFR & CBA | ||||||||||||||||||||||||||||||||||||||||||||||||||||||||||
| TFR & CBA | ||||||||||||||||||||||||||||||||||||||||||||||||||||||||||
| N | Do you PROVIDE Overlap regulation? | |||||||||||||||||||||||||||||||||||||||||||||||||||||||||
| If Yes, list the BA name and the associated Bias of that BA | N | |||||||||||||||||||||||||||||||||||||||||||||||||||||||||
| Y | ||||||||||||||||||||||||||||||||||||||||||||||||||||||||||
| Bias -MW/0.1 Hz | Balancing Authority | |||||||||||||||||||||||||||||||||||||||||||||||||||||||||
| Fixed | ||||||||||||||||||||||||||||||||||||||||||||||||||||||||||
| Variable | ||||||||||||||||||||||||||||||||||||||||||||||||||||||||||
| Instructions | Relay Limits | |||||||||||||||||||||||||||||||||||||||||||||||||||||||||
| Eastern | 59.5 | 60.5 | ||||||||||||||||||||||||||||||||||||||||||||||||||||||||
| Step 1 | Enter data in all green cells on this "Data Entry" worksheet. | Western | 59.5 | 60.5 | ||||||||||||||||||||||||||||||||||||||||||||||||||||||
| ERCOT | 59.3 | 60.7 | ||||||||||||||||||||||||||||||||||||||||||||||||||||||||
| Step 2 | For identified events in column B, collect data and complete FRS Form 2.9 for each event in the list. | HQ | 58.5 | 61.5 | ||||||||||||||||||||||||||||||||||||||||||||||||||||||
| Step 3 | PasteSpecial/Values data from FRS Form 2.9 "Form 1 Summary Data" into "BA Form 2 Data" worksheet of this workbook. Do this for each event in the list. | |||||||||||||||||||||||||||||||||||||||||||||||||||||||||
| Step 4 | Save this workbook using the following file name format:NYISO_yyyy_FRS_Form_1.9.xlsm and send a copy of this workbook and all FRS_Form 2 workbooks to NERC. (where NYISO is replaced with your BA name) | |||||||||||||||||||||||||||||||||||||||||||||||||||||||||
| MyBA_1900_FRS_Form_1.9.xlsm | ||||||||||||||||||||||||||||||||||||||||||||||||||||||||||
Sheet 3: Form 714 Data
| Report 714 Data (in MW) | |||||
| Part II Schedule 3 | |||||
| Column (b) | Column (j) | ||||
| Month | Peak Demand | ||||
| January | |||||
| February | Peak Demand: (Your BA from Form 714, column j of Part II - Schedule 3) | ||||
| March | |||||
| April | |||||
| May | |||||
| June | |||||
| July | |||||
| August | |||||
| September | |||||
| October | |||||
| November | |||||
| December | |||||
| Average | #DIV/0! | ||||
| Maximum | 0 | ||||
Sheet 4: Adjustments
| Balancing Authority | MyBA | JOU Dynamic Schedules |
Non conforming Load | Pumped Hydro | Not Used | Transferred Frequency Response | Contingent BA Adjustment | Net Total Adjustments | |||||||||||||
| Event | Date/Time (t-0) | Value A | Value B | Value A | Value B | Value A | Value B | Value A | Value B | Value A | Value B | Value A | Value B | Value B 20 to 52 seconds | |||||||
| Number | (Central Prevailing) | DelFreq | Adjustment | Adjustment | Adjustment | Adjustment | Adjustment | Adjustment | Adjustment | Adjustment | Adjustment | Adjustment | Adjustment | Adjustment | |||||||
| 1 | 0.0 | 0.0 | 0.0 | 0.0 | 0.0 | 0.0 | 0.0 | 0.0 | 0.0 | 0.0 | 0.0 | 0.0 | 0.0 | ||||||||
| 2 | 0.0 | 0.0 | 0.0 | 0.0 | 0.0 | 0.0 | 0.0 | 0.0 | 0.0 | 0.0 | 0.0 | 0.0 | 0.0 | ||||||||
| 3 | 0.0 | 0.0 | 0.0 | 0.0 | 0.0 | 0.0 | 0.0 | 0.0 | 0.0 | 0.0 | 0.0 | 0.0 | 0.0 | ||||||||
| 4 | 0.0 | 0.0 | 0.0 | 0.0 | 0.0 | 0.0 | 0.0 | 0.0 | 0.0 | 0.0 | 0.0 | 0.0 | 0.0 | ||||||||
| 5 | 0.0 | 0.0 | 0.0 | 0.0 | 0.0 | 0.0 | 0.0 | 0.0 | 0.0 | 0.0 | 0.0 | 0.0 | 0.0 | ||||||||
| 6 | 0.0 | 0.0 | 0.0 | 0.0 | 0.0 | 0.0 | 0.0 | 0.0 | 0.0 | 0.0 | 0.0 | 0.0 | 0.0 | ||||||||
| 7 | 0.0 | 0.0 | 0.0 | 0.0 | 0.0 | 0.0 | 0.0 | 0.0 | 0.0 | 0.0 | 0.0 | 0.0 | 0.0 | ||||||||
| 8 | 0.0 | 0.0 | 0.0 | 0.0 | 0.0 | 0.0 | 0.0 | 0.0 | 0.0 | 0.0 | 0.0 | 0.0 | 0.0 | ||||||||
| 9 | 0.0 | 0.0 | 0.0 | 0.0 | 0.0 | 0.0 | 0.0 | 0.0 | 0.0 | 0.0 | 0.0 | 0.0 | 0.0 | ||||||||
| 10 | 0.0 | 0.0 | 0.0 | 0.0 | 0.0 | 0.0 | 0.0 | 0.0 | 0.0 | 0.0 | 0.0 | 0.0 | 0.0 | ||||||||
| 11 | 0.0 | 0.0 | 0.0 | 0.0 | 0.0 | 0.0 | 0.0 | 0.0 | 0.0 | 0.0 | 0.0 | 0.0 | 0.0 | ||||||||
| 12 | 0.0 | 0.0 | 0.0 | 0.0 | 0.0 | 0.0 | 0.0 | 0.0 | 0.0 | 0.0 | 0.0 | 0.0 | 0.0 | ||||||||
| 13 | 0.0 | 0.0 | 0.0 | 0.0 | 0.0 | 0.0 | 0.0 | 0.0 | 0.0 | 0.0 | 0.0 | 0.0 | 0.0 | ||||||||
| 14 | 0.0 | 0.0 | 0.0 | 0.0 | 0.0 | 0.0 | 0.0 | 0.0 | 0.0 | 0.0 | 0.0 | 0.0 | 0.0 | ||||||||
| 15 | 0.0 | 0.0 | 0.0 | 0.0 | 0.0 | 0.0 | 0.0 | 0.0 | 0.0 | 0.0 | 0.0 | 0.0 | 0.0 | ||||||||
| 16 | 0.0 | 0.0 | 0.0 | 0.0 | 0.0 | 0.0 | 0.0 | 0.0 | 0.0 | 0.0 | 0.0 | 0.0 | 0.0 | ||||||||
| 17 | 0.0 | 0.0 | 0.0 | 0.0 | 0.0 | 0.0 | 0.0 | 0.0 | 0.0 | 0.0 | 0.0 | 0.0 | 0.0 | ||||||||
| 18 | 0.0 | 0.0 | 0.0 | 0.0 | 0.0 | 0.0 | 0.0 | 0.0 | 0.0 | 0.0 | 0.0 | 0.0 | 0.0 | ||||||||
| 19 | 0.0 | 0.0 | 0.0 | 0.0 | 0.0 | 0.0 | 0.0 | 0.0 | 0.0 | 0.0 | 0.0 | 0.0 | 0.0 | ||||||||
| 20 | 0.0 | 0.0 | 0.0 | 0.0 | 0.0 | 0.0 | 0.0 | 0.0 | 0.0 | 0.0 | 0.0 | 0.0 | 0.0 | ||||||||
| 21 | 0.0 | 0.0 | 0.0 | 0.0 | 0.0 | 0.0 | 0.0 | 0.0 | 0.0 | 0.0 | 0.0 | 0.0 | 0.0 | ||||||||
| 22 | 0.0 | 0.0 | 0.0 | 0.0 | 0.0 | 0.0 | 0.0 | 0.0 | 0.0 | 0.0 | 0.0 | 0.0 | 0.0 | ||||||||
| 23 | 0.0 | 0.0 | 0.0 | 0.0 | 0.0 | 0.0 | 0.0 | 0.0 | 0.0 | 0.0 | 0.0 | 0.0 | 0.0 | ||||||||
| 24 | 0.0 | 0.0 | 0.0 | 0.0 | 0.0 | 0.0 | 0.0 | 0.0 | 0.0 | 0.0 | 0.0 | 0.0 | 0.0 | ||||||||
| 25 | 0.0 | 0.0 | 0.0 | 0.0 | 0.0 | 0.0 | 0.0 | 0.0 | 0.0 | 0.0 | 0.0 | 0.0 | 0.0 | ||||||||
| 26 | 0.0 | 0.0 | 0.0 | 0.0 | 0.0 | 0.0 | 0.0 | 0.0 | 0.0 | 0.0 | 0.0 | 0.0 | 0.0 | ||||||||
| 27 | 0.0 | 0.0 | 0.0 | 0.0 | 0.0 | 0.0 | 0.0 | 0.0 | 0.0 | 0.0 | 0.0 | 0.0 | 0.0 | ||||||||
| 28 | 0.0 | 0.0 | 0.0 | 0.0 | 0.0 | 0.0 | 0.0 | 0.0 | 0.0 | 0.0 | 0.0 | 0.0 | 0.0 | ||||||||
| 29 | 0.0 | 0.0 | 0.0 | 0.0 | 0.0 | 0.0 | 0.0 | 0.0 | 0.0 | 0.0 | 0.0 | 0.0 | 0.0 | ||||||||
| 30 | 0.0 | 0.0 | 0.0 | 0.0 | 0.0 | 0.0 | 0.0 | 0.0 | 0.0 | 0.0 | 0.0 | 0.0 | 0.0 | ||||||||
| 31 | 0.0 | 0.0 | 0.0 | 0.0 | 0.0 | 0.0 | 0.0 | 0.0 | 0.0 | 0.0 | 0.0 | 0.0 | 0.0 | ||||||||
| 32 | 0.0 | 0.0 | 0.0 | 0.0 | 0.0 | 0.0 | 0.0 | 0.0 | 0.0 | 0.0 | 0.0 | 0.0 | 0.0 | ||||||||
| 33 | 0.0 | 0.0 | 0.0 | 0.0 | 0.0 | 0.0 | 0.0 | 0.0 | 0.0 | 0.0 | 0.0 | 0.0 | 0.0 | ||||||||
| 34 | 0.0 | 0.0 | 0.0 | 0.0 | 0.0 | 0.0 | 0.0 | 0.0 | 0.0 | 0.0 | 0.0 | 0.0 | 0.0 | ||||||||
| 35 | 0.0 | 0.0 | 0.0 | 0.0 | 0.0 | 0.0 | 0.0 | 0.0 | 0.0 | 0.0 | 0.0 | 0.0 | 0.0 | ||||||||
| 36 | 0.0 | 0.0 | 0.0 | 0.0 | 0.0 | 0.0 | 0.0 | 0.0 | 0.0 | 0.0 | 0.0 | 0.0 | 0.0 | ||||||||
| 37 | 0.0 | 0.0 | 0.0 | 0.0 | 0.0 | 0.0 | 0.0 | 0.0 | 0.0 | 0.0 | 0.0 | 0.0 | 0.0 | ||||||||
| 38 | 0.0 | 0.0 | 0.0 | 0.0 | 0.0 | 0.0 | 0.0 | 0.0 | 0.0 | 0.0 | 0.0 | 0.0 | 0.0 | ||||||||
| 39 | 0.0 | 0.0 | 0.0 | 0.0 | 0.0 | 0.0 | 0.0 | 0.0 | 0.0 | 0.0 | 0.0 | 0.0 | 0.0 | ||||||||
| 40 | 0.0 | 0.0 | 0.0 | 0.0 | 0.0 | 0.0 | 0.0 | 0.0 | 0.0 | 0.0 | 0.0 | 0.0 | 0.0 | ||||||||
| 41 | 0.0 | 0.0 | 0.0 | 0.0 | 0.0 | 0.0 | 0.0 | 0.0 | 0.0 | 0.0 | 0.0 | 0.0 | 0.0 | ||||||||
| 42 | 0.0 | 0.0 | 0.0 | 0.0 | 0.0 | 0.0 | 0.0 | 0.0 | 0.0 | 0.0 | 0.0 | 0.0 | 0.0 | ||||||||
| Sign Convention for scan data collected in Form 2 | Imports: MWs are - Exports: MWs are + |
Loads in MW as - | Load MW as - Generation MW as + |
Enter Gen MW as + | The transactional amount in MW Receiver enters - Deliverer enters + on Form 2 Data sheet |
Generation MW as + (If demand occurs due to gen loss, enter MW as - at value B) |
|||||||||||||||
| Instructions for utilizing Adjustments: | |||||||||||||||||||||
| 1) | Balancing Authorities making adjustments must retain evidence to verify: - Adjustment values are determined from scan-cycle data using Value A and Value B averaging periods. Scan-cycle data must be available if adjustments are made. - Adjustments are necessary to improve accuracy of calculations compared to using Net Actual Interchange solely. Said differently, unless an adjustment compensates for significant known error, it should not be made. However, as noted in the next item, once a decision to include an adjustment for one or more of the five types is made for one event, the entity must calculate adjustments for that (those) type(s) for all events except for the Contengent BA Adjustment which is only utilized for the events that you are contengent during that event. - Adjustments are included consistently for all events (e.g. if adjustments for nonconforming load are made for one event, the load must be included for all events, etc.). |
||||||||||||||||||||
| 2) | Dynamic Schedules: - Values use schedule sign convention. - Adjustments should include only dynamic schedules accounting for joint-owned units. Other dynamic schedules should be ignored. |
||||||||||||||||||||
| 3) | Nonconforming Loads: - Values must be negative numbers. |
||||||||||||||||||||
| 4) | Pumped Hydro: - Values for pumping must be negative values. - Values for generating must be positive values. |
||||||||||||||||||||
| 5) | Rampling Units: - Values are positive values. |
||||||||||||||||||||
| 6) | Transferred Frequency Response: - This value is the amount agreed upon between the entities expressed in MW/0.1 Hz. Form 2 will adjust this amount for the frequency deviation experienced. (e.g. if an entity agrees to provide 20 MW/0.1 Hz to another entity and a frequency event with a deviation of 50 mHz occurs, the delivering entity should enter +20 in the data column of Form 2 and the receiving entity should enter - 20. The spreadsheet will adjust the SEFRD for each entity by the 10 for this event.) - Values for the entity receiving the response must be entered as a negative number. - Values for the entity delivering the response must be entered as a positive number. - Values between entities must sum to zero. |
||||||||||||||||||||
| 7) | Contingent Balancing Authority Adjustment: - Data for Value A is the pre-contingency scan rate generation (+MW values) from the contingent unit(s). - Data for Value B is usually 0 MW, but may be the demand (-MW values) that remains on the system that was "netted" out by the now offline generation. |
||||||||||||||||||||
Sheet 5: Variable Bias Supplemental Info
| Month | Minimum FBS* for month | Maximum FBS* for month | Time weighted ** average FBS* for month | Time weighted ** minimum average FBS* for month | ||||||||||||||||||
| January | Balancing Authority: | MyBA | ||||||||||||||||||||
| Feburary | 1898 | Reporting period FRS Form 1 data | ||||||||||||||||||||
| March | 0.00 | 1898 Reporting period: Balancinig Authority FRM MW/0.1 Hz, enter from FRS Form 1 for that year's FRM. If not know enter zero. | ||||||||||||||||||||
| April | 1.00% | 1898 Reporting period: Interconnection Minimum Fixed Frequency Bias Setting % of Peak Demand or Peak Generation (Set by ERO) | ||||||||||||||||||||
| May | 1898 Reporting period: Your BA's Annual Peak Demand or Peak Gen for Gen only BAs from your BA Form 714. | |||||||||||||||||||||
| June | 0.00 | Your BA's lowest absolute Fixed Frequency Bias Setting based on BA Peak Demand (Peak Generation for Generation only BA) MW/0.1 Hz. | ||||||||||||||||||||
| July | 0.00 | Your BA's lowest absolute Fixed Frequency Bias Setting based on 100% of FRM. | ||||||||||||||||||||
| August | 0.00 | 1899 Minimum, lowest absolute, conditional average Frequency Bias Setting MW/0.1 Hz. | ||||||||||||||||||||
| September | 1898 Minimum, lowest absolute, conditional average Frequency Bias Setting MW/0.1 Hz. | |||||||||||||||||||||
| October | ||||||||||||||||||||||
| November | ||||||||||||||||||||||
| December | ||||||||||||||||||||||
| 0.0 | 0.0 | 1899 Average Annual Bias MW/0.1 Hz | ||||||||||||||||||||
| * Frequency Bias Setting (FBS) | ||||||||||||||||||||||
| ** Based on the one minute values used in BAL 001 when frequency is greater than 60.036 Hz or less than 59.964 Hz. |
Sheet 6: BA Form 2 Event Data
| Average P.U. Performance | #DIV/0! | #DIV/0! | #DIV/0! | #DIV/0! | #DIV/0! | #DIV/0! | #DIV/0! | #DIV/0! | #DIV/0! | #DIV/0! | #DIV/0! | #DIV/0! | #DIV/0! | ||||||||||||||||||||||||||||||||||
| PasteSpecial/Values the data copied from FRS Form 2 for each event. | Value A Data | BA Performance | Value B | 20 to 52 second Average Period Evaluation | Frequency Response Initiative - Additional Primary Frequency Response Evaluation Points | ||||||||||||||||||||||||||||||||||||||||||
| JOU | Non- | Transferred | Contingent | JOU | Non- | Transferred | Contingent | Average | Unadjusted | Unadjusted | Unadjusted | Unadjusted | Unadjusted | Adjusted | Adjusted | Adjusted | Adjusted | Adjusted | |||||||||||||||||||||||||||||
| Date | A Point | FPointA | A Value | t(0) Time | C Value | Net | Dynamic | Conforming | Pumped | Ramping | Frequency | BA | BA | BA | Bias | Net | Dynamic | Conforming | Pumped | Ramping | Frequency | BA | Initial | Initial | Sustained | BA | BA | Bias | Bias While | PFR | PFR | PFR | PFR | PFR | PFR | PFR | PFR | PFR | PFR | ||||||||
| Time | Hz | Hz | Hz | Actual | Schedules | Load | Hydro | Units | Response | Lost Generation | Bias | Load | Setting | Actual | Schedules | Load | Hydro | Units | Response | Lost Generation | Performance | Performance | Performance | Bias | Load | Setting | Hz > +/-0.036 | Performance | Performance | Performance | Performance | Performance | Performance | Performance | Performance | Performance | Performance | Maximum | Minimum | ||||||||
| Event | Date/Time | Frequency | Interchange | Imp(-) Exp (+) | Load (-) | Load (-) Gen (+) | Gen (+) | Rec (-) Del (+) | Load (-) Gen (+) | Setting | EPFR | Frequency | Interchange | Imp(-) Exp (+) | Load (-) | Load (-) Gen (+) | Gen (+) | Rec (-) Del (+) | Load (-) Gen (+) | Adjusted | Unadjusted | Setting | EPFR | Hz | @ T(+46) | @ T(+76) | @ T(+106) | @ T(+136) | @ T(+166) | @ T(+46) | @ T(+76) | @ T(+106) | @ T(+136) | @ T(+166) | Bias Setting | Bias Setting | |||||||||||
| Number | (Central Prevailing) | DelFreq | Hz | MW | MW | MW | MW | MW | MW | MW | MW/0.1 Hz | MW | MW | Hz | MW | MW | MW | MW | MW | MW | MW | P.U. | P.U. | P.U. | MW/0.1 Hz | MW | MW | MW/0.1 Hz | P.U. | P.U. | P.U. | P.U. | P.U. | P.U. | P.U. | P.U. | P.U. | P.U. | MW/0.1 Hz | MW/0.1 Hz | |||||||
| 1 | 12/30/1899 0:00 | 0.000 | |||||||||||||||||||||||||||||||||||||||||||||
| 2 | 12/30/1899 0:00 | 0.000 | |||||||||||||||||||||||||||||||||||||||||||||
| 3 | 12/30/1899 0:00 | 0.000 | |||||||||||||||||||||||||||||||||||||||||||||
| 4 | 12/30/1899 0:00 | 0.000 | |||||||||||||||||||||||||||||||||||||||||||||
| 5 | 12/30/1899 0:00 | 0.000 | |||||||||||||||||||||||||||||||||||||||||||||
| 6 | 12/30/1899 0:00 | 0.000 | |||||||||||||||||||||||||||||||||||||||||||||
| 7 | 12/30/1899 0:00 | 0.000 | |||||||||||||||||||||||||||||||||||||||||||||
| 8 | 12/30/1899 0:00 | 0.000 | |||||||||||||||||||||||||||||||||||||||||||||
| 9 | 12/30/1899 0:00 | 0.000 | |||||||||||||||||||||||||||||||||||||||||||||
| 10 | 12/30/1899 0:00 | 0.000 | |||||||||||||||||||||||||||||||||||||||||||||
| 11 | 12/30/1899 0:00 | 0.000 | |||||||||||||||||||||||||||||||||||||||||||||
| 12 | 12/30/1899 0:00 | 0.000 | |||||||||||||||||||||||||||||||||||||||||||||
| 13 | 12/30/1899 0:00 | 0.000 | |||||||||||||||||||||||||||||||||||||||||||||
| 14 | 12/30/1899 0:00 | 0.000 | |||||||||||||||||||||||||||||||||||||||||||||
| 15 | 12/30/1899 0:00 | 0.000 | |||||||||||||||||||||||||||||||||||||||||||||
| 16 | 12/30/1899 0:00 | 0.000 | |||||||||||||||||||||||||||||||||||||||||||||
| 17 | 12/30/1899 0:00 | 0.000 | |||||||||||||||||||||||||||||||||||||||||||||
| 18 | 12/30/1899 0:00 | 0.000 | |||||||||||||||||||||||||||||||||||||||||||||
| 19 | 12/30/1899 0:00 | 0.000 | |||||||||||||||||||||||||||||||||||||||||||||
| 20 | 12/30/1899 0:00 | 0.000 | |||||||||||||||||||||||||||||||||||||||||||||
| 21 | 12/30/1899 0:00 | 0.000 | |||||||||||||||||||||||||||||||||||||||||||||
| 22 | 12/30/1899 0:00 | 0.000 | |||||||||||||||||||||||||||||||||||||||||||||
| 23 | 12/30/1899 0:00 | 0.000 | |||||||||||||||||||||||||||||||||||||||||||||
| 24 | 12/30/1899 0:00 | 0.000 | |||||||||||||||||||||||||||||||||||||||||||||
| 25 | 12/30/1899 0:00 | 0.000 | |||||||||||||||||||||||||||||||||||||||||||||
| 26 | 12/30/1899 0:00 | 0.000 | |||||||||||||||||||||||||||||||||||||||||||||
| 27 | 12/30/1899 0:00 | 0.000 | |||||||||||||||||||||||||||||||||||||||||||||
| 28 | 12/30/1899 0:00 | 0.000 | |||||||||||||||||||||||||||||||||||||||||||||
| 29 | 12/30/1899 0:00 | 0.000 | |||||||||||||||||||||||||||||||||||||||||||||
| 30 | 12/30/1899 0:00 | 0.000 | |||||||||||||||||||||||||||||||||||||||||||||
| 31 | 12/30/1899 0:00 | 0.000 | |||||||||||||||||||||||||||||||||||||||||||||
| 32 | 12/30/1899 0:00 | 0.000 | |||||||||||||||||||||||||||||||||||||||||||||
| 33 | 12/30/1899 0:00 | 0.000 | |||||||||||||||||||||||||||||||||||||||||||||
| 34 | 12/30/1899 0:00 | 0.000 | |||||||||||||||||||||||||||||||||||||||||||||
| 35 | 12/30/1899 0:00 | 0.000 | |||||||||||||||||||||||||||||||||||||||||||||
| 36 | 12/30/1899 0:00 | 0.000 | |||||||||||||||||||||||||||||||||||||||||||||
| 37 | 12/30/1899 0:00 | 0.000 | |||||||||||||||||||||||||||||||||||||||||||||
| 38 | 12/30/1899 0:00 | 0.000 | |||||||||||||||||||||||||||||||||||||||||||||
| 39 | 12/30/1899 0:00 | 0.000 | |||||||||||||||||||||||||||||||||||||||||||||
| 40 | 12/30/1899 0:00 | 0.000 | |||||||||||||||||||||||||||||||||||||||||||||
| 41 | 12/30/1899 0:00 | 0.000 | |||||||||||||||||||||||||||||||||||||||||||||
| 42 | 12/30/1899 0:00 | 0.000 | |||||||||||||||||||||||||||||||||||||||||||||
Sheet 7: TimeZone Ref
| Full name | Abbreviation | Offset | Time zone |
| Atlantic Daylight Time | ADT | 3:00 | UTC - 3 hours |
| Atlantic Standard Time | AST | 4:00 | UTC - 4 hours |
| Central Daylight Time | CDT | 5:00 | UTC - 5 hours |
| Central Standard Time | CST | 6:00 | UTC - 6 hours |
| Eastern Daylight Time | EDT | 4:00 | UTC - 4 hours |
| Eastern Standard Time | EST | 5:00 | UTC - 5 hours |
| Mountain Daylight Time | MDT | 6:00 | UTC - 6 hours |
| Mountain Standard Time | MST | 7:00 | UTC - 7 hours |
| Pacific Daylight Time | PDT | 7:00 | UTC - 7 hours |
| Pacific Standard Time | PST | 8:00 | UTC - 8 hours |
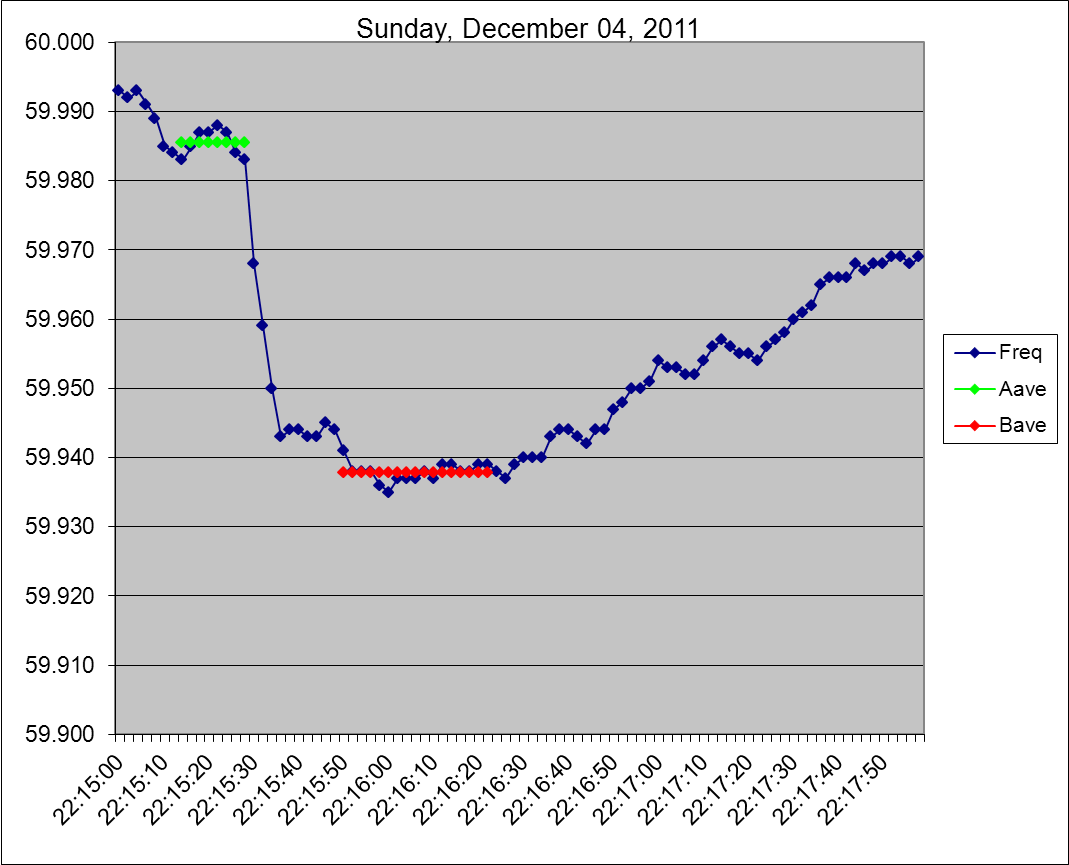
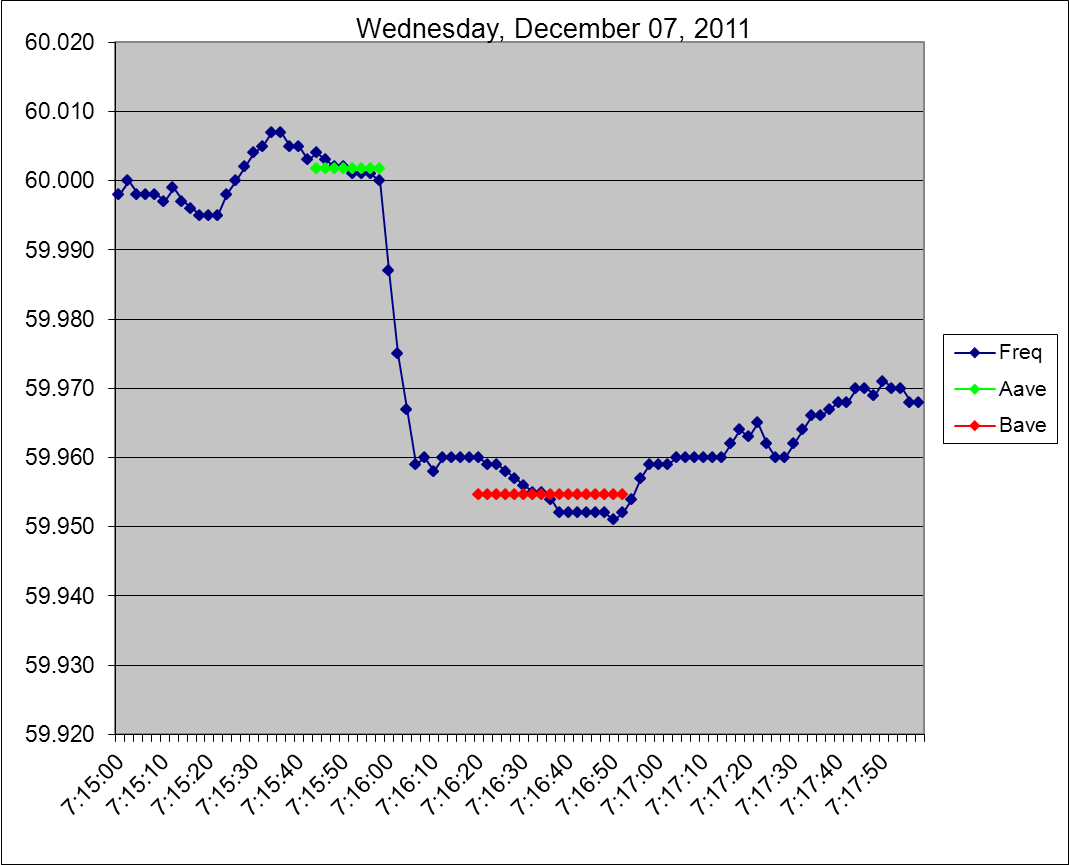
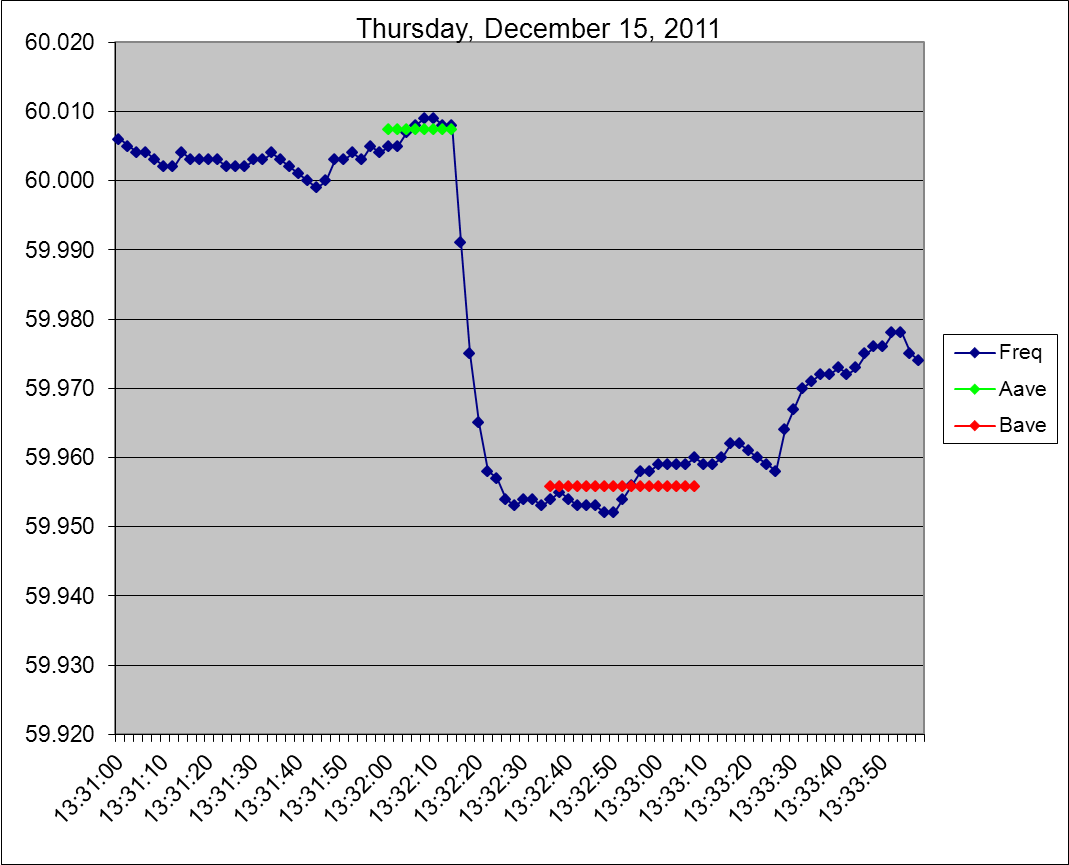
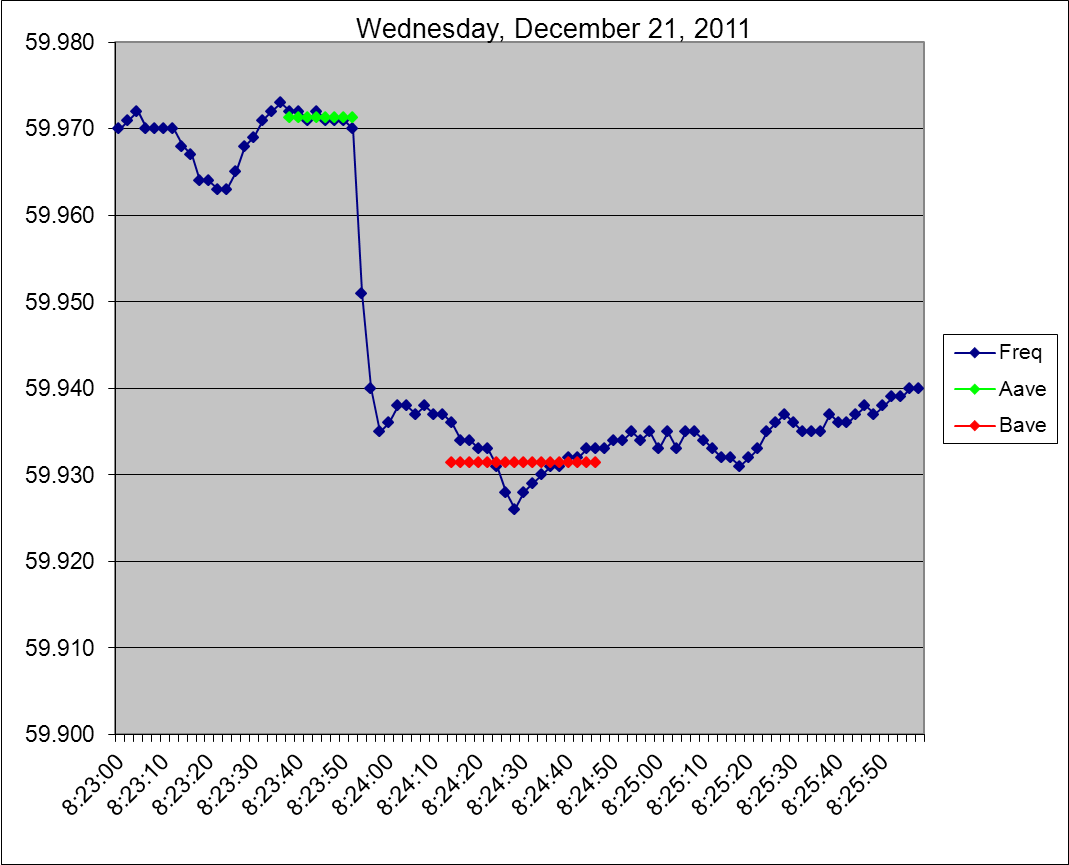
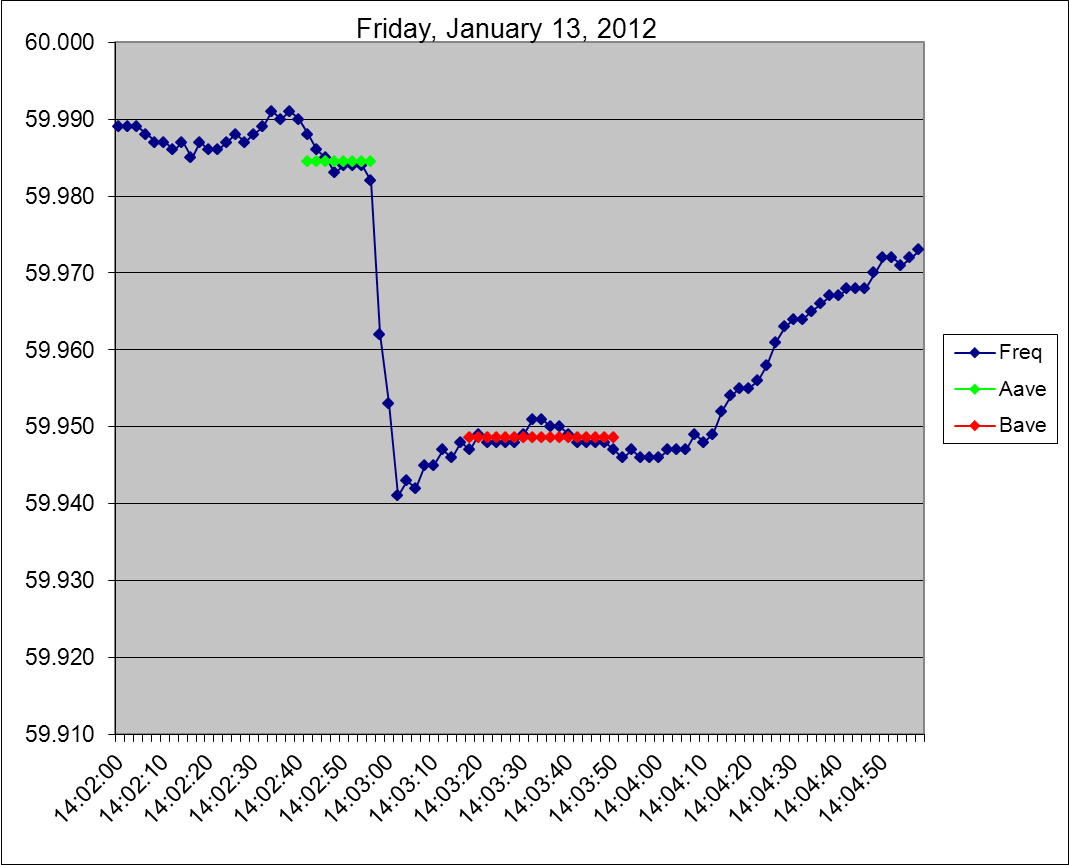
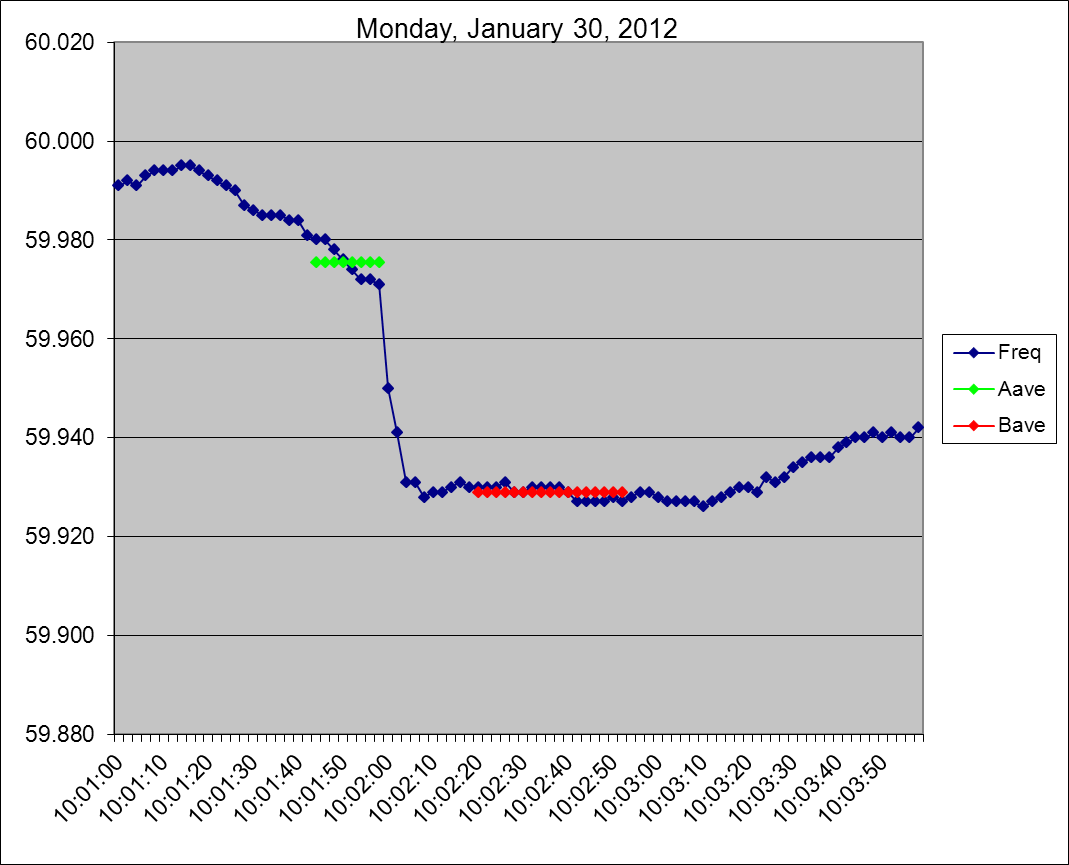
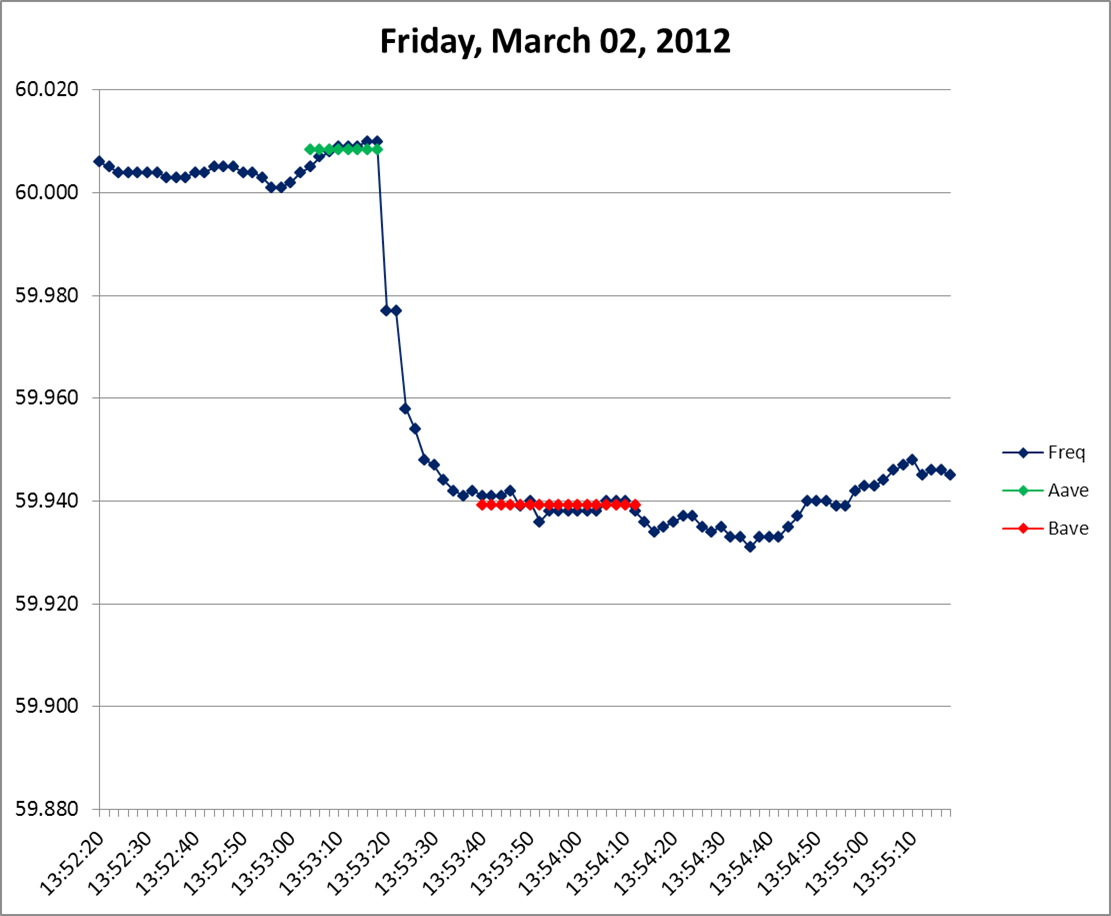
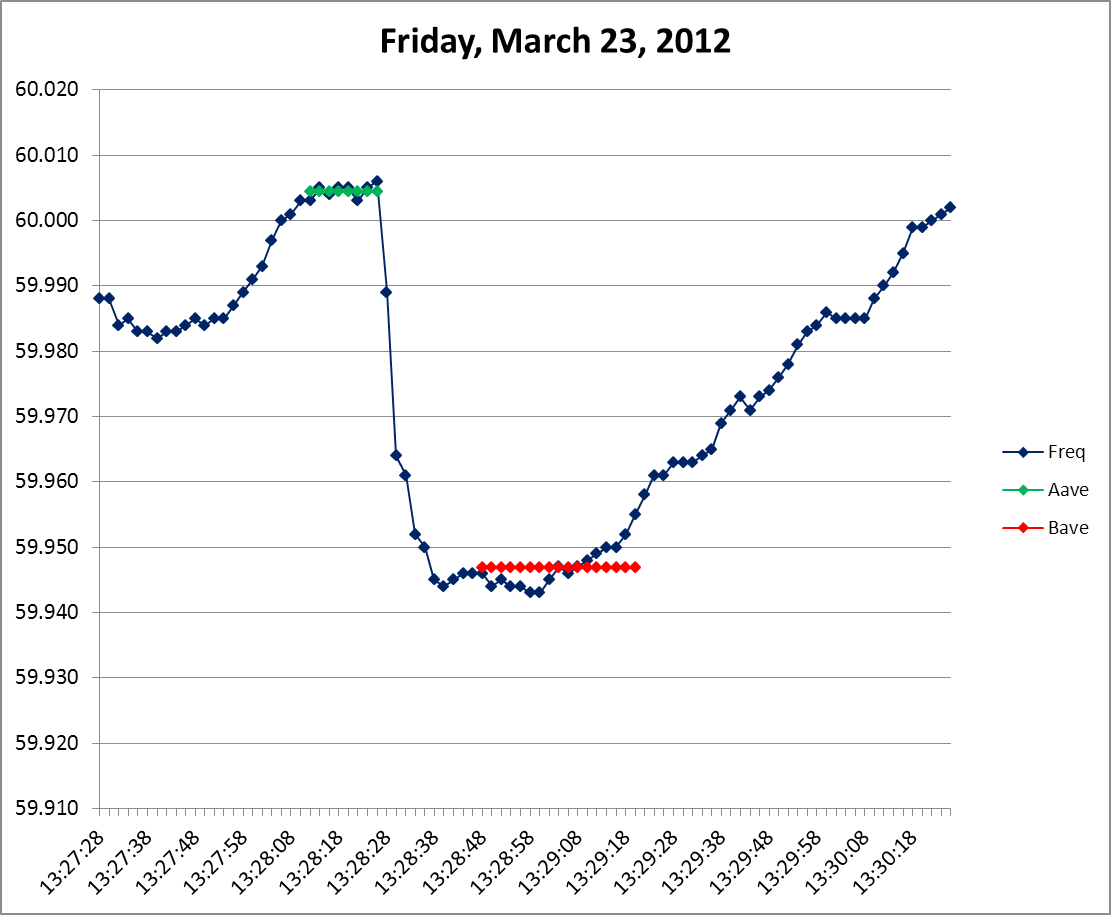
Sheet 8: Event Frequency Graphs
|
|||||||||||
|
|||||||||||
|
|||||||||||
|
|||||||||||
|
|||||||||||
|
|||||||||||
|
|||||||||||
|
|||||||||||
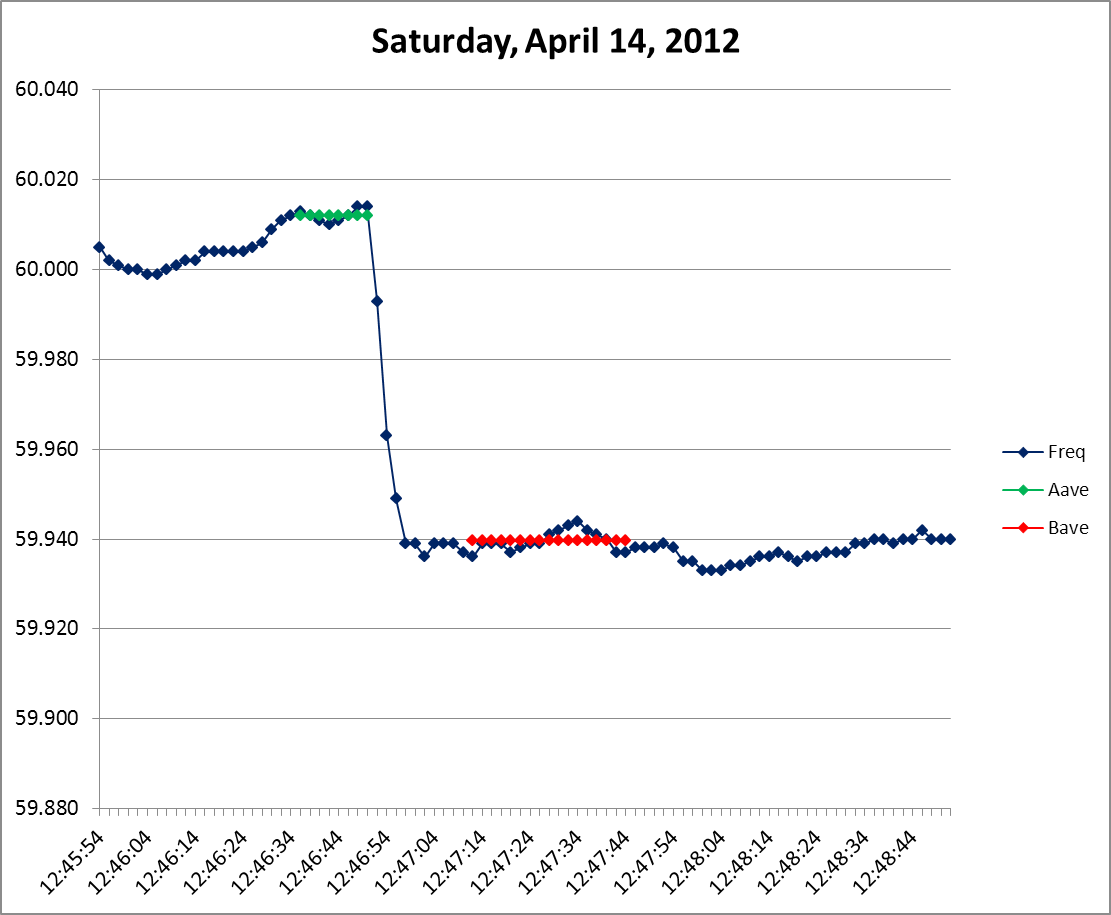
|
|||||||||||
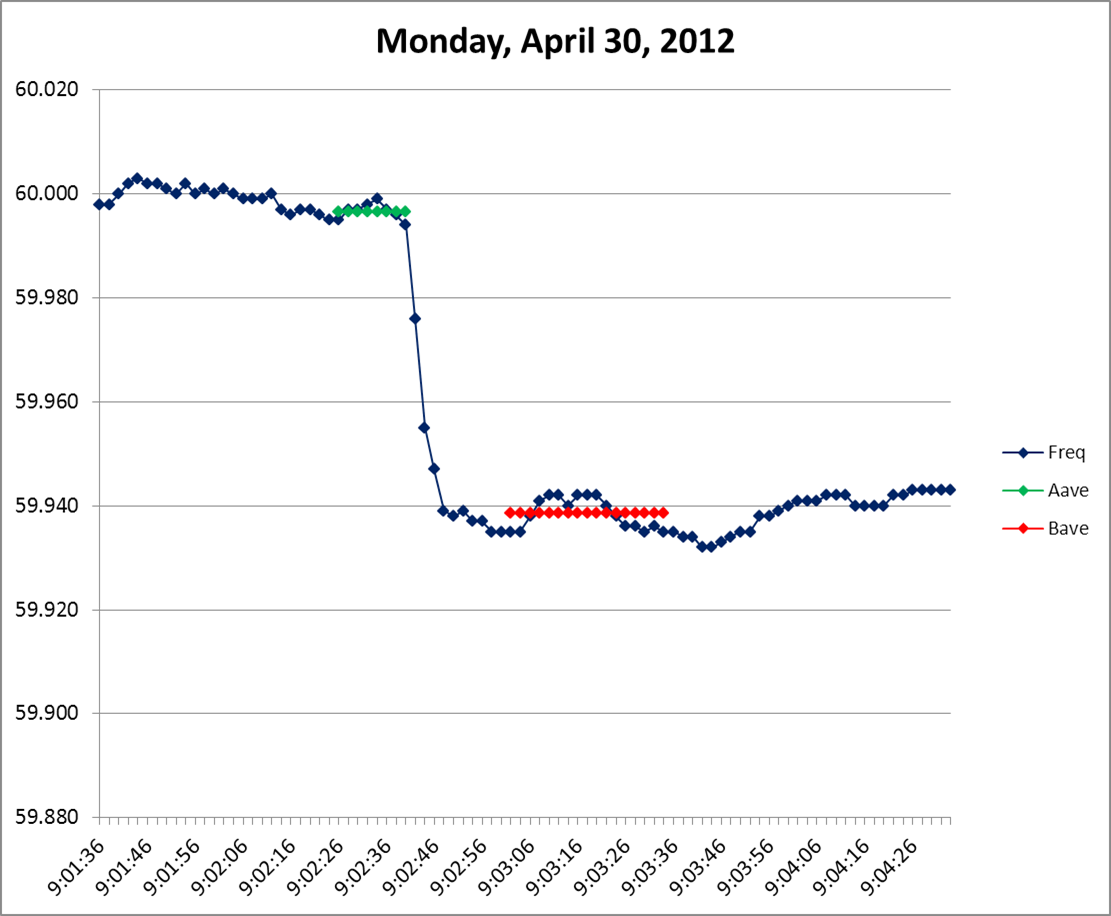
|
|||||||||||
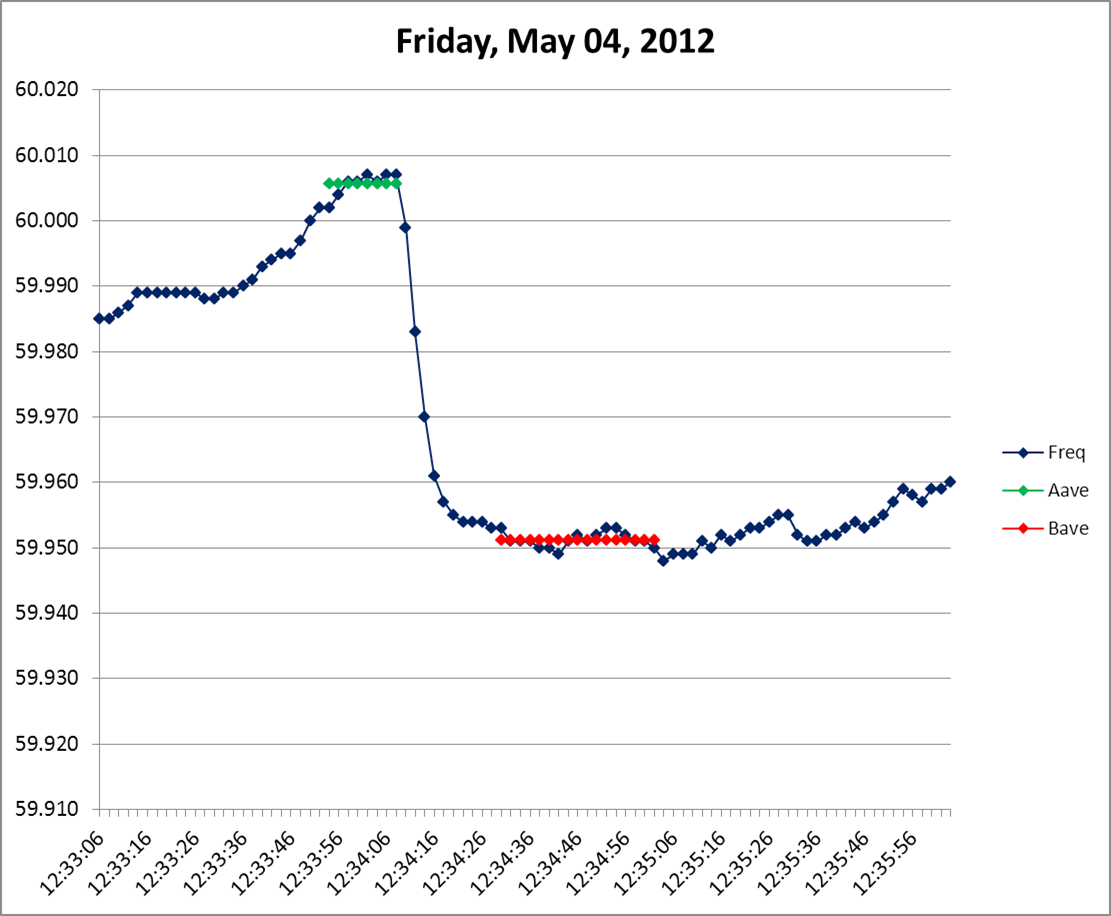
|
|||||||||||
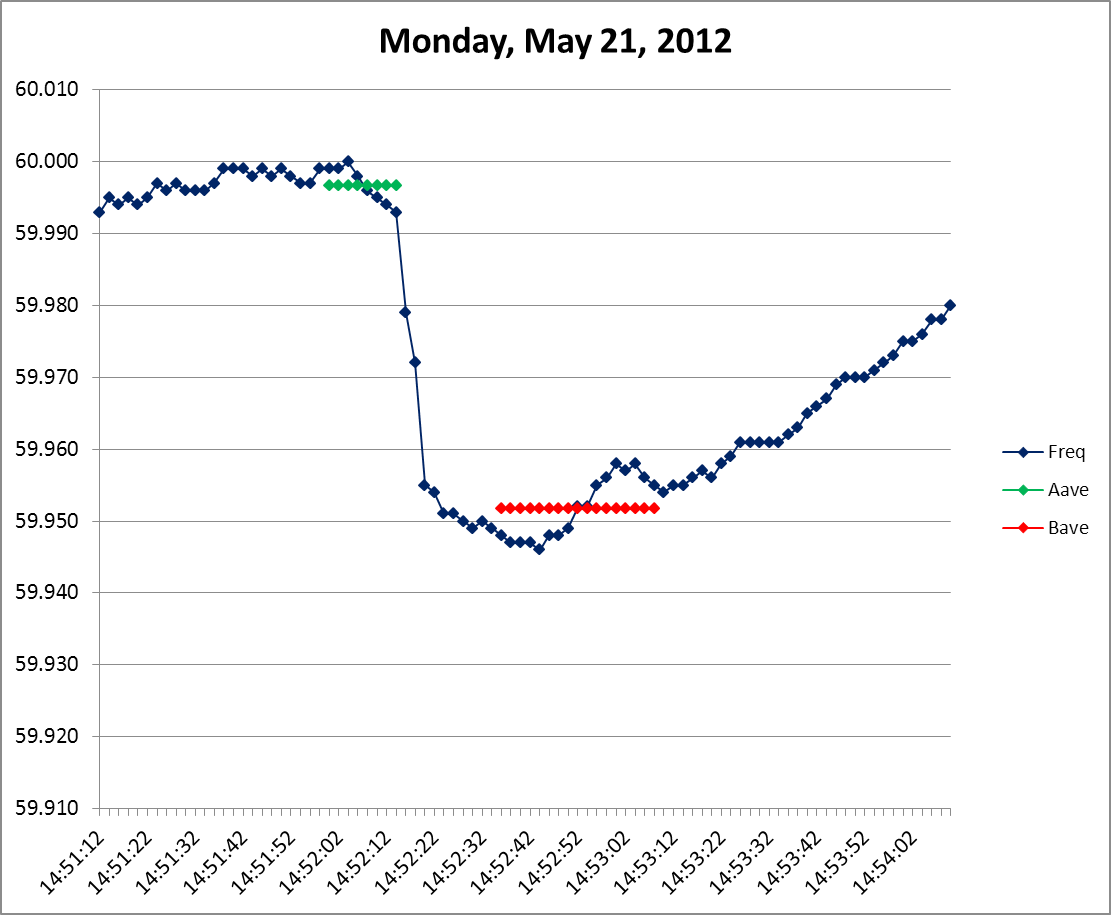
|
|||||||||||
Sheet 9: Frequency Response Initiative
|
||||||||||||||||||||||||
| FRI - NERC Frequency Response Initiative | ||||||||||||||||||||||||
| The FRI Report made recommendations to evaluate Primary Frequency Response at additional time intervals during the event recovery period. | ||||||||||||||||||||||||
| Additional evaluations have been added to both Form 1 and Form 2 to evaluate PFR delivery for these suggested time periods. | ||||||||||||||||||||||||
| These evaluations utilize Interconnection frequency at specific times during the recovery period and calculates the BA's delivery of PFR for each selection. | ||||||||||||||||||||||||
| These evaluations are not part of BAL-003 and will not impact compliance to R1 of the draft standard. | ||||||||||||||||||||||||
| The following time selections are evaluated: T+46, T+76, T+106, T+136 and T+166. | ||||||||||||||||||||||||
| Each evaluation is a P.U. measure based on the BA's Bias setting at each of these times. | ||||||||||||||||||||||||
| Performance is the "best" performance at the specific time through 10 seconds past each time. | ||||||||||||||||||||||||
| This is intended to account for any delay in data in the measurement. This measurement may be changed as experience in this effort increases. | ||||||||||||||||||||||||
| Also included is the measure of PFR delivery during the T+20 to T+52 second period, the same as R1 of the standard. | ||||||||||||||||||||||||
| The measure (P.U.) here is based on the BA Bias setting and not the FRO. This was done to provide comparison to the additional measurement times. | ||||||||||||||||||||||||
| Some basic observations from this data: | ||||||||||||||||||||||||
| 1) If the P.U. value is close to 1.0, the BA delivered the full amount of PFR equal to its Bias setting. | ||||||||||||||||||||||||
| 2) The average performance of the Eastern Interconnection in PFR is about 40% of the total Interconnection Bias setting. If the BA's average score is greater | ||||||||||||||||||||||||
| than 0.40 P.U. then they are providing more PFR than the average BA. If the P.U. is less than 40% then they are providing less than average PFR. | ||||||||||||||||||||||||
| 3) If the P.U. value at T+46 is consistently less than the P.U. value at T+20 to T+52, then the PFR of the BA is not being sustained. | ||||||||||||||||||||||||
| 4) If the P.U. value at later time interval measures is consistently less, then withdrawal of PFR is occurring at a slower rate, but still being withdrawn. | ||||||||||||||||||||||||
| 5) If the P.U. value at T+20 to T+52, T+46, or T+76 is consistently greater than 1.0, this indicates that the BA Bias setting is too low. | ||||||||||||||||||||||||
|
||||||||||||||||||||||||
|
||||||||||||||||||||||||


| File Type | application/vnd.ms-excel |
| File Modified | 2012-10-01 |
| File Created | 1970-01-01 |
© 2026 OMB.report | Privacy Policy