Four Corners Regional Survey
Visibility Valuation Survey
4CORNERS 9-24-2014
Four Corners Regional Survey
OMB: 1024-0255


OMB Control Number 1024 -0255
Current Expiration Date: XX/XX/XXXX
Haze and Visibility
In National Parks and Wilderness Areas
FOUR CORNERS
What Do You Think?
PAPERWORK REDUCTION ACT STATEMENT: The National Park Service is authorized by 16 U.S.C. 1a-7 to conduct this survey. This information will be used by park managers to understand the public’s perceptions and opinions on issues involving National Parks and wilderness areas. Responses to this survey are voluntary and anonymous. Your name will never be associated with your answers, and all contact information will be destroyed when the survey is concluded. No action may be taken against you for refusing to answer this survey. An agency may not conduct or sponsor, and a person is not required to respond to, a collection of information unless it displays a currently valid OMB control number.
ESTIMATE OF TIME TO COMPLETE THIS SURVEY: About 25 minutes, on average. Please direct comments regarding this estimate or any other aspect of this survey to: Susan Johnson, National Park Service Air Resources Division, P.O. Box 25287, Denver, Colorado 80225.
Section A. In this section we ask your opinion about some general issues facing the country.
1. We are faced with many problems in this country, none of which can be solved easily or inexpensively. Listed below are some of these problems and for each one circle whether you think we're spending too little money on it, about the right amount or too little money. (CIRCLE ONE NUMBER IN EACH ROW)
|
TOO LITTLE |
ABOUT THE RIGHT AMOUNT |
TOO MUCH |
The Environment
|
1 |
2 |
3 |
Space Exploration |
1 |
2 |
3 |
Education |
1 |
2 |
3 |
Health |
1 |
2 |
3 |
Assistance to Other Countries |
1 |
2 |
3 |
2. Listed below are some institutions in this country. As far as the people running these institutions are concerned, would you say you have a great deal of confidence, only some confidence, or hardly any confidence at all in them? (CIRCLE ONE NUMBER IN EACH ROW)
|
A GREAT DEAL |
ONLY SOME |
HARDLY ANY |
Banks and Financial Institutions |
1 |
2 |
3 |
Congress |
1 |
2 |
3 |
Scientific Community |
1 |
2 |
3 |
Executive Branch of the Federal Government |
1 |
2 |
3 |
Major Companies |
1 |
2 |
3 |
Organized Religion |
1 |
2 |
3 |
Section B. In this section we discuss haze and its effects on visibility.
Haze occurs when small particles in the air reduce visibility. There are two types of haze:
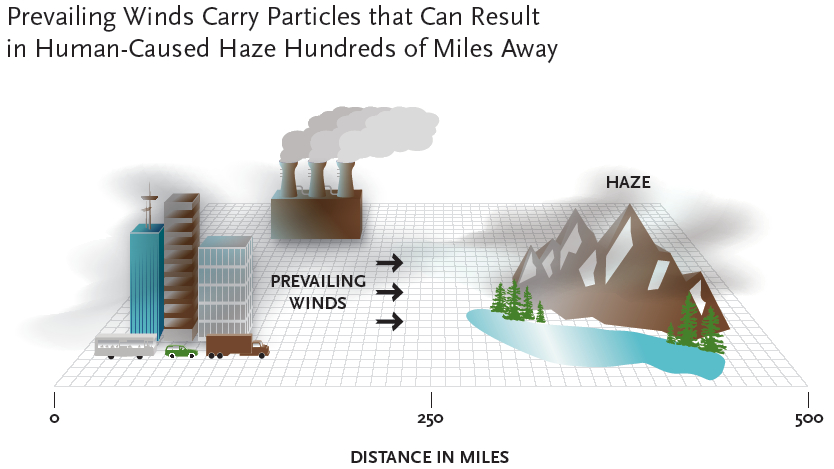
Human-caused haze occurs when activities such as burning coal, oil, gas and wood in power plants, factories, vehicles or homes release particles into the air.
Natural haze occurs when dust is blown into the air and when occasional forest fires release particles into the air.
Scientists have extensively studied haze and have found that there is much more human-caused haze than natural haze.
Scientists have also found that human-caused haze travels farther because the particles are usually smaller and lighter.
The particles that form human-caused haze, particularly those from power plants with tall smokestacks, can travel hundreds of miles from their sources. Please see the diagram below:
Haze reduces visibility, making it harder to see distant objects such as hills, mountains, or other landscape features. On hazy days, distant objects fade, appear blurry, change color, or they disappear from view altogether.
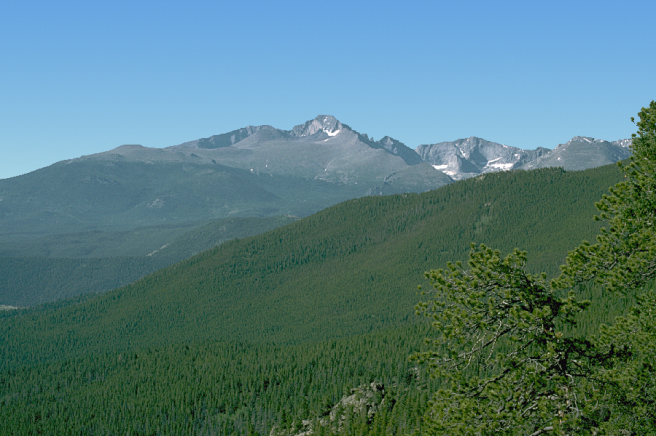
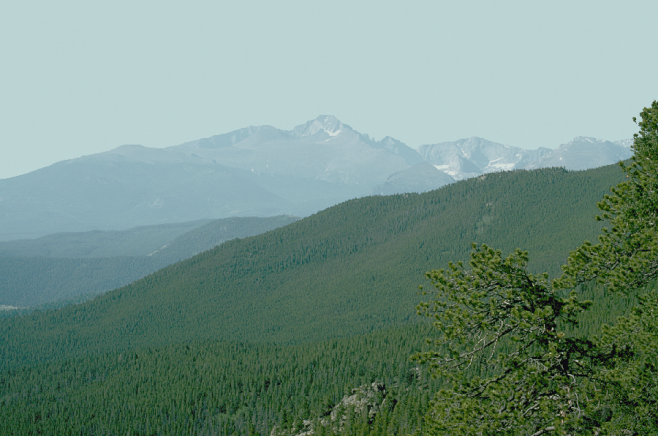
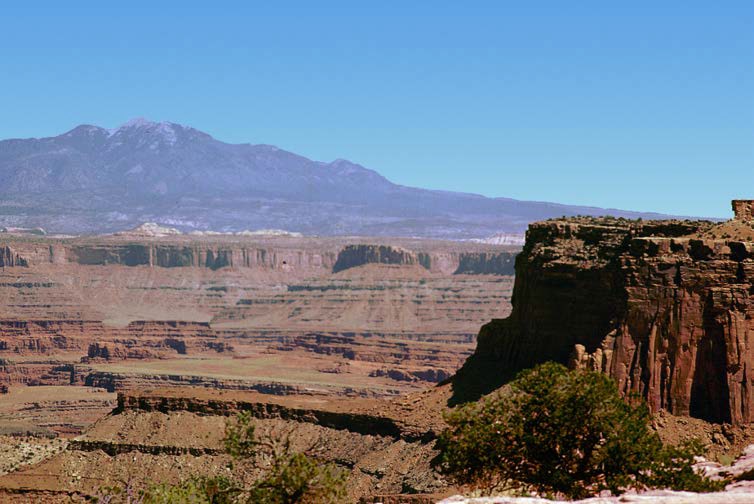
In National Parks and Wilderness Areas visibility conditions are recorded by taking photographs on a regular schedule. The photographs below show the same view with different amounts of haze with the same weather conditions.
Less Haze
|
More Haze
|
3. Have you ever experienced haze reducing your ability to view a scenic vista? (CIRCLE ONE NUMBER)
1 Yes
2 No
Section C. In this section we discuss National Parks and Wilderness Areas.
In this survey, we will be discussing haze in National Parks and National Wilderness Areas. Some information on both of these types of areas is presented below:
National Parks are public lands containing areas of special scenic, historical, or ecological importance.
They are managed by the National Park Service, an agency of the U.S. Federal Government.
These lands are managed to preserve the scenic, historical and ecological features, and to provide for the enjoyment of current and future generations.
State and local parks are not National Parks.
4. How does the information above compare to what you previously thought of as National Parks? (CIRCLE ONE NUMBER)
1 Similar to what I thought
2 Different than what I thought
3 Was not aware of this information about National Parks
National Wilderness Areas are public lands that are managed by the National Park Service and the U.S. Forest Service.
These lands were set aside to be preserved in their natural state to provide habitat for wildlife.
Only non-motorized recreation like backpacking, hunting, fishing, and horseback riding, as well as scientific research are allowed in National Wilderness Areas.
State and local forests and parks are not National Wilderness Areas, neither are privately-owned forests.
5. How does the information above compare to what you previously thought of as National Wilderness Areas? (CIRCLE ONE NUMBER)
1 Similar to what I thought
2 Different than what I thought
3 Was not aware of this information about National Wilderness Areas
Please use the map that folds out on the last page of this booklet to help answer questions in the rest of this survey.
The region circled in red includes seven National Parks, eight Wilderness Areas and one National Monument. This region does not include any large cities.
6. Have you heard of any of the following?
Maroon Dells-Snowmass Wilderness
 NO
NO

 YES
If YES, have you visited?
NO
YES
YES
If YES, have you visited?
NO
YES
Arches National Park
 NO
NO

 YES
If YES, have you visited?
NO
YES
YES
If YES, have you visited?
NO
YES
Canyonlands National Park
 NO
NO

 YES
If YES, have you visited?
NO
YES
YES
If YES, have you visited?
NO
YES
Capitol Reef National Park
 NO
NO

 YES
If YES, have you visited?
NO
YES
YES
If YES, have you visited?
NO
YES
Bryce Canyon National Park
 NO
NO

 YES
If YES, have you visited?
NO
YES
YES
If YES, have you visited?
NO
YES
Zion National Park
 NO
NO

 YES
If YES, have you visited?
NO
YES
YES
If YES, have you visited?
NO
YES
Black Canyon of the Gunnison National Park
 NO
NO

 YES
If YES, have you visited?
NO
YES
YES
If YES, have you visited?
NO
YES
West Elk Wilderness
 NO
NO

 YES
If YES, have you visited?
NO
YES
YES
If YES, have you visited?
NO
YES
Simeon of Wilderness
 NO
NO

 YES
If YES, have you visited?
NO
YES
YES
If YES, have you visited?
NO
YES
Superstition Wilderness
 NO
NO

 YES
If YES, have you visited?
NO
YES
YES
If YES, have you visited?
NO
YES
Galiuro Wilderness
 NO
NO

 YES
If YES, have you visited?
NO
YES
YES
If YES, have you visited?
NO
YES
Saguaro National Park
 NO
NO

 YES
If YES, have you visited?
NO
YES
YES
If YES, have you visited?
NO
YES
Mount Bald Wilderness
 NO
NO

 YES
If YES, have you visited?
NO
YES
YES
If YES, have you visited?
NO
YES
Gila Wilderness
 NO
NO

 YES
If YES, have you visited?
NO
YES
YES
If YES, have you visited?
NO
YES
Chiricahua National Monument
 NO
NO

 YES
If YES, have you visited?
NO
YES
YES
If YES, have you visited?
NO
YES
Chiricahua Wilderness
 NO
NO

 YES
If YES, have you visited?
NO
YES
YES
If YES, have you visited?
NO
YES
Section D. In this section we discuss Human-Caused Haze in National Parks and Wilderness Areas.
Scientists have found that human-caused haze in National Parks and Wilderness Areas is largely due to particles that travel long distances to these areas.
Human-caused haze in National Parks and Wilderness Areas is similar to what is often called smog in urban areas.
Humidity does not cause haze but humidity increases the level of haze when there are particles present in the air.
7. On a scale of 1 to 5, where 1 is not concerned at all and 5 is very concerned, relative to other environmental problems, how concerned are you about human-caused haze in National Parks and Wilderness Areas? (CIRCLE ONE NUMBER)
NOT AT ALL CONCERNED |
SLIGHTLY CONCERNED |
SOMEWHAT CONCERNED |
MODERATELY CONCERNED |
VERY CONCERNED |
1 |
2 |
3 |
4 |
5 |
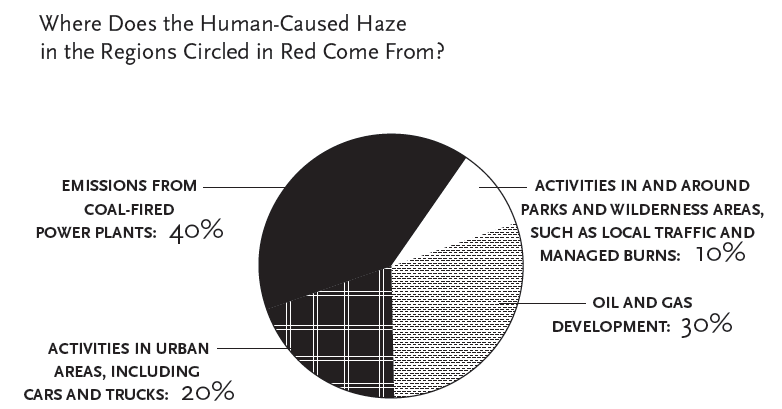
There are four types of activities that result in human-caused haze in this region. These are shown in the chart below. Research by the U.S. Environmental Protection Agency indicates how much each activity contributes to the overall level of haze. This information is summarized in the chart below.

8. Is there anything about the sources of human caused haze above that you did not know before reading this survey? (CIRCLE ONE NUMBER)
1 Yes
2 No
Section E. In this section we discuss ways to reduce Human-Caused Haze and Improve Visibility Conditions in National Parks and Wilderness Areas.
The U.S. Congress has passed laws calling for reductions in human-caused haze in National Parks and Wilderness Areas.
The laws require states to work together in regional partnerships to reduce human caused haze in these areas.
Regional agreements are needed because the particles that form human-caused haze can travel hundreds of miles from their source.
Haze could be further reduced by:
Installing improved technology at coal-fired power plants to reduce emissions.
Controlling particles released during oil and natural gas production.
Switching power plants and factories to cleaner fuels such as natural gas.
Reformulating motor vehicle fuels.
The states shown on your map are considering programs that would reduce haze in the region circled in red.
9. Do you think that changes in human activities could reduce haze in the National Parks and Wilderness Areas located in the region circled in red? (CIRCLE ONE NUMBER)
1 Yes
2 No
In the next section of the survey, you will be asked about these programs.
Please refer to the picture set that came with your survey booklet.
The photos show visibility conditions that currently occur at National Parks and Wilderness Areas in this region. The photos are from an area where visibility has been monitored on a regular schedule. They were taken at the same time of day during the same season on days without bad weather.
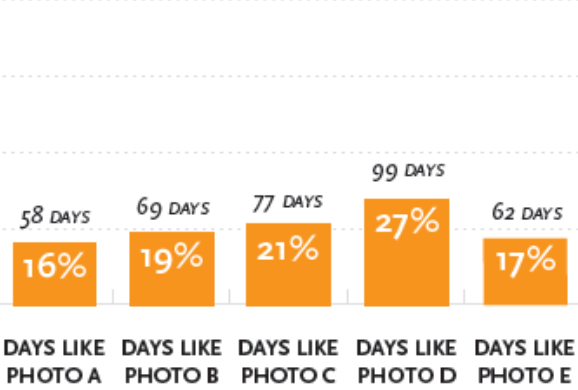
Photos of visibility conditions on each day were sorted from best to worst. The photos you see were chosen to represent five categories of visibility: A, B, C, D, and E.
Photo A represents the best visibility category.
Photo E represents the worst visibility category.
Each category was selected to represent an equal number of days.
The photos represent the average visibility level for each category. For example, the worst visibility conditions on average would be like Photo E. Of course, some days in this category might be a little better and some might be worse.
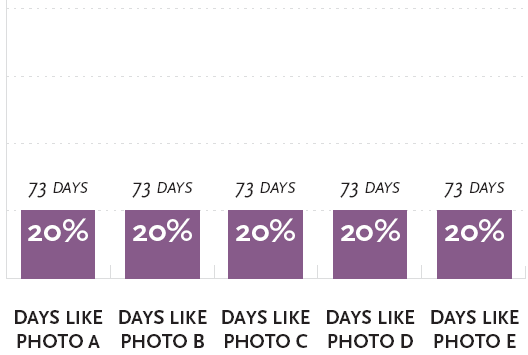
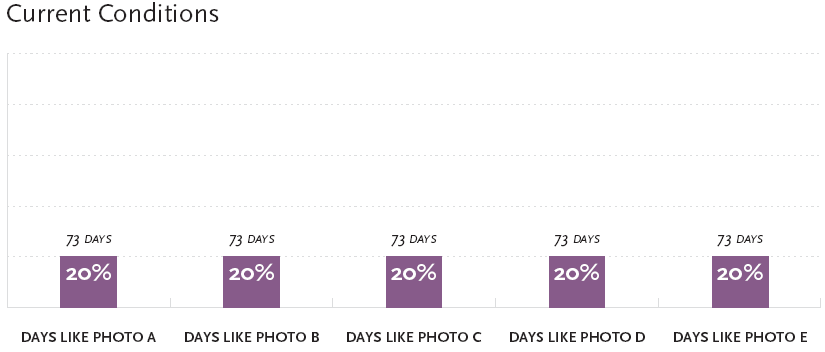
The chart below shows the percent of the year and number of days in each category. Each bar represents 20% of the year, which is 73 days
10. Do you see differences in the levels of haze between photographs…
Photos A and B Yes No Photos D and E Yes No
Photos B and C Yes No Photos A and E Yes No
Photos C and D Yes No Photos B and D Yes No
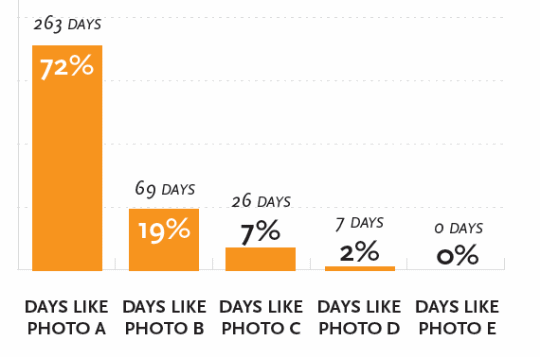
Scientists have estimated the visibility conditions that would exist if there were no human-caused haze. Of course, even in the absence of haze there would still be some days when visibility is poor due to bad weather.
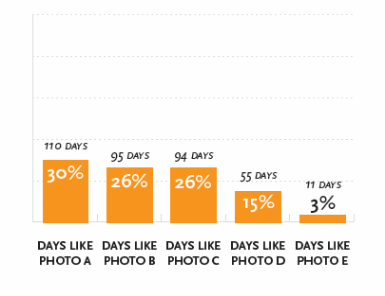
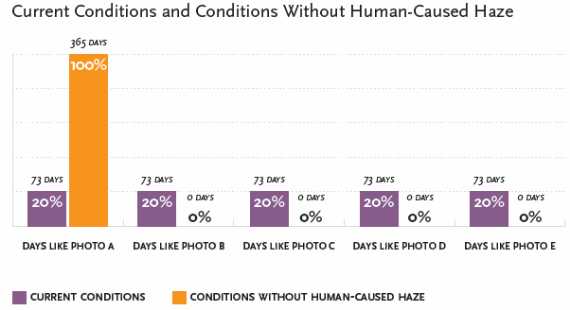
The chart below shows current visibility conditions in purple and visibility conditions that would exist without human-caused haze in orange.
For example, the chart shows that there are currently 73 days with visibility conditions like Photo A. This would increase to 365 days if there were no human-caused haze.
Bar charts like the ones you have been looking at can be used to describe the visibility improvements that can be achieved by reducing human-caused haze by different amounts.
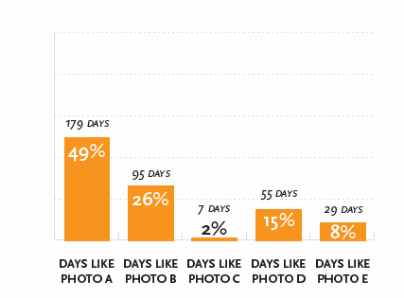
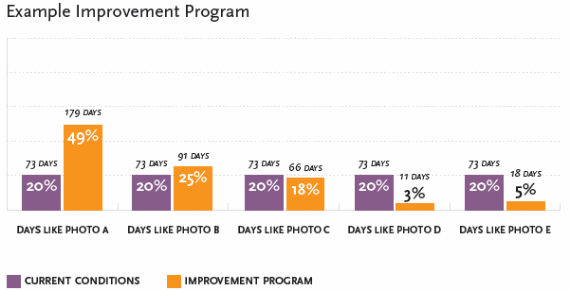
As an example, the chart below shows current visibility conditions next to improved visibility conditions that would result from a specific program.
Different ways of setting up a program to reduce human-caused haze could result in different levels of visibility improvements. In this particular program, there would be more days in a typical year with higher levels of visibility like those in Photos A and B, and fewer days with lower levels of visibility like those in Photos C, D and E.
Section F. In this section we discuss other characteristics of programs to reduce Human-Caused Haze and ask for your opinion on some example programs.
All particles that form human-caused haze in National Parks and Wilderness Areas reduce visibility. Some of these particles can also impact the ecosystems in those areas.
Particles that impact ecosystems can affect water quality, soil, plants, and in turn, the growth and variety of plants and animals.
These effects occur very slowly, so most visitors to these areas would not notice changes in the growth and variety of plants and animals from one year to the next.
Some ways of setting up a program to reduce human-caused haze would result in a small reduction in harmful impacts on ecosystems while other ways would have no effect.
11. Before reading this survey had you heard anything about the impacts of human-caused haze on ecosystems in National Parks and Wilderness Areas? (CIRCLE ONE NUMBER)
1 Yes
2 No
Some of these particles can also impact some people’s health when they visit these areas.
The level of haze at National Parks and National Wilderness Areas is less than the level that is usually present in urban areas.
Few visitors to these areas experience health impacts from the current level of haze.
Some visitors who have respiratory problems may experience coughing or shortness of breath on days with high levels of human-caused haze.
Some ways of setting up a program to reduce human-caused haze would result in a small reduction in health impacts to some visitors with respiratory problems while other ways would have no effect.
12. Before reading this survey had you heard anything about the impacts of human-caused haze on visitor health in National Parks and Wilderness Areas? (CIRCLE ONE NUMBER)
1 Yes
2 No
The amount of time required to reach the program goal will depend on how the program is set up. Any program will steadily reduce human-caused haze in the region circled in red by controlling more and more sources of particles over time.
For example, if the program takes 10 years, in 5 years the program would be one-half of the way to achieving its goal. Or, if the program takes 20 years, after 5 years the program would be one-quarter of the way to achieving its goal.
13. How important to you is the number of years it takes a program to reach its improvement goal? (CIRCLE ONE NUMBER)
NOT AT ALL IMPORTANT |
UNIMPORTANT
|
NEITHER IMPORTANT OR UNIMPORTANT |
IMPORTANT
|
VERY IMPORTANT |
|
1 |
2 |
3 |
4 |
5 |
|
Reducing human-caused haze in this region would be accomplished by improving pollution control equipment and shifting to cleaner, more expensive sources of energy. The costs of most of these activities would ultimately be passed on to households through higher prices and taxes.
You would have to pay each year while any program is being implemented. You would also continue to pay each year after the final improvement goal is reached. This is because the new pollution control equipment will need to be operated each year and because the cleaner energy sources are more expensive.
14. Are you surprised that you would have to pay for a program every year? (CIRCLE ONE NUMBER)
1 Yes
2 No
Now we are going to ask you for your opinions on five programs to reduce human-caused haze only in the region circled in red on your map.
Each program to reduce human-caused haze will be described in terms of the following five characteristics:
The improvement in visibility.
Whether there is a small reduction in harmful ecosystem impacts.
Whether there is a small reduction in the health impacts on some visitors with respiratory problems.
How many years it would take for the program to reach its final improvement goal.
The cost to your household every year.
The difference in the characteristics of the programs will depend on what types of particles are being controlled. Keep in mind that the programs are only designed to reduce haze in the red circled region. There are other ongoing programs to improve air quality in cities.
In each question we will ask you to decide whether you would vote for a specific improvement program. Please consider the description of the improvement program in each question carefully.
Before you begin, we’d like you to keep something in mind:
Surveys like this one, where people are asked to make choices about programs, are used to provide information to the government about what public policy issues people are concerned about and the tradeoffs they are prepared to make.
In some cases, people may vote “yes” for a program at a cost that they really would not pay. This is because when responding to the questions, some people may not think about the consequences of paying for the program in terms of their household budget, what they can afford, or other things they need or want to spend their money on.
Make sure you are aware of the cost to your household when making your choices in response to the questions in the next section.
Note Reviewer: The following set of choice questions will vary in terms of the levels of the program attributes.
Program 1 Choice Question
15. Please compare the current conditions without a program to conditions with Program 1. Then answer the question below as if Program 1 is the only program available.
|
Current
Conditions
|
Conditions with Program
1
|
Visibility Conditions in these Regions |
|
|
Impacts on Ecosystems |
No Change |
A Small Reduction |
Health Impacts on Visitors |
No Change |
No Change
|
Years to Reach Improvement |
No Improvement |
20 Years to Reach
|
Cost to Your Household Each Year |
$0 |
$15 |
If there was a vote today to decide whether to do Program 1 or not do this program, how would you vote? (CIRCLE ONE NUMBER)
1 I would vote FOR the Program
2 I would vote AGAINST the Program
Program 2 Choice Question
16. Please compare the current conditions without a program to conditions with Program 2. Then answer the question below as if Program 2 is the only program available.
|
Current
Conditions
|
Conditions with Program
2
|
Visibility Conditions in these Regions |
|
|
Impacts on Ecosystems |
No Change |
No Change |
Health Impacts on Visitors |
No Change |
No Change |
Years to Reach Improvement |
No Improvement |
10 Years to Reach
|
Cost to Your Household Each Year |
$0 |
$35 |
If there was a vote today to decide whether to do Program 2 or not do this program, how would you vote? (CIRCLE ONE NUMBER)
1 I would vote FOR the Program
2 I would vote AGAINST the Program
Program 3 Choice Question
17. Please compare the current conditions without a program to conditions with Program 3. Then answer the question below as if Program 3 is the only program available.
|
Current
Conditions
|
Conditions with Program
3
|
Visibility Conditions in these Regions |
|
|
Impacts on Ecosystems |
No Change |
No Change |
Health Impacts on Visitors |
No Change |
No Change
|
Years to Reach Improvement |
No Improvement |
20 Years to Reach
|
Cost to Your Household Each Year |
$0 |
$65 |
If there was a vote today to decide whether to do Program 3 or not do this program, how would you vote? (CIRCLE ONE NUMBER)
1 I would vote FOR the Program
2 I would vote AGAINST the Program
Program 4 Choice Question
18. Please compare the current conditions without a program to conditions with Program 4. Then answer the question below as if Program 4 is the only program available.
|
Current
Conditions
|
Conditions with Program
4
|
Visibility Conditions in these Regions |
|
|
Impacts on Ecosystems |
No Change |
No Change |
Health Impacts on Visitors |
No Change |
No Change |
Years to Reach Improvement |
No Improvement |
10 Years to Reach
|
Cost to Your Household Each Year |
$0 |
$115 |
If there was a vote today to decide whether to do Program 4 or not do this program, how would you vote? (CIRCLE ONE NUMBER)
1 I would vote FOR the Program
2 I would vote AGAINST the Program
Program 5 Choice Question
19. Please compare the current conditions without a program to conditions with Program 5. Then answer the question below as if Program 5 is the only program available.
|
Current
Conditions
|
Conditions with Program
5
|
Visibility Conditions in these Regions |
|
|
Impacts on Ecosystems |
No Change |
No Change |
Health Impacts on Visitors |
No Change |
A Small Reduction |
Years to Reach Improvement |
No Improvement |
10 Years to Reach
|
Cost to Your Household Each Year |
$0 |
$65 |
If there was a vote today to decide whether to do Program 5 or not do this program, how would you vote? (CIRCLE ONE NUMBER)
1 I would vote FOR the Program
2 I would vote AGAINST the Program
Program 6 Choice Question
20. Please compare the current conditions without a program to conditions with Program 6. Then answer the question below as if Program 6 is the only program available.
|
Current
Conditions
|
Conditions with Program
6
|
Visibility Conditions in these Regions |
|
|
Impacts on Ecosystems |
No Change |
No Change |
Health Impacts on Visitors |
No Change |
A Small Reduction |
Years to Reach Improvement |
No Improvement |
20 Years to Reach
|
Cost to Your Household Each Year |
$0 |
$115 |
If there was a vote today to decide whether to do Program 6 or not do this program, how would you vote? (CIRCLE ONE NUMBER)
1 I would vote FOR the Program
2 I would vote AGAINST the Program
Section G. In this final section we would like to learn more about your program choices and your background. This information will help us compare your answers to those of other people.
21. When you voted on the programs in the previous section did you assume: (CIRCLE ONE NUMBER)
1 The programs would mostly reduce haze in the region circled in red on the map
2 The programs would provide similar reductions in haze in all of the areas shown on the map, including urban areas.
22. When you voted on the programs, how important were each of the following features of the haze reduction programs to you? Rank in order of importance to you, 1 as the most important and 5 as the least important. (Enter the ranking in the blank space next to each feature)
Visibility Improvements |
|
Health Effects |
|
Ecological Effects |
|
Timing |
|
Cost to You |
|
23. How hard did you find it to answer questions about the haze reduction programs?
(CIRCLE ONE NUMBER)
1 Not hard
2 Somewhat hard
3 Hard
4 Very Hard
24. How effective do you think a haze reduction program would be in improving visibility conditions? (CIRCLE ONE NUMBER)
1 Completely effective
2 Mostly effective
3 Somewhat effective
4 Not very effective
5 Not at all effective
25. Was there any additional information that you needed when you voted on the haze reduction programs? (CIRCLE ONE NUMBER)
No
 Yes
What additional information would you like to have?
_______________________________________________________
_______________________________________________________
26. There are differing opinions about how far we have gone in this country with environmental laws and regulations. At present, do you think our environmental laws and regulations have gone too far, not far enough, or have struck about the right balance? (CIRCLE ONE NUMBER)
1 Too far
2 Not far enough
3 About the right balance
4 Don’t know
27. Have you ever visited a National Park or Wilderness Area outside the region you have been looking at on the map? (CIRCLE ONE NUMBER)
1 Yes
2 No
28. Do you think the amount of federal income tax you have to pay is too high, about right, or too low? (CIRCLE ONE NUMBER)
Too high
About right
Too low
29. What is your gender? (CIRCLE ONE NUMBER)
Male
Female
30. What is your age?
_____ YEARS
31. Do you consider yourself Hispanic or Latino? (CIRCLE ONE NUMBER)
Yes
No
32. What is your race? (YOU MAY SELECT MORE THAN ONE)
American Indian or Alaskan Native
Asian
Black or African American
Native Hawaiian or Other Pacific Islander
White
33. What is the highest degree or level of school you have completed? (CIRCLE ONE NUMBER)
No schooling
Some schooling less than grade 12
High school graduate
Some college
Associate’s Degree
Bachelor’s Degree
Master’s Degree
Professional Degree beyond a Bachelor’s
Doctoral Degree
34. Which of the following income categories best describes your household income last year, before taxes? (CIRCLE ONE NUMBER)
1 $10,000 or less |
7 $60,001 - $75,000 |
2 $10,001 - $20,000 |
8 $75,001 - $100,000 |
3 $20,001 - $30,000 |
9 $100,001 - $125,000 |
4 $30,001 - $40,000 |
10 $125,001 - $150,000 |
5 $40,001 - $50,000 |
11 $150,001 or more |
6 $50,001 - $60,000
|
|
Thank you for taking the time to complete this questionnaire.
| File Type | application/vnd.openxmlformats-officedocument.wordprocessingml.document |
| File Title | VALUING VISIBILITY IN NATIONAL PARKS: STUDY PLAN |
| Author | JohnsonS |
| File Modified | 0000-00-00 |
| File Created | 2021-01-27 |
© 2026 OMB.report | Privacy Policy
