Att. J_Height and weight Percentile
Att. J_Height and weight percentile.docx
Update the Height Recommendation for Proper Seat Belt Fit among Children
Att. J_Height and weight Percentile
OMB: 0920-1145
Attachment J – Height and weight percentile
Height by Body Mass Index (BMI)
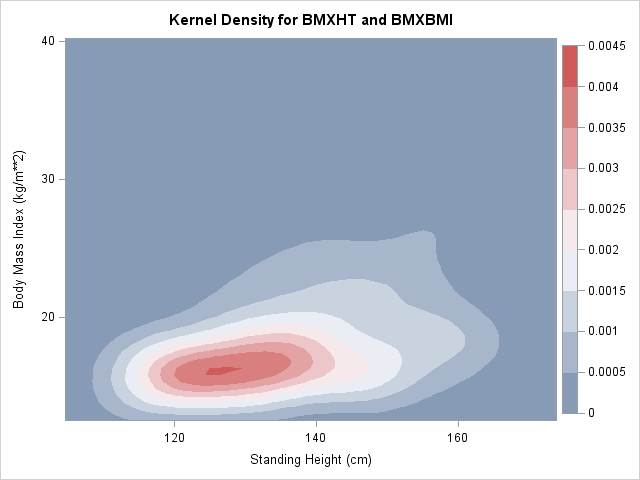
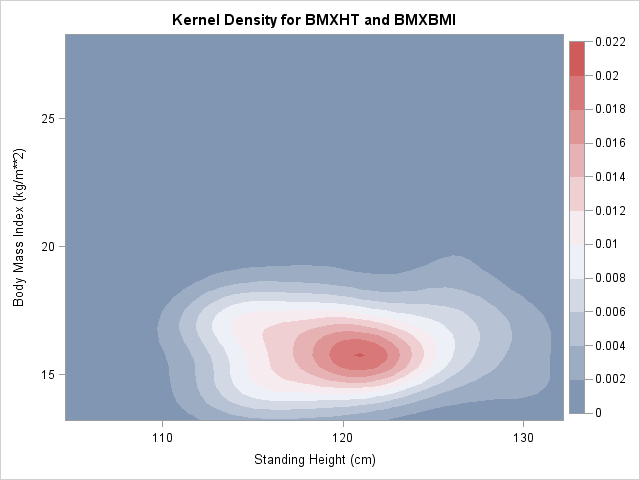
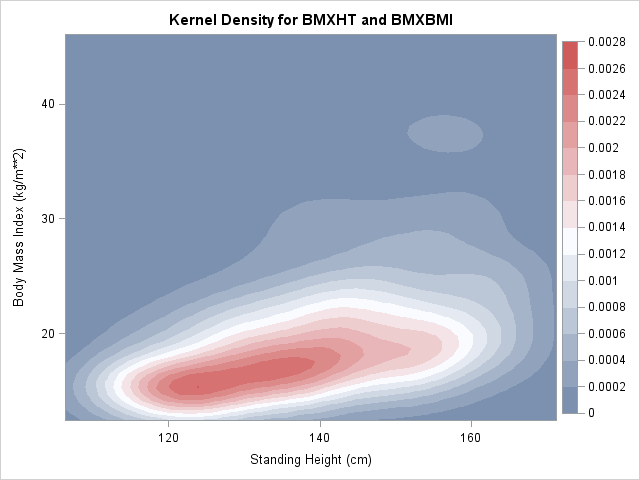
The first variable comparison reviewed was standing height in centimeters to BMI. The following contour plots show the distributions by gender and age between standing height and BMI. These plots take into account the survey weights for the NHANES data. Please note that these plots do not have the axes fixed between plots so that the population distributions for each age can be shown better.
Males
The following contour plots are for males ages 6 to 12. The initial plot is all males age 6-12, and the remaining plots are for each separate age from 6 years old to 12 years old.
Everyone – Height by BMI Age 6 – Height by BMI
Age 7 – Height by BMI Age 8 – Height by BMI
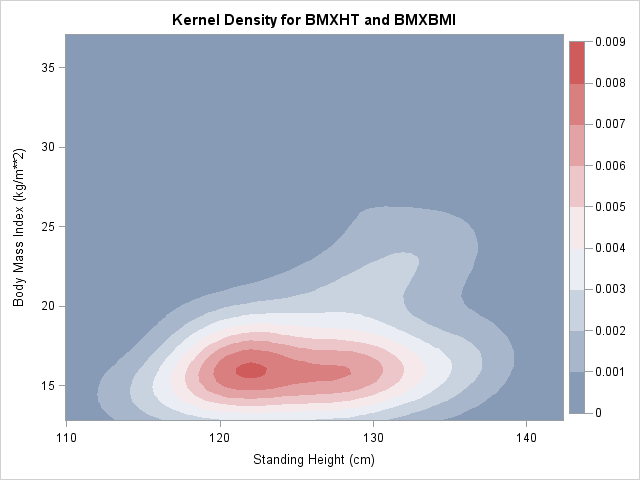
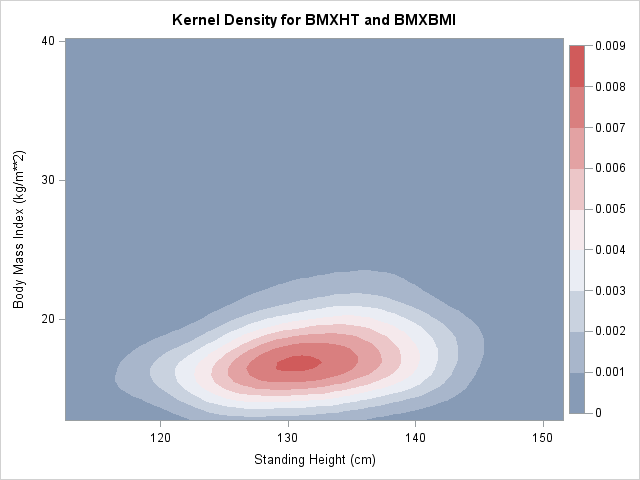
Age 9 – Height by BMI Age 10 – Height by BMI
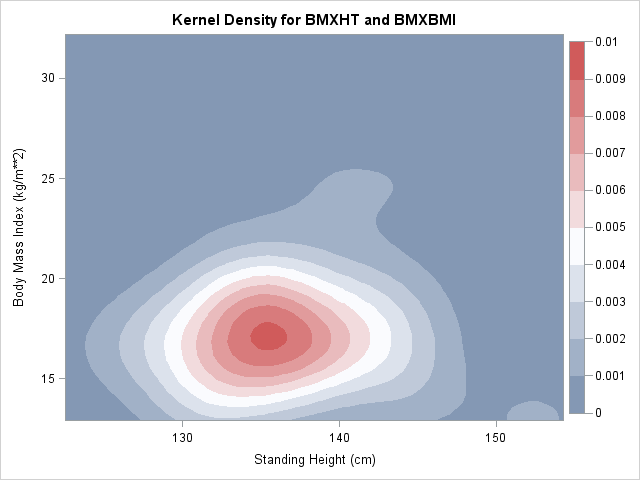
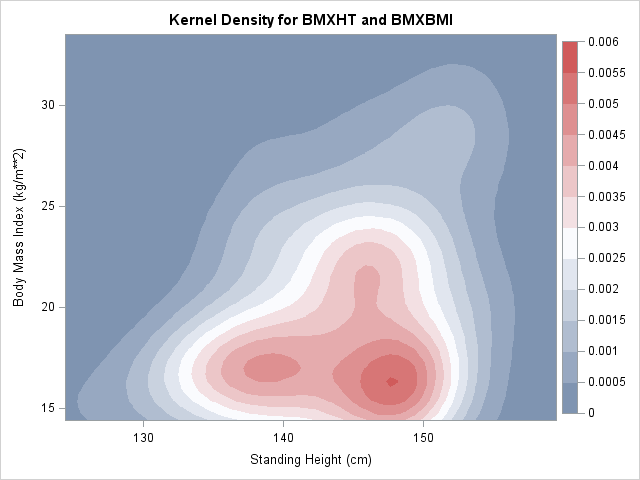
Age 11 – Height by BMI Age 12 – Height by BMI
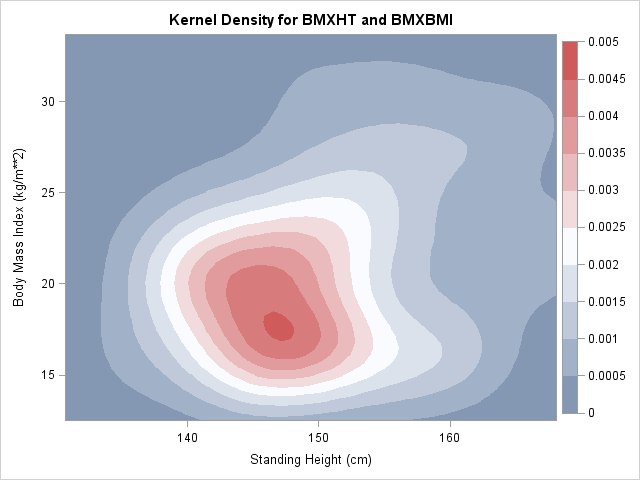
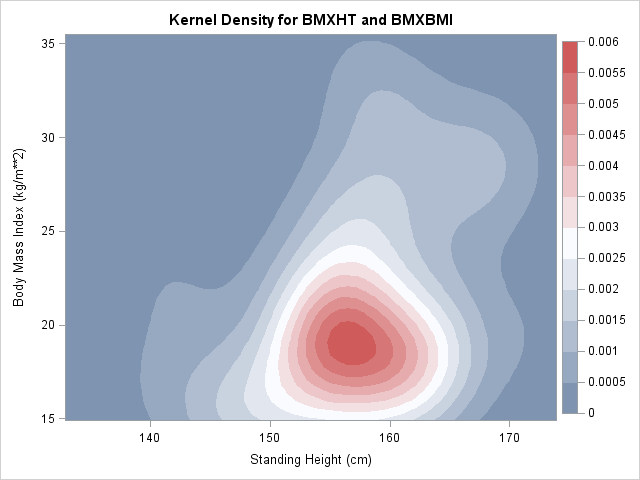
Females
The following contour plots are for females ages 6 to 12. The initial plot is all females age 6-12, and the remaining plots are for each separate age from 6 years old to 12 years old.
Everyone – Height by BMI Age 6 – Height by BMI
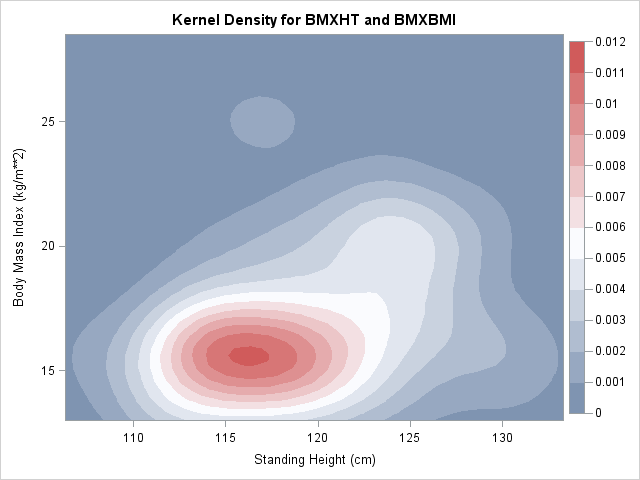
Age 7 – Height by BMI Age 8 – Height by BMI
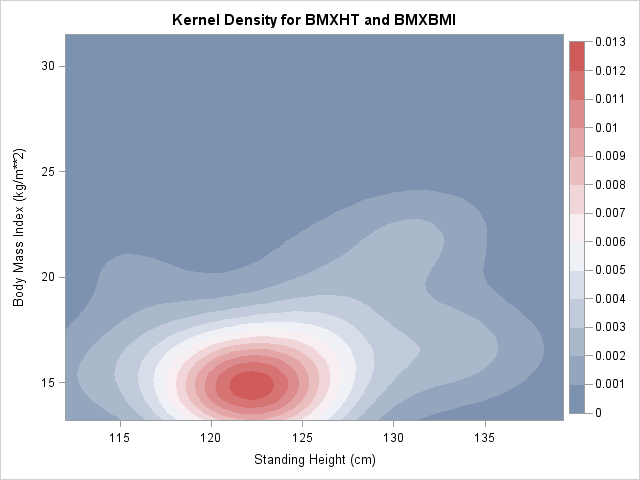
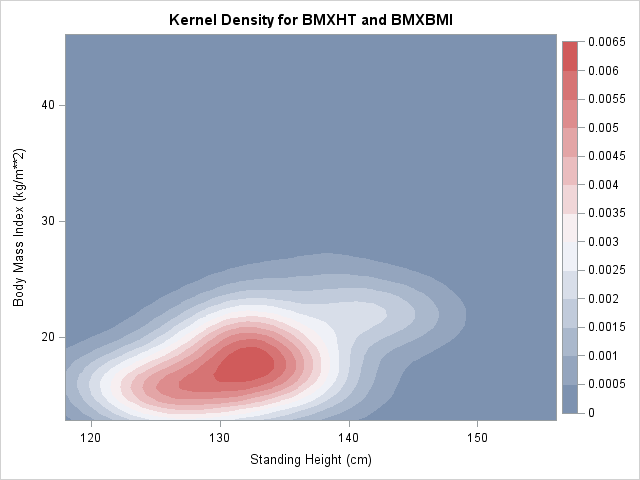
Age 9 – Height by BMI Age 10 – Height by BMI
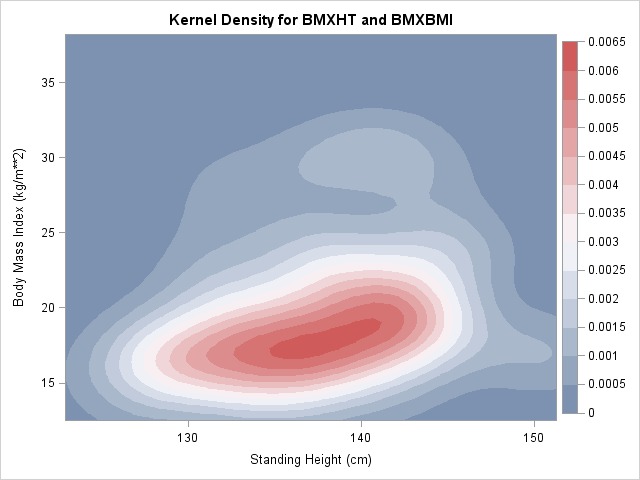
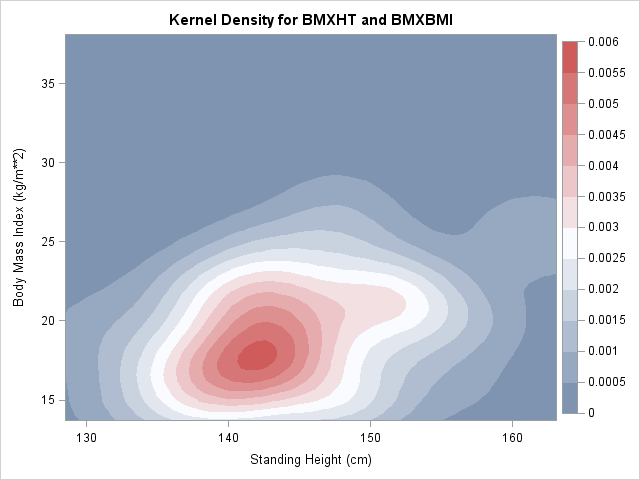
Age 11 – Height by BMI Age 12 – Height by BMI
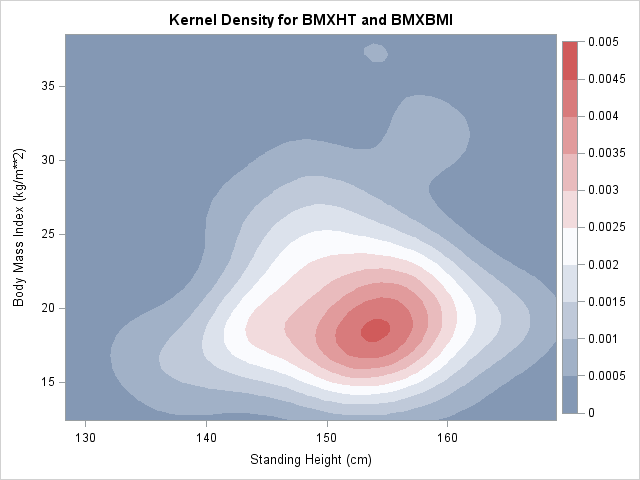
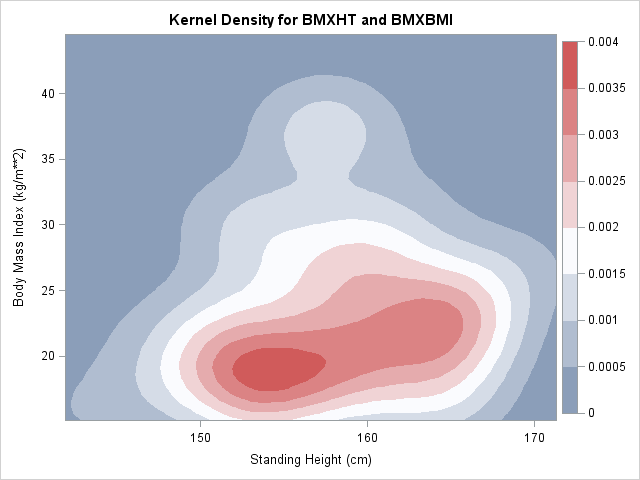
Height by Weight
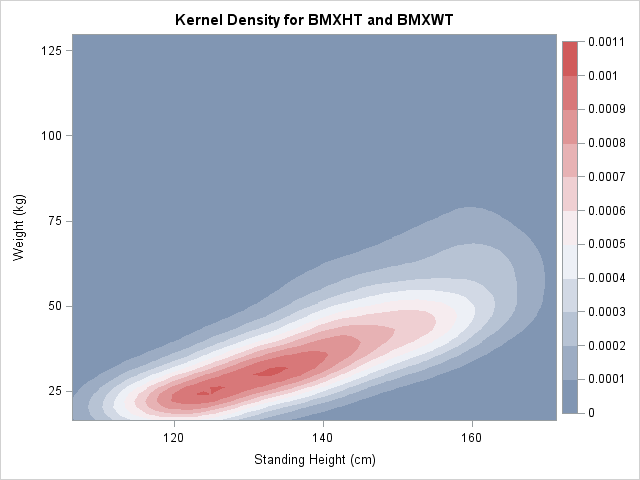
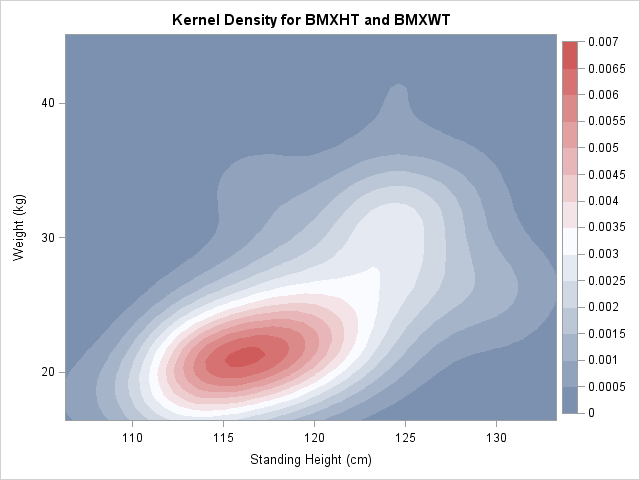
The second variable comparison reviewed was standing height in centimeters to weight in kilograms. The following contour plots show the distributions by gender and age between standing height and weight. These plots take into account the survey weights for the NHANES data. Please note that these plots do not have the axes fixed between plots so that the population distributions for each age can be shown better.
Males
The following contour plots are for males ages 6 to 12. The initial plot is all males age 6-12, and the remaining plots are for each separate age from 6 years old to 12 years old.
Everyone – Height by Weight Age 6 – Height by Weight
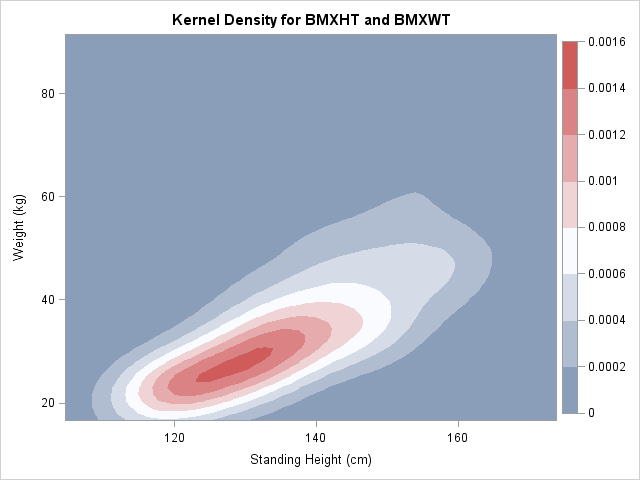
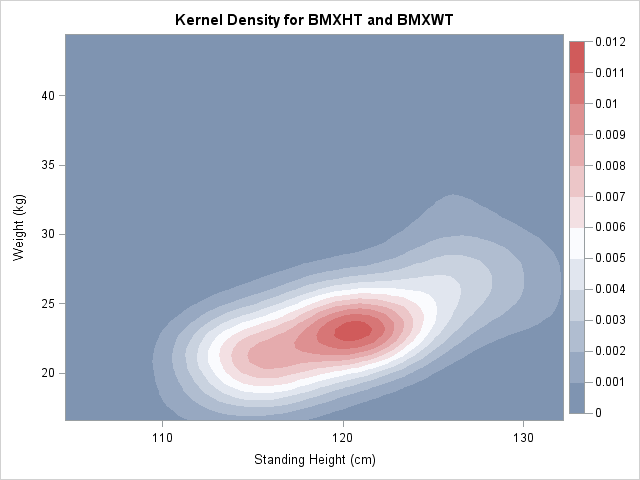
Age 7 – Height by Weight Age 8 – Height by Weight
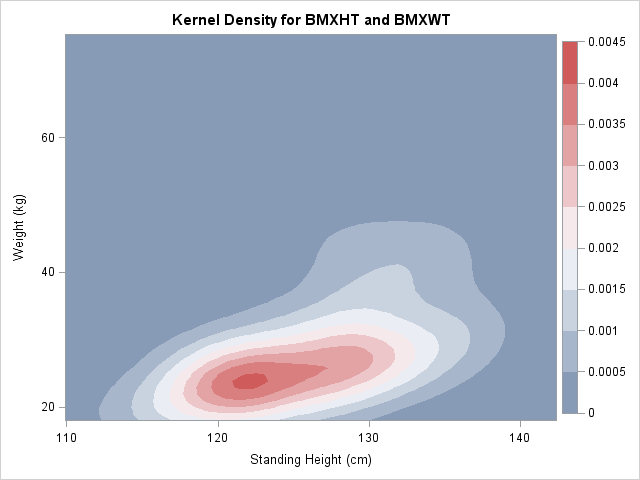
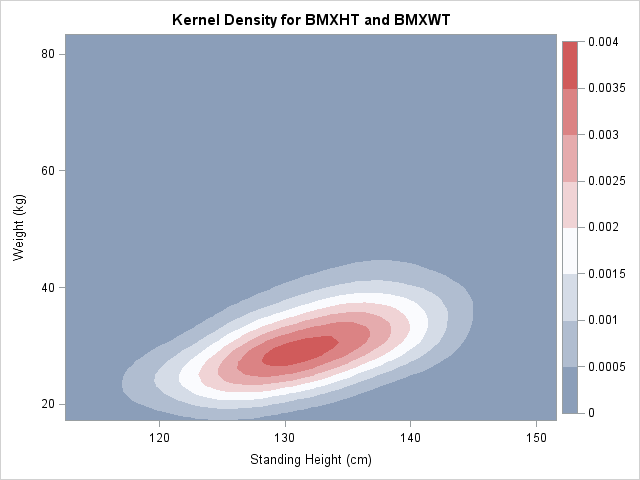
Age 9 – Height by Weight Age 10 – Height by Weight
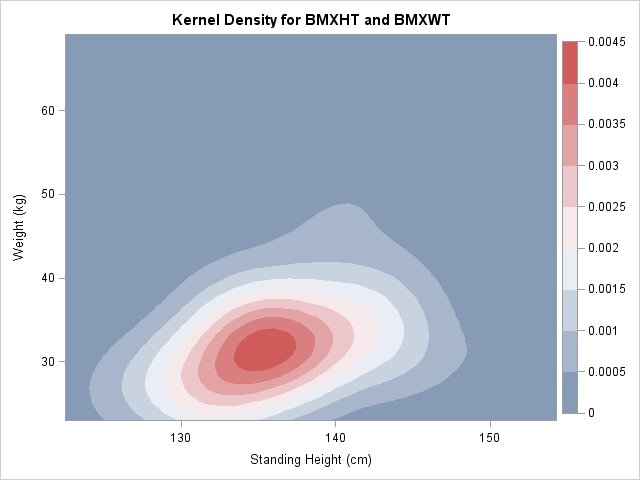
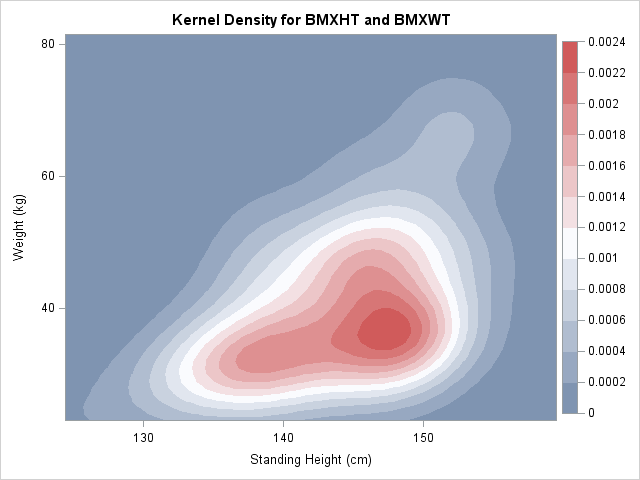
Age 11 – Height by Weight Age 12 – Height by Weight
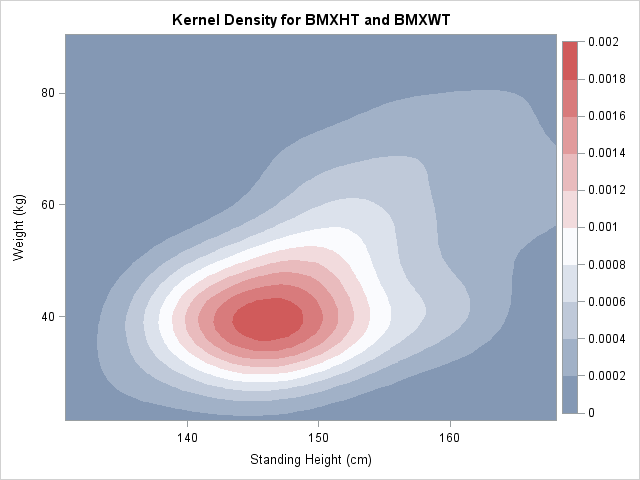
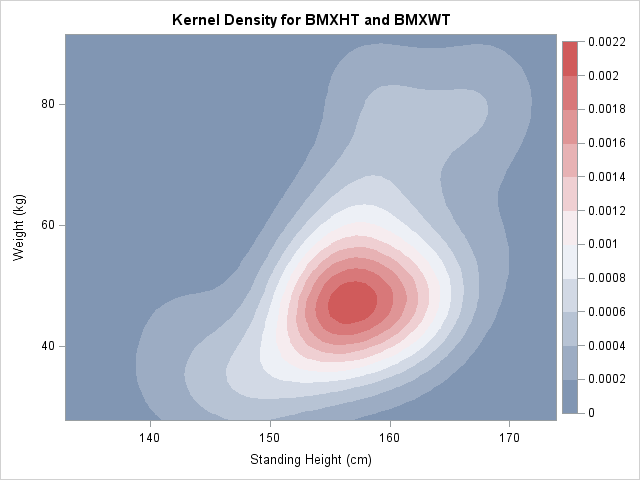
Females
The following contour plots are for females ages 6 to 12. The initial plot is all females age 6-12, and the remaining plots are for each separate age from 6 years old to 12 years old.
Everyone – Height by Weight Age 6 – Height by Weight
| File Type | application/vnd.openxmlformats-officedocument.wordprocessingml.document |
| Author | Angel, Karen C. (CDC/ONDIEH/NCIPC) |
| File Modified | 0000-00-00 |
| File Created | 2021-01-23 |
© 2026 OMB.report | Privacy Policy