NSC_ACS_DataSlideTest_StudyPlan
NSC_ACS_Data Slide Test Study Plan.docx
American Community Survey Methods Panel Tests
NSC_ACS_DataSlideTest_StudyPlan
OMB: 0607-0936
AMERICAN COMMUNITY SURVEY (ACS) |
|
PROGRAM MANAGEMENT OFFICE |
January 2018 |
ACS RESEARCH & EVALUATION ANALYSIS PLAN
|
|
2018 Data Slide Test |
|
RS17-4-0220
|
|
|
|
|
|
|
|
|
|
|
Research & Evaluation Analysis Plan (REAP) Revision Log
Version No. |
Date |
Revision Description |
Authors |
0.1 |
09/27/17 |
Initial Draft |
Barth and Heimel |
0.2 |
11/01/17 |
Critical Review Draft |
Barth and Heimel |
0.3 |
12/05/17 |
Incorporated comments from critical review |
Barth and Heimel |
0.4 |
01/02/18 |
Incorporated comments from final approval review |
Barth and Heimel |
|
|
|
|
|
|
|
|
|
|
|
|
|
|
|
|
|
|
|
|
|
|
|
|
|
|
|
|
|
|
|
|
|
|
|
|
Table of Contents
1. Introduction 1
2. Background and Literature Review 1
2.1 Current ACS Data Collection Strategy 2
2.2.1 Background for the Creation of the ACS Data Slide 2
2.2.2 Description of the ACS Data Slide 3
2.3 Survey Methodology Literature 5
3. Research Questions and Methodology 5
3.2.1 Unit Response Analysis 7
3.2.2 Item Response Analysis 8
3.3 Research Question Analysis 9
3.3.1 Question 1 9
3.3.2 Question 2 10
3.3.3 Question 3 10
3.3.4 Question 4 13
4. Potential Actions 14
5. Major Schedule Tasks 14
6. References 14
Attachment A: ACS Mailing Descriptions and Schedule for the May 2018 Panel 16
Attachment C: Statistics inside the Data Slide 18
Attachment D: Data Slide Mail Materials 20
Attachment E: ACS Questions Relating to the Data Slide Statistics 22
Introduction
The U.S. Census Bureau continually evaluates how the American Community Survey (ACS) mailing materials and methodology might be further refined to increase survey participation and reduce survey costs. Increased response in the self-response phase of data collection could substantially decrease costs for nonresponse followup interviews; increased response overall could potentially improve data quality. Increasing survey response requires overcoming factors that contribute to nonresponse. Research has shown that two of the top reasons that respondents refuse or are reluctant to answer the ACS are privacy (unwillingness to share personal information and mistrusting that personal information will remain confidential) and legitimacy (not trusting that the ACS is a legitimate survey) (Zelenak and Davis, 2013).
To address these concerns, we have created an interactive infographic tool (a “data slide”) that presents statistics generated by the ACS for the fifty states, the District of Columbia, and Puerto Rico. We intend to use the data slide as an insert in a mailing package. We hypothesize that the presence of the aggregate statistics on the data slide will reassure respondents that their personal information will never be used alone but rather will be combined with other respondent data to create aggregate estimates. We also hypothesize that the mere presence of the data slide in a mailing package will lend legitimacy to the survey, as the cost of producing and mailing such a product is only likely to be incurred by an organization with a legitimate survey.
The 2018 Data Slide Test will involve two separate mailings: some experimental cases will receive a data slide in the Initial Package and other experimental cases will receive it in the Paper Questionnaire Package (see Attachment A for a detailed description of the mailings). This test will evaluate how including the data slide as a mail insert affects unit response (the number of sample addresses that respond to the survey), item response (the quantity and quality of survey questions that are answered), and annual survey costs (data collection costs relative to current survey production). Although the addition of a data slide increases the cost of the current ACS production mailings, we hope that it will bring an increase in self-response large enough to offset the cost increase by significantly decreasing the workloads for the more costly nonresponse followup interviews.
Keywords: data quality, data collection methods, cost savings, response.
This section presents information on the current ACS data collection strategy so readers can understand how this experiment uses and modifies the current approach. We also discuss background information that led to the creation of the data slide, present a detailed description of the data slide, and discuss survey methodology research that supports the premise of the test.
To encourage self-response in the ACS, the Census Bureau sends up to five mailings to a sample address. The first mailing (Initial Package) is sent to all mailable addresses in the sample. It includes an invitation to participate in the ACS online and states that a paper questionnaire will be sent in a few weeks to those unable to respond online. About seven days later, the same addresses are sent a second mailing (Reminder Letter), which repeats the instructions to respond online, wait for a paper questionnaire, or call with questions.
Responding addresses are removed from the address file after the second mailing to create a new mailing universe of nonresponders. For the third mailing (Paper Questionnaire Package) the remaining sample addresses are sent a package with instructions for responding online, the telephone questionnaire assistance number, and a new response option –– a paper questionnaire. About four days later, these addresses are sent a fourth mailing (Reminder Postcard).
After the fourth mailing, responding addresses are again removed from the address file to create a new mailing universe of nonresponders. The remaining sample addresses are sent the Additional Reminder Postcard as a last attempt to collect a self-response (fifth mailing). Two to three weeks later, responding addresses are removed to create the universe of addresses eligible for the Computer-Assisted Personal Interview (CAPI) nonresponse followup operation.1 Of this universe, a subsample is chosen to be included in the CAPI operation. Field representatives visit addresses chosen for this operation to conduct in-person interviews.2
2.2.1 Background for the Creation of the ACS Data Slide
Many Americans are unaware of the ACS; a messaging survey in 2014 found that only 11 percent of respondents had previously heard of the ACS (Hagedorn, Green, and Rosenblatt, 2014). Another study, involving respondents in the nonresponse followup phase of data collection, revealed that two of the top reasons that respondents refuse or are reluctant to answer the ACS are privacy and legitimacy concerns (Zelenak and Davis, 2013).
We conjecture that adding an insert to a mailing may help address some of these concerns.3 In the past, an ACS mail messaging test included an insert in a mailing that gave information about why certain topics appear on the ACS and gave examples of how the data are used to benefit communities (Heimel, Barth, and Rabe, 2016). While the insert tested did not affect self-response, we thought that perhaps a different type of insert may be used to address other issues related to nonresponse. Since the ACS already has a product, called a “data wheel,” it was considered to be a good candidate to be included in a mailing.
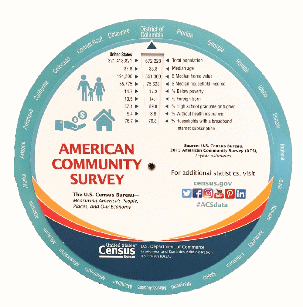
Data wheels have been used by the ACS as a marketing tool at conferences (see Attachment B for an image of a data wheel). Over 4,000 data wheels have been distributed at exhibit booths, conferences, and other venues in fiscal year 2016 and 2017 (Valdisera, 2017). The positive reaction to the data wheel led to discussions within the Census Bureau about whether distributing it to ACS survey recipients might engage them in the survey and increase self‑response rates. The idea was also supported by members of the National Academies of Science (NAS) Committee on National Statistics (CNSTAT) (NAS, 2016) and the Harvard Behavioral Insights Group.
Staff at the Census Bureau’s National Processing Center (NPC) had to test the feasibility of including the data wheel as an insert for an ACS mailing, as all mail materials must be inserted into envelopes and addressed by machine. The testing revealed that the presence of the grommet and the irregular shape of the data wheel (a circle) created machine feeding problems, which caused a slowdown with the insertion portion of assembly and the inkjets used to print the address labels. As a result, we reconfigured the data wheel into a data slide that does not require a grommet and that has the same rectangular shape as the envelope used for the mailing package.4 Data slides have been used by the Census Bureau as part of the 2010 Census in Schools program and the 2007 Economic Census, though they were handed out and not included in mailings.
2.2.2 Description of the ACS Data Slide
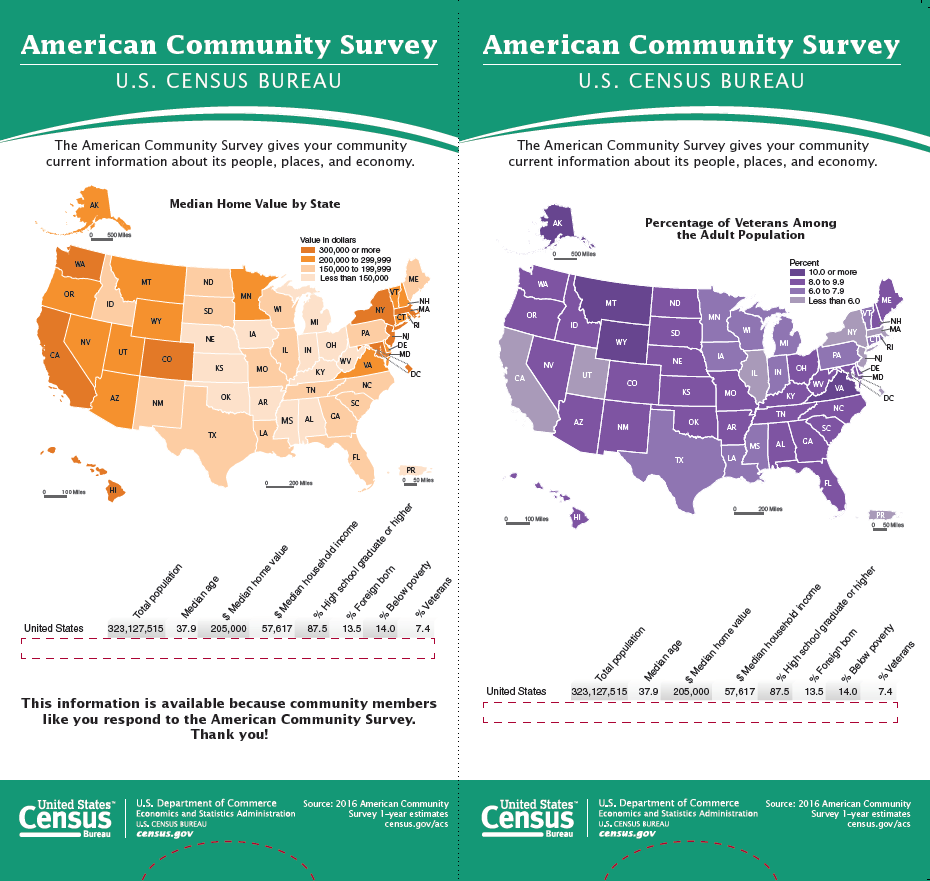
The data slide is a two-sided, hand-held tool that reports a selection of statistics from the ACS for the nation, each state, the District of Columbia, and Puerto Rico. The statistics that are included on the data slide are:
Total population
Median age
Median home value
Median household income
Percent high school graduate or higher
Percent foreign born
Percent below poverty
Percent veterans
The same national statistics are printed on both sides of the exterior of the data slide, with a rectangular cutout underneath in which the user can choose which state’s statistics to display. Two different maps are printed on the exterior, visualizing state-level distributions of two statistics. One side shows a map of state-level median home value (in orange below) and the second side shows a map of the state-level percentage of veterans (in purple below). Figure 1 shows what the exterior of the data slide looks like; the printout is folded at the dotted line.
Figure 1. Exterior of ACS Data Slide
Source: U.S. Census Bureau, American Community Survey, 2018 Data Slide Test
The interior of the data slide contains a single piece of paper, printed on both sides with statistics for the 50 states, the District of Columbia, and Puerto Rico. The 52 geographies are listed in alphabetical order with 26 on each side. A pull tab allows the user to adjust the position of the interior paper to change which geography’s statistics are visible. Only one geography will be visible at a time within the red rectangular box on each side of the exterior data slide. Attachment
C contains images of the movable interior of the data slide.
It is hypothesized that the data slide will help survey recipients trust the legitimacy of the survey, which will be reflected in an increase in response rates. Research in the field of survey methodology posits that building trust is the most important aspect of survey messaging (Dillman, Smyth, and Christian, 2014). Survey recipients are more likely to respond if they trust the organization sending them the survey. Including a data slide may help engage respondents with the survey and communicate to them the legitimacy of the survey fielded by a trusted entity.
While we are hopeful that the data slide will build trust and generate interest in completing the survey, it could also help respondents take unwanted shortcuts. Notably, respondents could copy a statistic from the data slide as their own answer to an ACS question. According to survey methodology theory, respondents with lower motivation are likely to engage in a suboptimal response strategy (satisficing) instead of an optimal one (Kaminska, McCutcheon and Billiet, 2010). Working to optimize survey responses may exceed respondents' motivation or ability, leading them to find ways to avoid doing the work while still appearing to complete a survey appropriately. These shortcuts can result in lower data quality. In this test, we will investigate whether the data slide resulted in suspected measurement error due to satisficing. This analysis is discussed in Section 3.3.3.
The research questions for this test are:
What is the impact on unit response of adding a data slide to the Initial Package mailing materials?
What is the impact on unit response of adding a data slide to the Paper Questionnaire Package mailing materials?
What is the impact on response to the items included on the data slide? Is there any impact on item nonresponse or to the estimates for those items? What is the frequency at which a response matches to a statistic found on the data slide?
What would be the cost impact, relative to current production, of implementing each experimental treatment into a full ACS production year?
This test will be conducted using the May 2018 ACS production sample. The monthly ACS production sample consists of approximately 295,000 housing unit addresses and is divided into 24 nationally representative groups (referred to as methods panel groups) of approximately 12,000 addresses each. The Control, Treatment 1, and Treatment 2 will each use two randomly assigned methods panel groups (approximately 24,000 mailing addresses per treatment).
The Control treatment will have all the same mail materials as production but will be sorted and mailed at the same time as the experimental treatment materials.5
Treatment 1 will have all of the same mail materials as production plus the data slide will be added to the Initial Package materials (the first mailing). The enclosed letter to respondents will be minimally modified to acknowledge the data slide (see Figure 5, Attachment D).
Treatment 2 will have all of the same mail materials as production plus the data slide will be added to the Paper Questionnaire Package materials (the second mailing). The enclosed letter to respondents will be minimally modified to acknowledge the data slide (see Figure 6, Attachment D).
The remaining eighteen methods panel groups not selected for the experiment will receive production ACS materials.
Both Treatments 1 and 2 will use the same data slide. Table 1 shows where the data slide will be included in the ACS mailings for each experimental treatment.
Table 1. Experimental Design for the 2018 Data Slide Test
|
1st Mailing |
2nd Mailing |
3rd Mailing1 |
4th Mailing1 |
5th Mailing2 |
Control |
Initial Package |
Reminder Letter |
Paper Questionnaire Package |
Reminder Postcard |
Additional Postcard |
Treatment 1 |
Data Slide Included |
No change |
No change |
No change |
No change |
Treatment 2 |
No change |
No change |
Data Slide Included |
No change |
No change |
1 Sent only if a response is not received prior to the third mailing
2 Sent only if a response is not received prior to the fifth mailing
Because only the envelopes for the mail packages are large enough to hold the data slide, we chose to insert the slide in the two package mailings for this test. The universe of addresses mailed the Paper Questionnaire Package is smaller than the Initial Package universe. Obtaining a significant self-response increase with the smaller mailing universe would increase cost savings, so we decided to test inserting the data slide in both mailings (one mailing for each experimental treatment).
All self-response analyses, except for the cost analysis, will be weighted using the ACS base sampling weight (the inverse of the probability of selection). The CAPI response analysis will include a CAPI subsampling factor that will be multiplied by the base weight. The sample size will be able to detect differences of approximately 1.25 percentage points between the self-response return rates of the Control and experimental treatments (with 80 percent power and α=0.1). Detectable differences for the analysis of item-level data (such as item nonresponse rates) vary depending on the item, with housing-level items having minimum detectable differences up to 1.6 percentage points. We will use a significance level of α=0.1 when determining significant differences between treatments. For analysis that involves multiple comparisons, we will adjust for the Type I familywise error rate using the Hochberg method (Hochberg, 1988).
To assess the effect of the data slide on self-response, we will calculate the self-response return rates at selected points in time in the data collection cycle. The selected points in time reflect the dates of additional mailings or the end of the data collection periods. An increase in self-response presents a cost savings for each subsequent phase of the mailing process by decreasing the number of mailing pieces that need to be sent out. A significant increase in self-response before CAPI decreases the number of costly interviews that need to be conducted. Calculating the return rates at different points in the data collection cycle gives us an idea of how the experimental treatments would affect operational and mailing costs if they were implemented into a full ACS production year.
To evaluate the impact of each mailing that will contain a data slide, the mailing universes change to include only sample addresses that received the mailing being evaluated. To evaluate whether or not the data slide has a residual effect on cooperation in nonresponse followup interviews, we will calculate CAPI response rates.
3.2.1.1 Self-Response Return Rates
To evaluate the effectiveness of the experimental treatments, we will calculate self-response return rates. The rates will be calculated for total self-response and separately for internet and mail response. For the comparisons of return rates by mode, the small number of returns obtained from Telephone Questionnaire Assistance (TQA) will be classified as mail returns.
The rates will be calculated using the following formula:
Self-Response Return Rate |
= |
Number of mailable and deliverable sample addresses that either provided a non-blank6 return by mail or TQA, or a complete or sufficient partial response by internet |
* 100 |
Total number of mailable and deliverable sample addresses7 |
There are two universes of interest for the analyses to evaluate how including a data slide might affect self-response: (1) the universe of all mailable and deliverable sample addresses that are mailed the Initial Package and (2) the universe of all mailable and deliverable sample addresses that are mailed the Paper Questionnaire Package.
3.2.1.2 CAPI Response Rates
To evaluate whether or not the data slide has a residual effect on cooperation in nonresponse followup interviews, we will calculate CAPI response rates by using the formula below:
CAPI Response Rate |
= |
Number of completed responses from a CAPI interview |
* 100 |
Total number of addresses in the CAPI sample |
All nonresponding addresses in the initial sample are eligible for the CAPI sample, including unmailable and undeliverable addresses. Addresses eligible for CAPI are sampled at a rate of about one in three, due to the high cost of obtaining a response via personal interviews. The weights are adjusted with a subsampling factor. This factor will be multiplied by the base weights for CAPI response rate calculations.
We will also calculate item nonresponse rates and form completion rates to assess the impact of the experimental treatments. Form completion is the number of questions on the form that were answered among those that should have been answered. The number of questions that should have been answered is determined based on questionnaire skip patterns and respondent answers. Formulas for item nonresponse and form completion rates are presented below.
Item Nonresponse Rate |
= |
Number of nonresponses to item of interest |
*100 |
Universe for item of interest |
Overall Form Completion Rate |
= |
Number of questions answered |
*100 |
Number of questions that should have been answered |
We will use the same analysis universes for item nonresponse rates and form completion rates as was used for self-response return rates. Treatment 1 rates and comparisons with Treatment 1 will use all addresses that were mailed the Initial Package and that self-responded. Treatment 2 rates and comparisons with Treatment 2 will use all addresses that were sent the Paper Questionnaire Package and self-responded. We will analyze each treatment overall and by mode. Research has shown that responses by mail have higher item nonresponse than responses by internet (Clark, 2015).8
For item nonresponse rates and form completion rates, the timing of a response is not a factor in the analysis. As a result, we can combine Production responses with Control responses for the control universe of analysis. Combining the Control and Production universes will lead to a larger sample size and thus reduce the standard error of the baseline estimates. All mailable addresses from both Production and Control that self-respond will constitute the baseline comparison for Treatment 1. All mailable addresses from both Production and Control that are sent the Paper Questionnaire Package and self-respond will constitute the baseline comparison for Treatment 2.
We will calculate these rates using two-tailed hypothesis tests at the α = 0.1 level. The purpose of the item response analyses is to ensure that the presence of the data slide does not adversely affect response to specific items on the survey. We do not expect there to be an effect, however it is necessary to perform due diligence and ensure that this is the case. The analyses will not be a part of the decision making criteria for using the data slide in production, unless we find a significant effect on response. As such, we will only report on significant findings.
The following section provides detailed methodology for each of the research questions.
What is the impact on unit response of adding a data slide to the Initial Package mailing materials?
To assess the impact on self-response of adding the data slide to the Initial Package mailing materials, we will calculate and compare self-response return rates of the Initial Package mailing universe for Control and Treatment 1. Since an increase in self-response will decrease the cost of the second phase of the data collection cycle targeting nonresponders, we will compare self-response return rates just before the Paper Questionnaire Package mailing, before the fifth mailing, and just before the start of CAPI. We will compare return rates by mode and overall.
To assess if the data slide has an effect on cooperation in the CAPI response phase of data collection, we will also compare CAPI response rates between the Control and Treatment 1. We will make comparisons using a two-tailed hypothesis test. The null hypothesis will be H0: T1 = Control and the alternative hypothesis HA: T1 ≠ Control.
What is the impact on unit response of adding a data slide to the Paper Questionnaire Package mailing materials?
To evaluate the effect on self-response of including a data slide in the third mailing, we will calculate and compare self-response return rates of the Paper Questionnaire Package mailing universe for Control and Treatment 2. This universe will be smaller than the Initial Package mailing universe because addresses that respond previously will be removed from the mailing list. The return rates will be calculated just before the fifth mailing and before the start of CAPI.
To assess if the data slide has an effect on cooperation in the CAPI response phase of data collection, we will also compare CAPI response rates between the Control and Treatment 2. We will make comparisons using a two-tailed hypothesis test. The null hypothesis will be H0: T2 = Control and the alternative hypothesis HA: T2 ≠ Control.
We will also compare the return rates prior to the questionnaire mailing in order to confirm that there are no differences between the Control and Treatment 2 at that point in the data collection cycle.9
What is the impact on response to the items seen on the data slide? Is there any impact on item nonresponse or to the estimates for those items? What is the frequency at which a response is an exact match to the corresponding item found on the data slide?
To assess the impact that the data slide might have on response to distinct ACS questions, we will assess the following:
Form completion rates
Item nonresponse rates to the ACS questions corresponding to data slide statistics
Whether estimates appear to be influenced by a respondent seeing them on the data slide
Rates at which data slide statistics are used as a respondent’s own answer
Form completion rates (FCR) will be assessed at the housing-unit level while the other three parts of this analysis will be assessed at the question-level.
For the first part of this analysis, we will analyze answers across an entire housing unit’s response to identify and compare form completion rates. The rate of form completion is the number of questions on the form that were answered among those that should have been answered (see Section 3.3). The number of questions that should have been answered is determined based on questionnaire skip patterns and respondent answers. We will use the (Production + Control) universe as the baseline for comparisons. Comparisons with Treatment 2 will only include cases that were sent the Paper Questionnaire Package. Analysis will use two-tailed tests with the following null hypotheses:
T1FCR = BaselineFCR
T2FCR = BaselineFCR
The alternative hypothesis will be of the form HA: TiFCR ≠ BaselineFCR. All self-response returns that are in universe will be analyzed and results will be reported both by mode and overall.
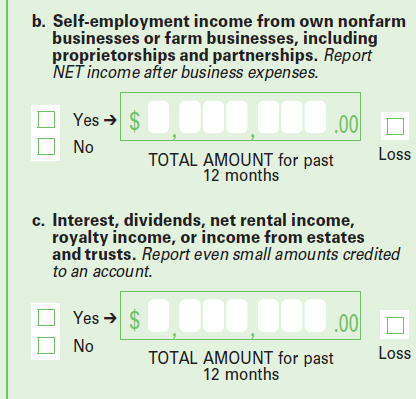
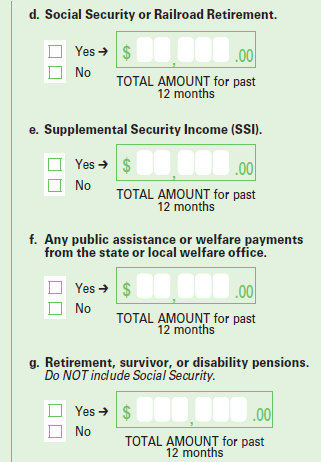
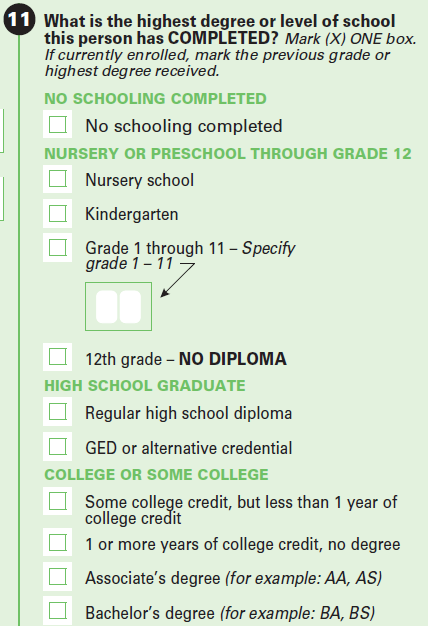
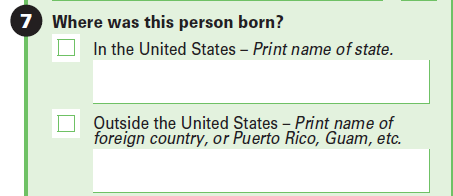
Remaining analyses will be done on individual ACS data items. The second part of this analysis will assess item nonresponse rates (INR) to the ACS questions that correspond to data slide statistics. The connection of each data slide statistic to the ACS question is given in Table 2.
Table 2. Item Nonresponse for the Data Slide Test
Data Item |
Universe of Interest |
Associated ACS Question |
Total Population/ Household Population Count |
All housing units that respond by mail |
Front Page of Questionnaire |
Age |
All persons |
Person Question 4 |
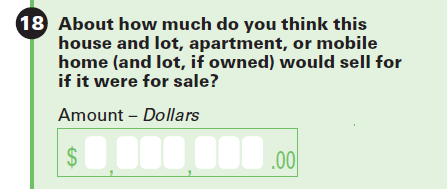
Home value |
All housing units known to be owner-occupied |
Housing Question 19 |
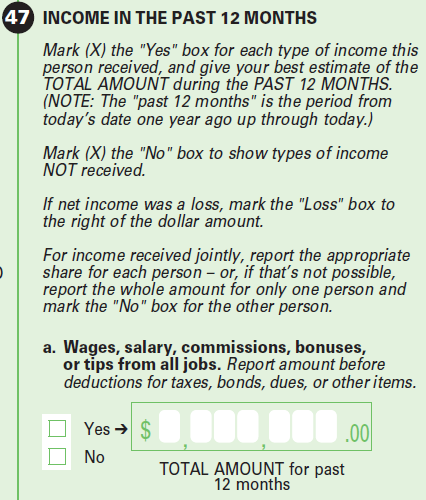
Household income |
All housing units; income based on responses of household members aged 15 and older |
Person Questions 47 and 48 |
Educational attainment |
All persons |
Person Question 11 |
Foreign born |
All persons |
Person Question 7 |
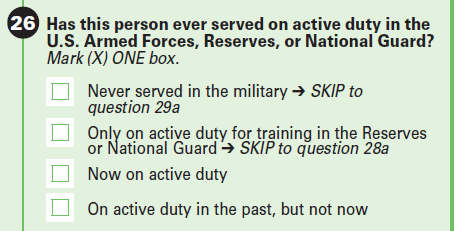
Veterans |
All persons aged 18 or older |
Person Question 26 |
Note: See Attachment E for images of the ACS questions referenced in this table.
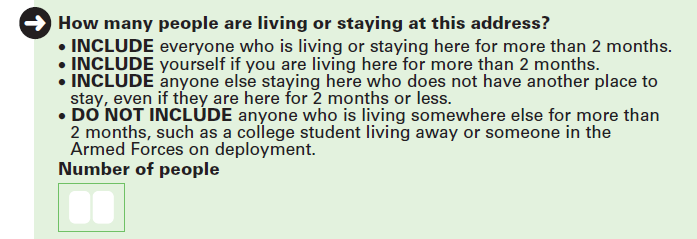
One statistic on the data slide is Total Population. The count of persons in each house can be acquired either by asking directly for the number of persons living or staying at an address or by asking for the names of all persons living there (thus indirectly acquiring a number of persons). The first approach is used on the ACS paper questionnaire while the second approach is used on the internet instrument. As a result, we will only use responses received by mail to assess item nonresponse to the total population count.
Since Poverty is not a distinct question on the ACS but an amalgam of multiple questions, we cannot assess item nonresponse for a distinct poverty question. However, the items that make up the poverty statistic (Household Population Count, Age of each household member, and Household Income) will be a part of the item nonresponse analysis.
To test item nonresponse rates, we will use a series of two-tailed tests with the following null hypotheses.
T1popINR = BaselinepopINR
T1ageINR = BaselineageINR
T1HomeValueINR = BaselineHomeValueINR
T1IncomeINR = BaselineIncomeINR
T1EducationINR = BaselineEducationINR
T1ForeignBornINR = BaselineForeignBornINR
T1VeteransINR = BaselineVeteransINR
T2popINR = BaselinepopINR
T2ageINR = BaselineageINR
T2HomeValueINR = BaselineHomeValueINR
T2IncomeINR = BaselineIncomeINR
T2EducationINR = BaselineEducationINR
T2ForeignBornINR = BaselineForeignBornINR
T2VeteransINR = BaselineVeteransINR
All alternative hypotheses will be of the form HA: Timetric ≠ Baselinemetric.
As referenced in Table 2, income is collected at the person-level but will be assessed at the household level for this analysis of item nonresponse. We will use the (Production + Control) universe as the baseline for comparisons. Comparisons with Treatment 2 will only include cases that were sent the Paper Questionnaire Package. Results will be reported both by mode and overall.
For the third part of this analysis, we will investigate the possibility of the data slide influencing respondent answers and therefore the resulting statistics. We will generate the same statistics that are on the data slide (such as Median Age), but all estimates will come from the unedited data from this test and will not be directly comparable to the official estimates. The statistics will be aggregate national-level totals. Once again, the Production and Control treatments will be combined for the baseline estimate and comparisons with Treatment 2 will only include cases that were sent the Paper Questionnaire Package.
The following null hypotheses will be used:
T1TotalPop = BaselineTotalPop
T1MedianAge = BaselineMedianAge
T1MedianHomeValue = BaselineMedianHomeValue
T1MedianHouseholdIncome = BaselineMedianHouseholdIncome
T1%HighSchoolGradOrHigher = Baseline%HighSchoolGradOrHigher
T1%ForeignBorn = Baseline%ForeignBorn
T1%Veterans = Baseline%Veterans
T2TotalPop = BaselineTotalPop
T2MedianAge = BaselineMedianAge
T2MedianHomeValue = BaselineMedianHomeValue
T2MedianHouseholdIncome = BaselineMedianHouseholdIncome
T2%HighSchoolGradOrHigher = Baseline%HighSchoolGradOrHigher
T2%ForeignBorn = Baseline%ForeignBorn
T2%Veterans = Baseline%Veterans
All alternative hypotheses will be of the form HA: Timetric ≠ Baselinemetric.
For the fourth part of this analysis, we will investigate the possibility of respondents using data slide statistics as their own answers, an example of satisficing (see Section 2.3). We will identify the frequency with which a housing unit reports either the national or a state-level statistic for home value or income. For example, any housing unit that reports a home value of $205,000 (the national median home value) would be flagged. For income, a housing unit where any individual income component is an exact match to the national median household income ($57,617) would be flagged, as would any housing unit where the household income sums to one of the data slide statistics. For this analysis, any state statistic that appears on a return will be flagged, regardless of the return’s state; that is, a return from California that reports a home value of $267,900 (Alaska’s median home value) would be flagged. The percent of cases with such a flag in each treatment will be compared to the percent with such a flag in the Control + Production baseline universe. The following null hypotheses will be used (PM = Percent Match).
T1IncomePM = BaselineIncomePM
T1HomePM = BaselineHomeValuePM
T2IncomePM = BaselineIncomePM
T2HomeValuePM = BaselineHomeValuuPMt
All alternative hypotheses will be of the form HA: Timetric ≠ Baselinemetric.
What would be the cost impact, relative to current production, of implementing each experimental treatment into a full ACS production year?
To determine the cost impact, relative to current production, of implementing each experimental treatment into ACS production, we will consider the return rates and the associated costs of data collection. We will calculate weighted self-response return rates using the Initial Mailing universe for the Control treatment, Treatment 1, and Treatment 2. The rates will be calculated before the start of the CAPI operation. We will compare each experimental treatment to the Control treatment using two-tailed hypothesis tests.
Significant differences in the return rates could affect printing, assembly, and postage costs, as well as costs for data capture and nonresponse followup activities. An increase in self-response may have an overall positive impact on total operational costs, while a decrease in self-response may have an overall negative impact on total operational costs. We will identify the estimated impact on data collection costs and provide a relative cost impact for each experimental treatment compared to current production costs. The relative cost impact will account for the difference in costs for printing the data slides as well as differences in the CAPI workload if there is a significant increase or decrease in self-response. Since this cost model uses projected workload differences to project survey costs, this part of the analysis will not be weighted.
Based on the results of this research, the Census Bureau may consider including the data slide in ACS production mail materials. If a change is made, the decision about what mail package to add the data slide to will be informed by the cost analysis and self-response metrics of each experimental treatment.
Tasks (minimum required) |
Planned Start |
Planned Completion |
To Be Tracked in MAS (Y/N)? |
Author drafts REAP, obtains CR feedback, updates and distributes Final REAP |
08/30/17 |
12/26/17 |
|
PM/Author conducts response and cost analysis and drafts report |
08/13/18 |
01/04/19 |
|
Author obtains CR feedback and updates report |
01/07/19 |
02/01/19 |
|
Author develops presentation and conducts briefing to R&E WG |
02/05/19 |
02/15/19 |
|
Author updates final report, obtains approvals and posts to Internet |
02/18/19 |
05/03/19 |
|
Author develops and obtains approval of the R&E Project Record (REPR) |
05/06/19 |
05/20/19 |
|
Author presents to ACS Research Group (if desired) |
TBD |
TBD |
|
Clark, S. (2015). “Documentation and Analysis of Item Allocation Rates.” 2015 American Community Survey Research And Evaluation Report Memorandum Series #ACS15-RER-03. Retrieved on October 17, 2017 from https://www.census.gov/content/dam/Census/library/working‑papers/2015/acs/2015_Clark_01.pdf
Dillman, D., Smyth, J., and Christian, L. (2014). Internet, Phone, Mail, and Mixed-Mode Surveys: The Tailored Design Method (4th ed.). Hoboken, NJ: Wiley.
Hagedorn, S., Green, R., and Rosenblatt, A. (2014). “ACS Messaging Research: Benchmark Survey.” Washington, DC: US Census Bureau. Retrieved on January 17, 2017 from
https://www.census.gov/library/working-papers/2014/acs/2014_Hagedorn_01.html
Heimel, S. K. (2016). “Postal Tracking Research on the May 2015 ACS Panel.” 2016 American Community Survey Research and Evaluation Report Memorandum Series #ACS16-RER-01, April 1, 2016.
Heimel, S., Barth, D., and Rabe, M. (2016). “‘Why We Ask’ Mail Package Insert Test.” 2016 American Community Survey Research and Evaluation Report Memorandum Series #ACS-RER-10. Retrieved on December 1, 2017 from
https://www.census.gov/content/dam/Census/library/working‑papers/2016/acs/2016_Heimel_01.pdf
Hochberg, Y. (1988). “A Sharper Bonferroni Procedure for Multiple Tests of Significance.” Biometrika, 75 (4), 800-802. Retrieved on January 17, 2017 from http://www.jstor.org/stable/2336325?seq=1#page_scan_tab_contents
Joshipura, M. (2010). “Evaluating the Effects of a Multilingual Brochure in the American Community Survey.” DSSD 2010 American Community Survey Memorandum Series #ACS10-RE-03. Retrieved on December 7, 2017 from https://www.census.gov/content/dam/Census/library/working‑papers/2010/acs/2010_Joshipura_01.pdf
Kaminska, O., McCutcheon, A., and Billiet, J. (2010). “Satisficing Among Reluctant Respondents In A Cross-National Context.” Public Opinion Quarterly, Vol 74, No. 5.
The National Academies of Sciences, Engineering, and Medicine. (2016). “Respondent Burden in the American Community Survey: Expert Meeting on Communicating with Respondents and the American Public.” Meeting minutes from June 2, 2016.
Valdisera, J. (2017). “Re: Data Wheel.” Message to Sarah Heimel. September 22, 2017. Email.
Zelenak, M.F., and Davis, M. (2013). “Impact of Multiple Contacts by Computer-Assisted Telephone Interview and Computer-Assisted Personal Interview on Final Interview Outcome in the American Community Survey.” Washington, DC: US Census Bureau. Retrieved on January 17, 2017 from
https://www.census.gov/library/working-papers/2013/acs/2013_Zelenak_01.html
Attachment A: ACS Mailing Descriptions and Schedule for the May 2018 Panel
Mailing |
Description of Materials |
Mailout Date |
Initial Package* |
A package of materials containing the following: Internet Instruction Card, Introduction Letter, Multilingual Informational Brochure, and Frequently Asked Questions (FAQ) Brochure. This mailing urges housing units to respond via the internet. Includes Data Slide between the letter and the multilingual brochure for Treatment 1. |
04/26/2018 |
Reminder Letter |
A reminder letter sent to all addresses that were sent the Initial Package, reiterating the request to respond. |
05/03/2018 |
Paper Questionnaire Package* |
A package of materials sent to addresses that have not responded. Contains the following: Paper Questionnaire, Internet Instruction Card, Introduction Letter, FAQ Brochure, and Return Envelope. Includes Data Slide between the instruction card and the letter for Treatment 2. |
05/17/2018 |
Reminder Postcard |
A reminder postcard sent to all addresses that were also sent the Paper Questionnaire Package, reiterating the request to respond. |
05/21/2018 |
Additional Reminder Postcard |
An additional reminder postcard sent to addresses that have not yet responded and are ineligible for telephone follow-up. |
06/07/2018 |
Note: Items marked with an asterisk (*) were part of the experimental treatments for this test.
Attachment B: Data Wheel
Figure 2 shows the ACS data wheel using 2015 1-year estimates to report select statistics for the country and for each state. The reverse side of the data wheel contains the states in the other half of the alphabet. The grommet is the metal ring in the center.
Figure 2. 2015 ACS Data Wheel
Attachment C: Statistics inside the Data Slide
The interior of the data slide contains a single piece of paper, printed on both sides with statistics for the 50 states, the District of Columbia, and Puerto Rico. The first 26 entities in alphabetical order appear on one side (Figure 3) and the second 26 appear on the reverse side (Figure 4).
Figure 3. Interior of the Data Slide (Side 1)
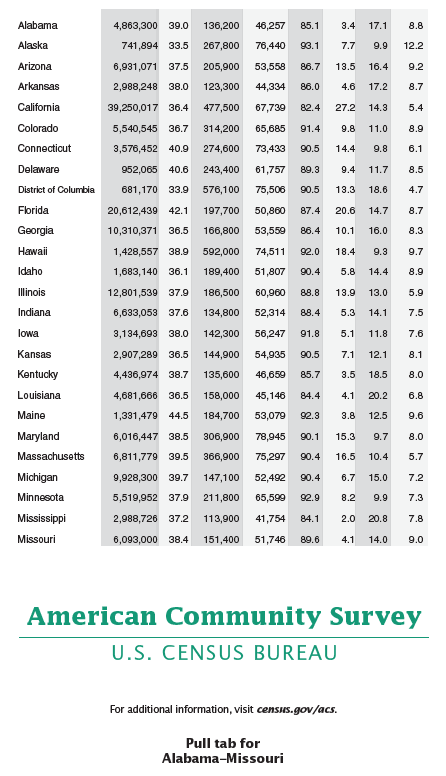
Figure 4. Interior of the Data Slide (Side 2)

Attachment D: Data Slide Mail Materials
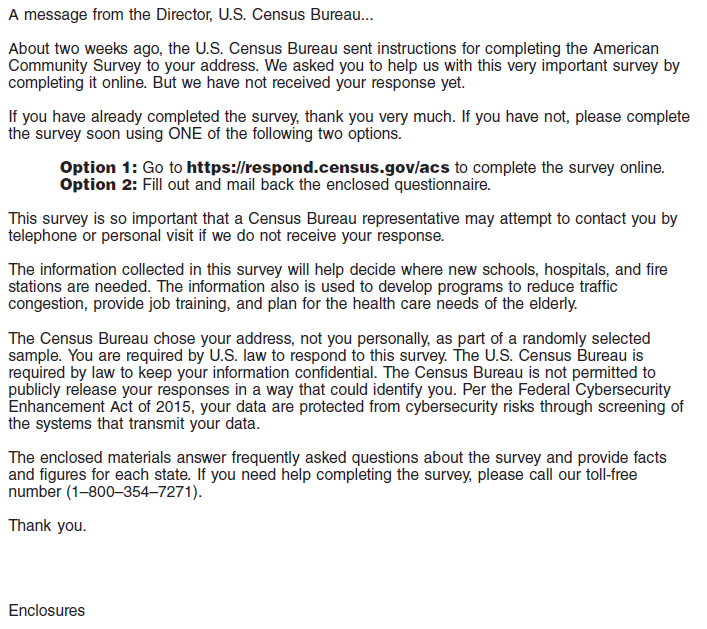
A letter is included in each mail package to ACS recipients. For the Data Slide Test, the letter has been modified to acknowledge the data slide. The last paragraph of each letter includes the sentence, “The enclosed materials answer frequently asked questions about the survey and provide facts and figures for each state.”
Figure 5. Wording for the Letter in the Initial Package
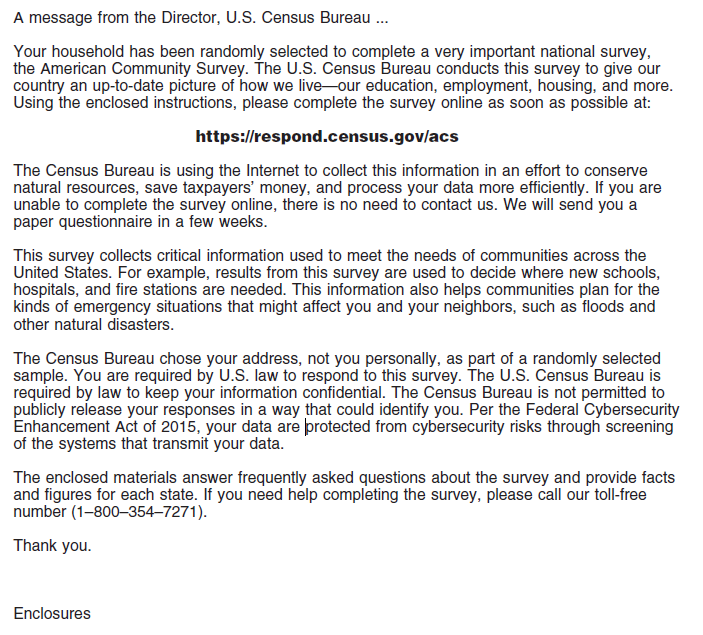
Figure 6. Wording for the Letter in the Paper Questionnaire Package
Attachment E: ACS Questions Relating to the Data Slide Statistics
The data items that are included on the data slide are:
Total population
Median age
Median home value
Median household income
Percent high school graduate or higher
Percent foreign born
Percent below poverty
Percent veterans
The following images show the ACS questions, as they appear on the paper questionnaire.
Total Population
Age and Date of Birth

Home Value
Household Income –
asked at the person-level

High School Graduate or Higher

Foreign Born
Below Poverty
This statistic takes into consideration the number of people in a household, their ages, and the household income.
Veterans
1 CAPI interviews start on the first of the month following the Additional Postcard Reminder mailing.
2 CAPI interviewers also attempt to conduct interviews by phone when possible.
3 In 2009, a multilingual brochure was tested in order to reach out to limited English-speaking households. Adding the multilingual brochure led to an increase in response from linguistically-isolated households (Joshipura, 2010) so the brochure has been in all Initial Packages since then.
4 The slides were tested and were successfully inserted so the envelopes could be labelled by machine.
5 Previous research indicates that in ACS experiments using methods panel groups, postal procedures alone could cause a difference in response rates at a given point in time between smaller experimental treatments and larger control treatments, with response for the small treatments having a negative bias (Heimel, 2016).
6 A blank form is a form in which there are no persons with sufficient response data and there is no telephone number listed on the form.
7 We will remove addresses deemed to be Undeliverable as Addressed by the Postal Service if no response is received.
8 On housing-level items, 2.5 percent (standard error of 0.01) of required answers had to be allocated from internet responses compared to 8.6 percent (0.02) requiring allocation from mail responses. On person-level items, 8.9 percent (0.04) of required answers had to be allocated from internet responses compared to 12.8 percent (0.03) requiring allocation from mail responses.
9 If the rates differ significantly, we will make an adjustment to the rates calculated after the experimental treatment is applied to determine the effect of the experiment on return rates.
| File Type | application/vnd.openxmlformats-officedocument.wordprocessingml.document |
| File Title | Data Slide Methods Panel Test Study Plan |
| File Modified | 0000-00-00 |
| File Created | 2021-01-21 |
© 2026 OMB.report | Privacy Policy
