3D questionnaire
3D Nation National Enhanced Elevation Study 2018
3D Nation FAQs updated 12-15-17_clean
3D questionnaire
OMB: 0648-0762
Frequently Asked Questions (FAQs)
It is important for respondents to the questionnaire to understand the answers to the 31 FAQs explained, with graphic examples, below. The terms explained herein must be understood in order to provide valid responses to questions pertaining to 3D elevation data requirements and benefits. The individual FAQs will be repeated as you come to the relevant questions in the questionnaire.
FAQ #1: What is a Program, a Business Use (BU) and a Mission Critical Activity (MCA)?
A program is a major component of an organization that has a well-defined mission and goals and which is supported by one or more Mission Critical Activities (MCAs). For the purpose of this study, an MCA is an activity or process that uses some form of elevation data, including derivative products, to accomplish a Business Use (BU) for which we specify 30 pre-selected BUs for use in this study. For example, within an emergency management program, hydrologic and hydraulic (H&H) modeling could be an MCA that supports BU #15 (Flood Risk Management) that requires elevation data for effective H&H modeling. Mission Critical is defined as “indispensable for mission accomplishment and/or essential for effective/efficient operations in accomplishing the core mission of the organization.”
Table 1 shows the list of 30 BUs used in the questionnaire, along with examples of MCAs that fit within each BU. Questionnaire respondents will be asked to name their own MCA(s) using their own words and to also identify one of the pre-selected BUs as primary that best fits your MCA. You may also select a secondary and tertiary BU, if any, that also fit your MCA.
Table 1. Business Uses and Examples of Mission Critical Activities.
Business Uses |
Examples of Mission Critical Activities |
BU 01 - Water Supply and Quality |
Fate and transport of contaminants. Pollution risk mitigation. Runoff and sedimentation analyses. Point- or non-point source pollution modeling. Management of contaminants and marine debris - point, non-point, vessel, and atmospheric pollution; spills; trash. |
BU 02 – Riverine Ecosystem Management |
Stream channel analysis and mapping. Stream bank erosion analysis. Aquatic and terrestrial species habitat management. Environmental management. |
BU 03 - Coastal Zone Management |
Analysis of coastal erosion and inundation. Hurricane storm surge and wind damage modeling and assessment. Coastal hazard modeling and mapping. Coastal hazard mitigation. Tsunami modeling. Land use and environmental planning. Coastal resiliency. Oil spill modeling. Littoral zone management including dunes and beaches. |
BU 04 – Forest Resources Management |
Forest health assessment. Determination of standing inventory of forest resources. Prescribed burn planning. Analysis of carbon stocks for trade. Harvest systems planning. |
BU 05 – Rangeland Management |
Assessment of rangeland health. Mapping for soil erosion potential due to grazing. |
BU 06 - Natural Resources Conservation |
Conservation engineering. Soils and wetlands mapping and characterization. Modeling of biological and ecological systems. Erosion control. Rainfall penetration studies, impervious surfaces. Assessment of blue carbon stocks. |
BU 07 – Wildlife and Habitat Management |
Conservation planning for wildlife refuges and marine sanctuaries. Conservation of critical habitats. Management of diverse migratory bird habitats, coral reef and coral communities, marine mammals, protected fish species, and trust resources. |
BU 08 – Agriculture and Precision Farming |
Farm pond design. Irrigation system design. Detailed site analysis to support precision farming. Analysis of farm sedimentation and runoff. Calibration of fertilizer application, fertilizer management, and irrigation planning. Optimized terraforming. |
BU 09 – Fisheries Management and Aquaculture |
Management of fisheries. Sustainable aquaculture. |
BU 10 – Geologic Resource Assessment and Hazard Mitigation |
Geologic mapping and analysis. Sinkhole and steephead mapping, monitoring, and analysis. Identification of geomorphologic units. Landslide hazard mapping and assessment. Karst mapping, including springs and caves. Aquifer recharge. |
BU 11 – Resource Mining |
Sediment management. Monitoring sand as a local resource. Offshore mineral extraction. Open mine volume computations. Stockpile analysis. Environmental impact assessment and site restoration. |
BU 12 – Renewable Energy Resources |
Alternate energy development – solar, tidal, wind, wave, and ocean current. Assessment of rooftops for solar energy potential. Analysis of wind energy potential and turbine placement. Low head power potential for hydropower. |
BU 13 – Oil and Gas Resources |
Oil and gas exploration and production. Pipeline and route selection. Facility siting to mitigate geologic hazards. Construction planning. Environmental impact assessment and mitigation. Regulatory compliance. |
BU 14 - Cultural Resources Preservation and Management |
Discovery and analysis of underwater archaeological and historical cultural sites. Site protection and preservation planning. Discovery and analysis of Native American and other historical cultural sites and subsistence activities. |
BU 15 – Flood Risk Management |
Flood risk modeling and mapping of riverine and coastal areas. Dam/dike/levee safety analysis. Emergency management. Flood forecasts. |
BU 16 – Sea Level Rise and Subsidence |
Modeling and mapping the effects of sea level rise or subsidence. Population and economic vulnerability assessments. Coastal inundation and infrastructure assessment. |
BU 17 – Wildfire Management, Planning and Response |
Determination of forest fuel and fire susceptibility. Fire behavior modeling to support wildfire suppression activities. Wildland/urban interface building identification. Post fire analysis to determine landslide prone areas. |
BU 18 – Homeland Security, Law Enforcement, Disaster Response, and Emergency Management |
Infrastructure and border protection. Coastal search and rescue. Population dynamics. Emergency fuel supply and movement. Line of sight analysis in urban areas. Disaster response. Flood risk analysis resulting from acts of terrorism. |
BU 19 – Land Navigation and Safety |
Road and railroad route selection and maintenance. Slope analysis for autonomous cars. GPS navigation visualization. |
BU 20 – Marine and Riverine Navigation and Safety |
Nautical charting. Bathymetric measurements of near-shore submerged coastal topography. Identification of hazards to navigation. Sediment management at coastal navigation projects. Precision marine navigation. Movement of goods and fishing vessels. |
BU 21 – Aviation Navigation and Safety |
Determination of in-flight hazards and path obstructions. Aeronautical charting. Runway construction and repair. |
BU 22 – Infrastructure and Construction Management |
Marine construction. Bridge design and construction. Engineering and construction of dams, levees, dikes, reservoirs, and coastal structures. Shipyard and port construction. Water, sewer, or power line planning and vegetation analysis. Pump, drain, and well placement. Stormwater modeling. Cut and fill analysis for earth-moving. Building site analysis. Road infrastructure. Infrastructure hardening or mitigation for climate change effects, e.g. sea level change. |
BU 23 – Urban and Regional Planning |
Land development and zoning. Municipal mapping of building footprints and elevations. Port resilience planning. Parks and transportation planning. Virtual city creation. Urban ecology planning. |
BU 24 – Health and Human Services |
Health emergency response. Habitat modeling and disease prevention. Defining boundaries for health advisories for swimming and fishing. Marine-based bioproducts and pharmaceuticals. Public health and safety. Prevention of waterborne diseases. |
BU 25 – Real Estate, Banking, Mortgage, and Insurance |
Assessment of risk for natural hazards (e.g., sinkholes, flooding) to inform insurance policy rates and the determination of mandatory insurance. Building permit compliance. |
BU 26 – Education K-12 and Beyond, Basic Research |
Development of 3-D visualizations to help students understand the Earth they live on. Understanding of continental-scale climate change impacts. Ocean science. Ocean education. Scientific research. Data dissemination. Development of training simulators. |
BU 27 – Recreation |
Planning and development of recreational facilities such as rafting, boating, swimming, diving, and fishing areas; ski slopes; and golf courses. Location-based products and services such as maps and guides. Tourism. Trail and vista site planning. Orienteering. |
BU 28 - Telecommunications |
Telecommunication tower site selection. Design of radio and radar systems. Interference analysis. Path profiles. Undersea telecommunication route selection and deployment. |
BU 29 - Military |
Tactical military operations. Strategic defense. Amphibious landings and logistics over-the-shore. Operation of ships and submarines. Weapons system testing. Management of flight facilities and offshore launch or target areas. |
BU 30 – Maritime and Land Boundary Management |
Delimitation of legal and other coastal boundaries, inland boundaries, and ordinary high water lines (OHWL). |
FAQ #2: What are NOAA’s and USGS’s mapping and coordinating mandates?
NOAA and USGS are authorized to conduct their mapping programs through the Coast and Geodetic Survey Act of 1947 (33 USC 883a et seq) and the Organic Act of March 3, 1879 (20 Stat. 394; 43 U.S.C. 31), respectively. NOAA, USGS, and their federal partners are also directed to improve coordination and collaboration through the Ocean and Coastal Mapping Integration Act of 2009 (OCMIA, P.L. 111-11, Title XII, Subtitle B).
FAQ #3: Who is being asked to participate in the study?
Because 3D elevation data are collected and used to meet a wide range of mission critical needs, the study is seeking input from managers and data users from a variety of government entities (e.g., Federal, State, local, Tribal) as well as not-for-profit, academic, private, and commercial entities. By learning more about your business uses and associated benefits that would be realized from improved 3D elevation data, we will be able to prioritize and direct investments that will best serve the user community needs. The findings are expected to establish national business needs and associated benefits for 3D elevation data and associated technologies. This information will enhance the responsiveness of NOAA, USGS, and other Federal agency programs to meet stakeholder needs, and inform the design of directed future programs that balance requirements, benefits, and costs at a national scale.
FAQ #4: What is meant by inland topography, inland bathymetry, nearshore bathymetry, and offshore bathymetry?
As depicted in Figure 1, the intertidal zone, also known as the littoral zone, is the area exposed to the air at low tide and submerged at high tide; this zone is bounded by the Mean High Water (MHW) and Mean Lower Low Water (MLLW) boundaries which are used differently by coastal states to define official baseline boundaries between state-owned and privately-owned lands. A state’s exclusive economic zone (EEZ) extends seaward to a distance of no more than 200 nautical miles out from its coastal baseline.
The Interagency Working Group on Ocean and Coastal Mapping (IWG-OCM) represents the bathymetric mapping community that maps bathymetric surfaces to include offshore and nearshore areas, the intertidal zone, beaches, and submerged objects that pose a threat to marine navigation. The U.S. Geological Survey (USGS) 3D Mapping Program (3DEP) represents the topographic mapping community that maps the tops of structures/vegetation and the bare earth terrain to include the beach and intertidal zone. Thus both mapping communities share interest in mapping the intertidal zone and beach areas shown. USGS, USACE and FEMA, are interested in mapping inland bathymetry (rivers and lakes).

Figure 1. Examples of bare-earth inland topography, inland bathymetry, nearshore bathymetry and offshore bathymetry
Inland Topography
In Figure 1, “Inland topography” does not end at the top of the beach slope but typically includes the beach area, sometimes as far out as the MLLW line, if tidal conditions permit, to map all land areas that are not submerged.
Inland topography refers to data collected on land, and may include the land surface, features and objects on land such as building structures and vegetation, as well as bare earth topography under vegetation.
Inland Bathymetry
Inland bathymetry refers to data collected on the bottoms of lakes, reservoirs, and rivers and may include submerged features such as structures, objects, or vegetation.
Nearshore Bathymetry
The nearshore includes coastal waters seaward from the MLLW line well beyond the surf zone and includes the area influenced by coastal currents; but there is no clear boundary between nearshore and offshore. For the purpose of this questionnaire, nearshore bathymetry will pertain to coastal areas to a depth of 10 meters (20 meters in the Florida Keys where waters are exceptionally clear) that could be mapped with topobathymetric lidar systems when waters are relatively clear, but which would be mapped with multibeam sonar where waters are not clear enough for topobathymetric lidar.
Offshore Bathymetry
For the purpose of this questionnaire, offshore bathymetry will pertain to areas between 10 and 60 meters deep where waters are clear for mapping with airborne lidar bathymetry (ALB), or multibeam sonar in waters deeper than 60 meters or in shallower waters when water columns are too murky or turbid for ALB.
FAQ #5: What topographic/bathymetric features can be mapped in 3D?
Various features can be mapped in 3D. Several factors will influence the ultimate method used to collect topographic/bathymetric features. These factors include the desired spatial and temporal resolution, and environmental conditions in addition to a few others. Descriptions of the various topographic/bathymetric features along with some example uses for these features are:
Bare earth ground: This refers to the topographic surface of the terrain, free from vegetation, buildings and other man-made structures.
Tops of buildings, structures, objects: This refers to the tops of manmade features, the first surface seen when mapped from an aerial sensor flying above and looking downward.
Tops of vegetation: This refers to tree canopies and tops of other vegetation, typically mapped from an aerial sensor flying above and looking downward.
Tops of submerged structures, objects: This refers to the tops of submerged features or objects, normally pertaining to features that could represent a hazard to marine navigation.
Tops of submerged vegetation: This refers to the tops of submerged vegetation, typically mapped to determine the location, height and/or classification of such vegetation.
Subcanopy of vegetation/understory: This refers to vegetation that is below the top tree canopy.
River/lake bottom: This refers to rocky, sandy or muddy bottom of a river or lake, excluding submerged aquatic vegetation.
Nearshore elevation (<10 m deep): This refers to the rocky, sandy or muddy bottom of the nearshore bathymetric surface, including coral reefs but excluding submerged aquatic vegetation, out to a depth of 10 meters.
Ocean/sea bottom (>10 m deep): This refers to the rocky, sandy or muddy bottom of the offshore bathymetric surface, including coral reefs but excluding submerged aquatic vegetation, at depths in excess of 10 meters.
Other: This refers to any other feature or surface to be mapped, not clearly included in the other categories listed.
FAQ #6: How do I enter unique geographic area requirements for the 3D Nation Requirements and Benefits Study that are not covered by standard pick lists in the questionnaire?
Email your shapefile, KML, or geodatabase to [email protected]. Please use a unique filename that includes your Mission Critical Activity and organization, or abbreviations thereof. The projection and datum (.prj file) information must also be included.
For information about how to create a shapefile or KML file without having GIS software on your computer, go to: https://cms.geoplatform.gov/elevation/3DEP/AOIGenerationDirections.
FAQ #7: What is Total Horizontal Uncertainty (THU) at the 95% confidence level, and how does it correlate with topographic data Quality Levels?
Whereas the Total Propagated Uncertainty (TPU) is the result of uncertainty propagation in 3D when all contributing measurement uncertainties, both random and systematic, have been included, Total Horizontal Uncertainty (THU) is the horizontal component of the TPU. The International Hydrographic Organization (IHO), American Society for Photogrammetry and Remote Sensing (ASPRS), and the Federal Geographic Data Committee (FGDC) all specify that uncertainties be expressed at the 95% confidence level, meaning there is a 95% probability that horizontal (radial) errors are ≤ the stated value. THU at the 95% confidence level = 1.7308 x RMSEr, where RMSEr = the square root of [RMSEx2 + RMSEy2]. ASPRS also uses the term “Horizontal Accuracy Class” to specify how accurate geospatial data should be in terms of RMSEx and RMSEy, depicted as RMSExy.
Table 2 correlates topographic data Quality Levels with Aggregate Nominal Pulse Density (ANPD), RMSEx, RMSEy, RMSEr, RMSEz and THU. QL0 through QL3 generally pertain to standard aerial lidar or photogrammetry, QL4 pertains to higher altitude photogrammetry, and QL5 pertains specifically to high altitude aerial IfSAR. Horizontal accuracy from photogrammetry is derived from the Aerial Triangulation solution, and horizontal accuracy from lidar and IfSAR is a function of positional error derived from the GPS or Global Navigation Satellite System (GNSS), attitude (angular orientation) error as derived from the Inertial Navigation System (INS), and the flying altitude of the sensor.
Table 2. Horizontal and vertical accuracies achievable for standard aerial topographic data Quality Levels
Topographic Data Quality Level |
RMSEz |
Aggregate Nominal Pulse Density (ANPD) |
ASPRS Horizontal Accuracy Class = RMSExy |
RMSEr |
Total Horizontal Uncertainty (THU) at 95% confidence level |
QL0 UAV * |
≤5 cm |
≥20 pts/m2 |
24.5 cm |
34.7 cm |
≤30 cm (~1 ft.) |
QL0 HD |
≤5 cm |
≥20 pts/m2 |
24.5 cm |
34.7 cm |
≤60 cm (~2 ft.) |
QL0 |
≤5 cm |
≥8 pts/m2 |
24.5 cm |
34.7 cm |
≤60 cm (~2 ft.) |
QL1 HD |
≤10 cm |
≥20 pts/m2 |
32.7 cm |
46.2 cm |
≤80 cm |
QL1 |
≤10 cm |
≥8 pts/m2 |
32.7 cm |
46.2 cm |
≤80 cm |
QL2 ** |
≤10 cm |
≥2 pts m2 |
40.9 cm |
57.8 cm |
≤1 m |
QL3 |
≤20 cm |
≥1 pt m2 |
81.7 cm |
1.16 m |
≤2 m |
QL4 |
≤50 cm |
≥0.04 pts/m2 |
2.0 m |
2.9 m |
≤5 m |
QL5 IfSAR |
≤100 cm |
≥0.04 pts/m2 |
5.7 m |
8.1 m |
≤14.0 m |
* Whereas QL0 UAV is not currently a standard topographic data Quality Level, it is included here only to show that a smaller THU for small areas or roads could be achieved by flying at a much lower altitude with an Unmanned Aerial Vehicle (UAV) or with a Mobile Mapping System (MMS) on the ground.
** QL2 is the current minimum standard for nationwide topographic lidar, recognizing that legacy QL3 topographic lidar datasets remain
FAQ #8: What is Total Vertical Uncertainty (TVU) at the 95% confidence level, and how does it correlate with topographic data Quality Levels?
Total Vertical Uncertainty (TVU) is the vertical component of the TPU. The IHO, ASPRS, and FGDC all specify that vertical uncertainties be expressed at the 95% confidence level, meaning there is a 95% probability that vertical (elevation) errors are ≤ the stated value. TVU at the 95% confidence level = 1.9600 x RMSEz. ASPRS also uses the term “Vertical Accuracy Class” to specify how accurate geospatial data should be in terms of RMSEz, and (although discouraged) some users still think of vertical accuracy in terms of “equivalent contour accuracy” which is generally accepted to be 3 x RMSEz.
Table 3, below, translates the latest ASPRS standard in terms of the topographic data Quality Levels used for this study.
Table 3. Vertical Accuracy Classes relative to standard topographic data Quality Levels
Topographic Data Quality Level |
RMSEz |
Aggregate Nominal Pulse Density (ANPD) |
Vertical Accuracy Class = RMSEz |
Total Vertical Uncertainty (TVU) at 95% confidence level |
Equivalent Contour Accuracy |
QL0 HD |
≤5 cm |
≥20 pts/m2 |
5 cm |
9.8 cm |
15 cm, ~6 inch |
QL0 |
≤5 cm |
≥8 pts/m2 |
5 cm |
9.8 cm |
15 cm, ~6 inch |
QL1 HD |
≤10 cm |
≥20 pts/m2 |
10 cm |
19.6 cm |
30 cm, ~1 foot |
QL1 |
≤10 cm |
≥8 pts/m2 |
10 cm |
19.6 cm |
30 cm, ~1 foot |
QL2 |
≤10 cm |
≥2 pts m2 |
10 cm |
19.6 cm |
30 cm, ~1 foot |
QL3 |
≤20 cm |
≥1 pt m2 |
20 cm |
39.2 cm |
60 cm, ~2 foot |
QL4 |
≤50 cm |
≥0.04 pts/m2 |
50 cm |
98.0 cm |
150 cm, ~5 foot |
QL5 IfSAR |
≤100 cm |
≥0.04 pts/m2 |
1 meter |
1.96 meters |
300 cm, ~10 foot |
FAQ #9: What is the significance of MLLW, MHW and MHHW?
Some organizations choose to pay extra for tide-coordinated elevation data acquisition, for example, by specifying that topographic data be acquired with water levels at or below Mean Lower Low Water (MLLW) to expose more land that is not submerged, and/or by specifying that topobathymetric data be acquired with water levels at or above Mean High Water (MHW) or Mean Higher High Water (MHHW) to map more water depths that are submerged. This combination enables the tidelands to be mapped both ways, making it easier to seamlessly merge topographic and bathymetric data across the tidelands by establishing seamlines where the two datasets agree on common elevations after NOAA’s Vertical Datum Transformation Tool (VDatum) is used to transform bathymetric data from a tidal datum to NAVD88.
Figure 2 shows why MHHW, MHW, and MLLW are especially relevant to coastal states. The boundary line between privately owned and state-owned lands is based on these boundary lines and differs between states. Mean Lower Low Water (MLLW) defines the chart datum, which is the level of water from which charted depths displayed on a nautical chart are measured.
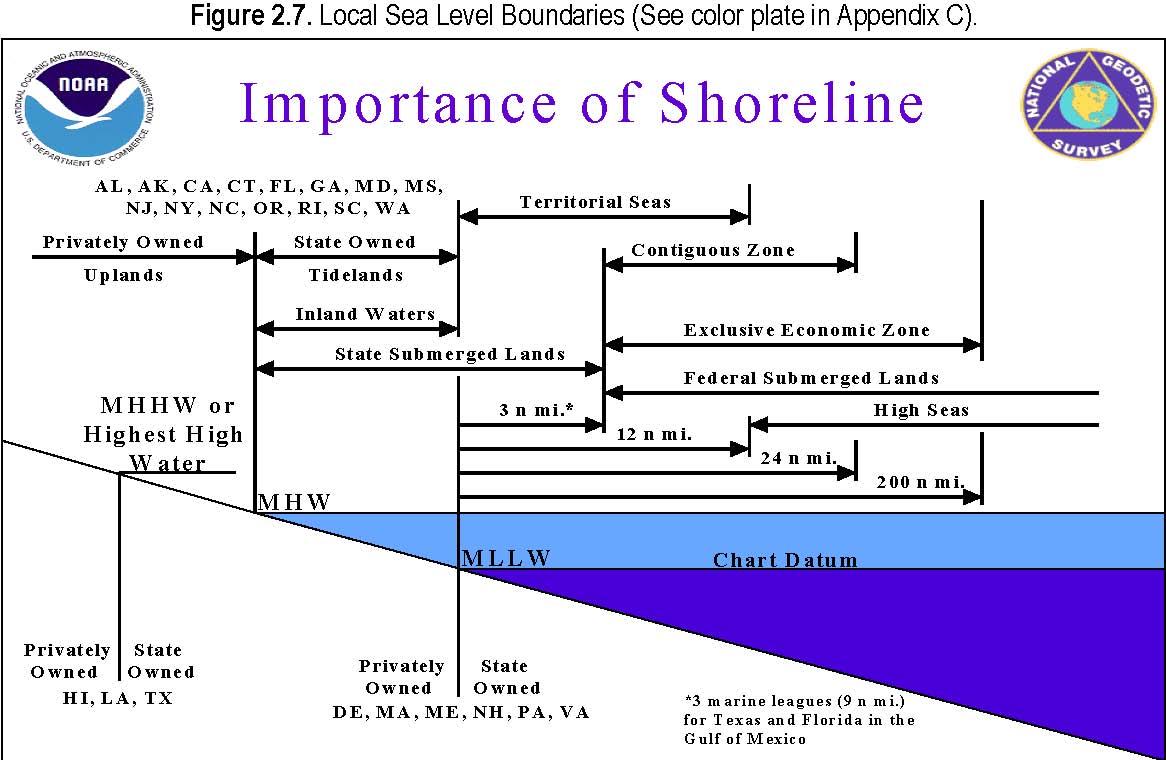
Figure 2. In a number of states, MHW defines the official shoreline that separates privately owned uplands from state-owned tidelands, inland waters and state submerged lands. In other states, MLLW or MHHW defines the official shoreline. The MLLW not only establishes the chart datum for U.S. waters, but MLLW establishes territorial seas and distances to the beginning of the Exclusive Economic Zone and Federal Submerged Lands, for example.
Mean Higher High Water (MHHW): MHHW is defined as the arithmetic mean of the higher high water heights of the tide observed over a specific 19-year Metonic cycle denoted as the National Tidal Datum Epoch (NTDE). Only the higher high water of each pair of high waters of a tidal day is included in the mean.
Mean High Water (MHW): MHW is defined as the arithmetic mean of the high water heights observed over a specific 19-year Metonic cycle.
Mean Sea Level (MSL): MSL is defined as the arithmetic mean of hourly heights observed over a specific 19-year Metonic cycle.
Mean Low Water (MLW): MLW is defined as the arithmetic mean of the low water heights observed over a specific 19-year Metonic cycle.
Mean Lower Low Water (MLLW): MLLW is defined as the arithmetic mean of the lower low water heights of the tide observed over a specific 19-year Metonic cycle. Only the lower low water of each pair of low waters of a tidal day is included in the mean.
FAQ #10: What are cross-sections and transects and how do they differ?
Figure 3. Cross-section surveyed across a stream. |
Cross-sections are spot elevations surveyed across stream channels for riverine flood studies to determine the shapes and slopes of stream banks and the underwater topography. For such flood studies, cross-sections are typically surveyed immediately downstream from bridges and at selected intervals between bridges for hydraulic modeling of rivers and streams. See Figure 3. |
|
Figure 4. Transect surveyed across beach, dune and inland |
Transects are spot elevations surveyed perpendicular to
shorelines to determine the shapes and slopes of beaches and sand
dunes for wave run-up models and similar applications. For coastal
flood studies, transects are surveyed at selected locations along
lengthy shorelines for hydraulic modeling of coastal wave action.
See Figures 4 and 5. Figure 5. Transect survey points with 3D coordinates |
|
|
Single beam echo sounders (SBES), also known as vertical beam sonar, produce a line of elevation points, directly below the vessel’s track, on the floor of a bathymetric surface, as shown in Figure 6. This is similar to cross sections and transects surveyed on land.
With a single line of elevation points, the SBES differs from the multibeam echo sounder (MBES) which produces a wide swath of elevation points on the bathymetric surface, similar to a swath of aerial lidar.
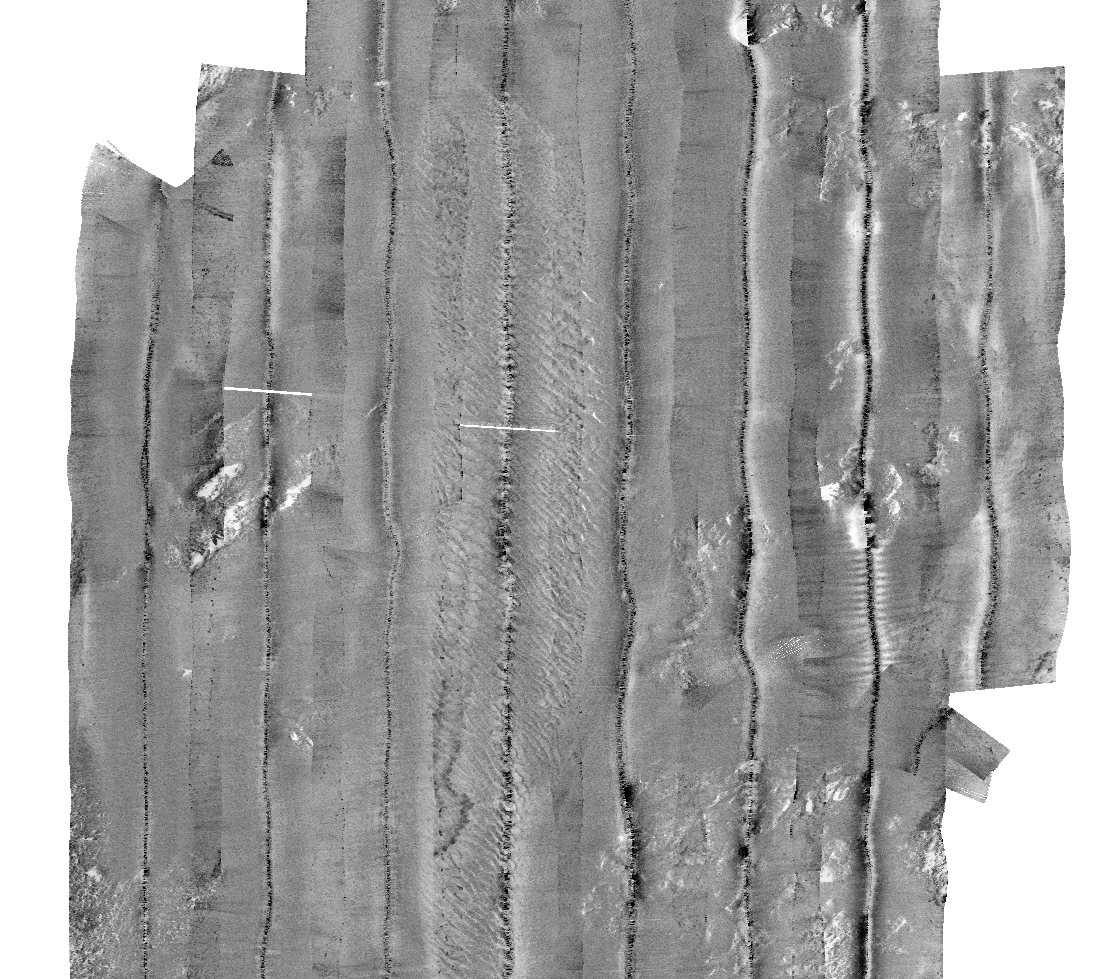
MBES can also produce transect data when acquisition is based on a set line spacing rather than a goal of complete coverage. This is often utilized in areas of flat or static sea floors. Figure 7 shows a project where complete coverage and set line spacing was used in different areas. Often times, MBES or SBES and a sidescan sonar can be run concurrently. When the extents of a sidescan sonar exceed the outer reaches of the MBES, it creates a similar result to set line spacing, as seen in Figure 8. |
|
Figure 6. Track of a single beam echo sounder (vertical beam sonar)
Figure 7. Set line spacing performed on multibeam sonar alongside areas of complete coverages.
Figure 8. Sidescan sonar swath exceeding multibeam swath. If coverage is designed so that only sidescan data will overlap, it will create set line spacing for multibeam data. |
||
FAQ #11: How are topographic data produced and how are their Quality Levels (QLs) defined?
Topographic Technologies
For topographic mapping, traditional photogrammetry uses stereo imagery from two different perspectives to map topographic surfaces, and IfSAR uses radar to map topographic surfaces through clouds; but both technologies are best for mapping top reflective surfaces rather than the bare-earth terrain beneath a forest canopy. Airborne lidar is best for mapping the bare-earth terrain beneath trees. All lidars use laser pulses to measure the distance to an object by determining the time of flight for an emitted laser beam. A scanning mechanism (such as an oscillating mirror) is typically employed to steer a series of laser pulses (typically over 100 KHz) over a wide area from an airborne platform. All airborne lidar systems use enabling technologies such as Global Positioning System (GPS) and Inertial Measurement Unit (IMU) to determine the location and orientation of the remote sensor located on the airborne platform.
Topographic lidar systems typically use a near infrared laser pulse to measure topography of the land surface, features and objects on land such as building structures and vegetation, as well as bare earth topography under vegetation (Figure 9).
|
|
Figure 9. Topographic lidar, with near infrared laser, maps ground topographic features, vegetation and manmade features; unreliable for water surface and below |
|
Topographic Lidar Advantages
Topographic lidar routinely penetrates foliage where photogrammetry, which relies on aerial photography, cannot see the ground in stereo to map the bare-earth ground beneath. Lidar uses up to 500,000 laser pulses per second to map 3-D coordinates from first, last, and intermediate returns from each laser pulse. The first return can be used to map the top reflective surface (DSM). Intermediate returns provide additional information about vegetation. The last return is used to map the bare-earth terrain (DTM); however, because last returns include elevations on rooftops and vegetation too dense to be penetrated, lidar last returns still require automated filtering and some manual filtering of lidar “point clouds” to produce the bare-earth surface. Figure 10 shows how it takes only a single lidar pulse to penetrate vegetation. Figures 11 and 12 show how lidar penetrates dense vegetation that normally could not be mapped by other technologies such as photogrammetric stereo compilation. |
|
|
|
|
|
|
|
|
Topographic Lidar Limitations
The major limitation of topographic lidar is that it cannot penetrate to the bare earth if the vegetation is too dense that pulses of laser light cannot penetrate through gaps in the canopy to reach the ground. As a rule of thumb, on a bright sunny day, if sunlight is “seen” on the ground, then it is possible to map that ground with lidar. Sometimes, increasing the point density can improve the probability of the laser pulse to find a gap in the canopy to reflect off the ground. As a result, a QL1 lidar dataset may produce a better ground model than a QL2 lidar dataset, due to the increased point density, and the new high density (HD) Quality Levels were specifically designed for mapping through dense vegetation
A second limitation of topographic lidar is that there are sometimes void areas in urban canyons and areas with tall buildings that block non-vertical lidar pulses from reaching the ground. These void areas are immediately adjacent to tall buildings. This problem is minimized by flying higher with higher point density and/or by flying east-west flight lines in addition to north-south flight lines, for example.
Topographic Data Quality Levels
The USGS 3DEP is the elevation layer of The National Map, comprised of new 3DEP-quality data and integrating the data holdings of the National Elevation Dataset (NED), which has been retired. The 3DEP is currently acquiring QL5 IFSAR of Alaska and QL2 or better topographic lidar for the remaining 49 states and U.S. territories based on the USGS Base Lidar Specification V1.2 with major density and accuracy parameters as shown in Table 2. (Note that QL0 HD and QL1 HD are new and were added to specifically accommodate very high density datasets from Geiger-mode and single photon lidar.) The goal of the 3DEP is to acquire QL2 or better elevation data nationwide, updated on an 8-year cycle, with cost sharing between numerous partners.
The 3D Nation is a concept for acquiring consistent and seamless high-accuracy, high-resolution elevation data from the tops of the mountains to the depths of the seas, primarily through a combination of topographic data (from the 3DEP specifications in Table 4), as well as bathymetric data produced to topobathymetric lidar specifications explained in FAQ #23 and sonar specifications explained in FAQ #30.
Table 4. Topographic Data Density and Absolute Vertical Accuracy
Quality Level (QL) |
Aggregate Nominal Pulse Spacing (ANPS) |
Aggregate Nominal Pulse Density (ANPD) |
RMSEz (non-vegetated) |
TVU at 95% confidence level |
VVA at 95th percentile |
Equivalent Contour Accuracy |
QL0 HD |
≤0.22 m |
≥20 points/m2 |
≤5 cm |
≤9.8 cm |
≤14.7 cm |
~ 6 inch |
QL0 |
≤0.35 m |
≥8 points/m2 |
≤5 cm |
≤9.8 cm |
≤14.7 cm |
~ 6 inch |
QL1 HD |
≤0.22 m |
≥20 points/m2 |
≤10 cm |
≤19.6 cm |
≤29.4 cm |
~ 1 foot |
QL1 |
≤0.35 m |
≥8 points/m2 |
≤10 cm |
≤19.6 cm |
≤29.4 cm |
~ 1 foot |
QL2 |
≤0.71 m |
≥2 points/m2 |
≤10 cm |
≤19.6 cm |
≤29.4 cm |
~ 1 foot |
QL5* |
≤5 m |
≥0.04 points/m2 |
≤100 cm |
≤196 cm |
≤294 cm |
~10 feet |
*Only applicable for IfSAR in Alaska
For the purpose of this questionnaire, Non-vegetated Vertical Accuracy (NVA) at the 95% confidence level is the same as Total Vertical Uncertainty (TVU) at the 95% confidence level. Vegetated Vertical Accuracy (VVA) at the 95th percentile is evaluated separately.
The following definitions are relevant to the terminology used in Table 4.
Root Mean Square Error (RMSE) — The square root of the average of the set of squared differences between dataset coordinate values and coordinate values from an independent source of higher accuracy for identical points. The RMSE is used to estimate the absolute accuracy of both horizontal and vertical coordinates when standard or accepted values are known, as with GPS-surveyed check points of higher accuracy than the data being tested. In the United States, the independent source of higher accuracy is expected to be at least three times more accurate than the dataset being tested.
RMSEz — The vertical RMSE (RMSEz) is calculated as the square root of (Zn –Z’n)2/N, where:
Zn is the set of N z-values (elevations) being evaluated, normally interpolated (for TINs and DEMs) from dataset elevations of points surrounding the x/y coordinates of checkpoints
Z’n is the corresponding set of checkpoint elevations for the points being evaluated
N is the number of checkpoints
n is the identification number of each of the checkpoints from 1 through N.
Equivalent Contour Accuracy — The equivalent contour accuracy is 3 times the RMSEz. For example, RMSEz of 10 cm is equivalent to 30 cm contours, and RMSEz of 0.333’ (4”) is equivalent to 1 foot contours.
Non-Vegetated Vertical Accuracy (NVA) — The value by which vertical accuracy of topographic data (e.g., lidar, IfSAR) in non-vegetated areas can be equitably assessed and compared among datasets when applying the ASPRS Positional Accuracy Standard for Digital Geospatial Data. The NVA is determined with well-distributed checkpoints located in both open terrain (bare soil, rock, sand and short grass) and urban terrain (concrete and asphalt surfaces). The NVA is determined by multiplying RMSEz x 1.9600.
Vegetated Vertical Accuracy (VVA) — The value by which vertical accuracy of topographic data (e.g., lidar, IfSAR) in all vegetated areas can be equitably assessed and compared among datasets when applying the ASPRS Positional Accuracy Standards for Digital Geospatial Data. The VVA is determined with well-distributed checkpoints located in all vegetated land cover categories combined, including tall weeds and crops, scrub forests, and fully forested areas, as well as other localized vegetation categories such as mangrove or sawgrass (unless specifically identified as Low Confidence Areas, defined below). The VVA is determined by using the 95th percentile (rather than using an RMSEz multiplier) because errors in vegetation do not necessarily follow a normal error distribution.
Nominal Pulse Spacing (NPS) — A common measure of the density of a point-based elevation dataset (e.g., lidar, IfSAR, sonar), it is the typical or average lateral distance between points in a dataset, most often expressed in meters. NPS refers to the average point spacing of a dataset typically acquired in a zig-zag pattern with variable point spacing along-track and cross-track. NPS is an estimate and not an exact calculation.
Aggregate Nominal Pulse Spacing (ANPS) — A variant of nominal pulse spacing (NPS) that expresses the typical or average lateral distance between pulses in a dataset resulting from multiple passes of the sensor, or a single pass of a platform with multiple sensors, over the same target area.
Nominal Pulse Density (NPD) — A common measure of the density of a single pass (single swath) of a point-based elevation dataset (e.g., lidar, IfSAR, sonar), expressed as points per square meter (PPSM), normally used when the Nominal Pulse Spacing (NPS) is less than one meter. PPSM = 1/NPS2.
Aggregate Nominal Pulse Density (ANPD) — A variant of nominal pulse density (NPD) that expresses the total expected or actual density of pulses occurring in a specified unit area resulting from multiple passes of the sensor, or a single pass of a platform with multiple sensors, over the same target area.
With only 10% sidelap between adjacent flight lines, the left side of Figure 13 shows that the majority of the area is mapped with a single swath -- relevant to the terms NPS and NPD. With 50% sidelap, the right side of Figure 13 shows that the majority of the area is mapped with two swaths -- relevant to the terms ANPS and ANPD, increasing the probability of penetrating dense vegetation by having two different look angles. A sidelap of 50% doubles the ANPD compared with single swaths with 10% side lap. |
Figure 13. Comparison between 10% and 50% side lap between overlapping LiDAR swaths; 50% side lap typically doubles the aggregate nominal point density |
How to determine NPS or DEM post spacing requirements.
The determination of the minimal acceptable point density, DEM post spacing and/or NPS needed to satisfy Business Uses is central to the purpose of this questionnaire. Respondents should not specify requirements that are “nice to have” but focus instead on minimal acceptable requirements for satisfaction of their Business Uses. Several considerations are suggested below, but ultimately this must be the decision of elevation data users that best understand their technical requirements.
Five questions should be considered:
What level of detail do you need to see from the elevation data?
What are your needs for feature extraction?
What do you need to measure?
How dense is the vegetation you need to penetrate?
What are your needs for breaklines?
Consideration #1 (What you need to see). For some Business Uses, users need to be able to see certain terrain features to be analyzed, to include overhead power lines. It is easier to see the visual effects of resolution than the visual effects of elevation accuracy. If you can see what you need from existing elevation data, the status quo may be acceptable unless the data are obsolete.
Consideration #2 (Features you need to extract). A high resolution DEM is often required if the elevation data are to be used for automated or semi-automated feature extraction, as shown in Figures 14 and 15.
Figure 14. Even with sub-meter NPS, building footprint edges are pixilated. Straight edges are difficult to define when they are irregular and pixilated. |
Figure 15. High resolution elevation data are required when they are to be used for semi-automated feature extraction. Many misclassifications result from low resolution elevation data. |
Consideration #3 (What you need to measure). Your DEM user application has everything to do with required point density. Table 5, below, shows examples where measurements are made for landslides, morphology, building classification, fire loads, tree species, forest metrics, vegetation classification, and measurement of the DTM in the forest floor. Other applications might include assessment of forest health.
Consideration #4 (Density of vegetation to be penetrated). In some cases, the raw point density per square meter or the NPS is much more important than the DEM post spacing, especially in areas of dense vegetation. Figures 11 and 12 above show an example of lidar data in Florida where the points were collected with an average density of 4 points/m2 in dense tropical vegetation. In the Florida Statewide LiDAR Assessment (2017), stakeholders concluded that the state standard should be QL1 with 8 points per square meter, specifically because of dense vegetation in major areas of that state. Similarly, in the Pacific Northwest (Oregon), users deal with tall, dense forests where they needed QL1 lidar with 8 points/m2 for forestry and geology applications.
Table 5 addresses both considerations #3 and #4.
Table 51. Watershed Sciences, Inc.’s recommended resolution for demanding forestry applications in the Pacific Northwest. Most other applications are satisfied by lower-resolution elevation datasets. Similar issues may occur in swamps and other areas of dense vegetation defined as “low confidence areas.”
Discipline |
Application |
Recommended Density, pulses per m2 and (NPS) |
|
Low |
High |
||
Geology |
Landslides |
4 (0.50 m) |
4 (0.50 m) |
Morphology |
5 (0.45 m) |
8 (0.35 m) |
|
Urban Planning |
Building Classification |
4 (0.50 m) |
8 (0.35 m) |
Fire Modeling |
Fire Loads |
4 (0.50 m) |
8 (0.35 m) |
Mapping Burns |
4 (0.50 m) |
6 (0.41 m) |
|
Forestry with Pacific Northwest-specific Applications |
Tree Species Identification |
4 (0.50 m) |
6 (0.41 m) |
Forest Measurement and Monitoring |
4 (0.50 m) |
4 (0.50 m) |
|
Tree Height Measurements |
4 (0.50 m) |
6 (0.41 m) |
|
Vegetation Characterization |
4 (0.50 m) |
8 (0.35 m) |
|
DTM Accuracy under Canopy Cover |
4 (0.50 m) |
6 (0.41 m) |
|
It is well known that the NPS must be denser than the DEM post spacing. This Oregon study1 shows that it is not just the raw lidar points that must be denser than the DEM, but the percent of the raw lidar points that penetrate the vegetation to the ground. There is no substitute for prior experience in comparable vegetation to determine what percent of the lidar points are expected to penetrate to the ground so that the NPS requirements can be adjusted accordingly – prior to data acquisition.
Consideration #5 (Breakline needs). Breaklines are linear features that describe a change in the smoothness or continuity of a surface. The two most common forms of breaklines are soft breaklines and hard breaklines. (1) A soft breakline ensures that known elevations (z-values) along a linear feature are maintained (e.g., elevations along a pipeline, road centerline or drainage ditch), and ensures that linear features and polygon edges are maintained in a TIN surface model, by enforcing the breaklines as TIN edges. They are generally synonymous with 3-D breaklines because they are depicted with series of x/y/z coordinates. (2) A hard breakline defines interruptions in surface smoothness, e.g., to define streams, shorelines, dams, ridges, building footprints, and other locations with abrupt surface changes. Although some hard breaklines are 3-D breaklines, they are often depicted as 2-D breaklines because features such as shorelines and building footprints are normally depicted with series of x/y coordinates only, often digitized from digital orthophotos that include no elevation data.
Breaklines may be especially relevant in flatter coastal areas to define subtle breaks in topography that could potentially affect direction of surface water flow. Most organizations establish their own requirements for breaklines.
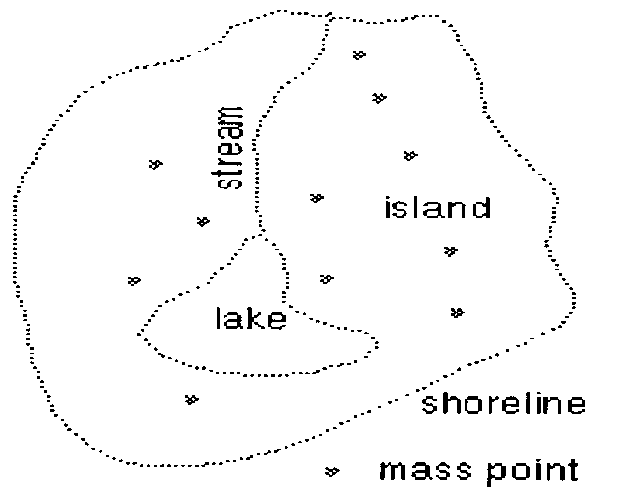
Figure 16 shows typical lidar mass points with NPS of approximately 1 meter. For most automated processes, these elevation points adequately model the terrain. Figure 17 shows breaklines produced from these mass points for which fewer model key points were retained after manual compilation of the breaklines shown. It is true that contour lines produced from the model key points and breaklines will be more aesthetically pleasing, but this rarely helps automated processes. A decision must be made if the “Chevy version” at Figure 16 is acceptable, or if the “Cadillac version” at Figure 17 warrants the higher costs and time delays. This is an example where higher point density (achieved with relatively minor cost increases) can reduce or eliminate the need for many expensive breaklines.
Figure 16. Mass points with nominal pulse spacing (NPS) of approximately 1 meter |
Figure 17. Thinned model key points and breaklines for swales, borrow pits with water, and road features |
FAQ #12: How frequently do elevation data need to be updated?
If you think that topographic surfaces do not change with time, these examples may demonstrate otherwise.
Factors that Affect Hydraulic Analyses by FEMA. In assessing flood data update needs, FEMA requires an assessment of factors that affect hydraulic analyses (e.g., new bridges or culverts, new flood control structures, changes in stream morphology, coastal erosion) and factors that affect still water and wave height analyses for coastal flooding sources. Changes in stream morphology can be critical. Any significant change in the stream channel or floodplain geometry, particularly regarding the placement of fill, can affect the 1-percent-annual-chance floodplain and the associated regulatory floodway. Another consideration is any change in the stream location, either through natural processes (e.g., stream migration, erosion, or deposition) or through manmade changes (e.g., channelization, stream widening, stream straightening, or dredging). Additionally, any significant change in the vegetation or structural encroachments in the floodplain may affect a stream’s hydraulic characteristics.
Analysis of Sea Level Change. Nearly every coastal State has requirements to predict the future impacts of sea level change, and credible predictions require accurate and current elevation data updated frequently. There is currently no “rule of thumb” to indicate the frequency of topographic/bathymetric data updates.
Management of Forests. Lidar is used to map the changing heights of trees in America’s forests. How frequently do foresters need to monitor changing forest metrics? For those who use lidar data to monitor forest health, how frequently do they need the data to be updated in order to periodically monitoring the changing health of American forests? We hope this question can be answered as part of this questionnaire process. The ability to cut cross-sections through point cloud data is vital for many assessments of changes in forest metrics.
Vegetation Encroachment. The North American Electric Reliability Corporation (NERC) has identified lidar as the best way to monitor the encroachment of vegetation on power lines, a major cause for widespread power outages.
Figure
18. Fifty years of
subsidence (over 20 feet) in California's San Joaquin Valley. Image
courtesy of National Geodetic Survey (NGS).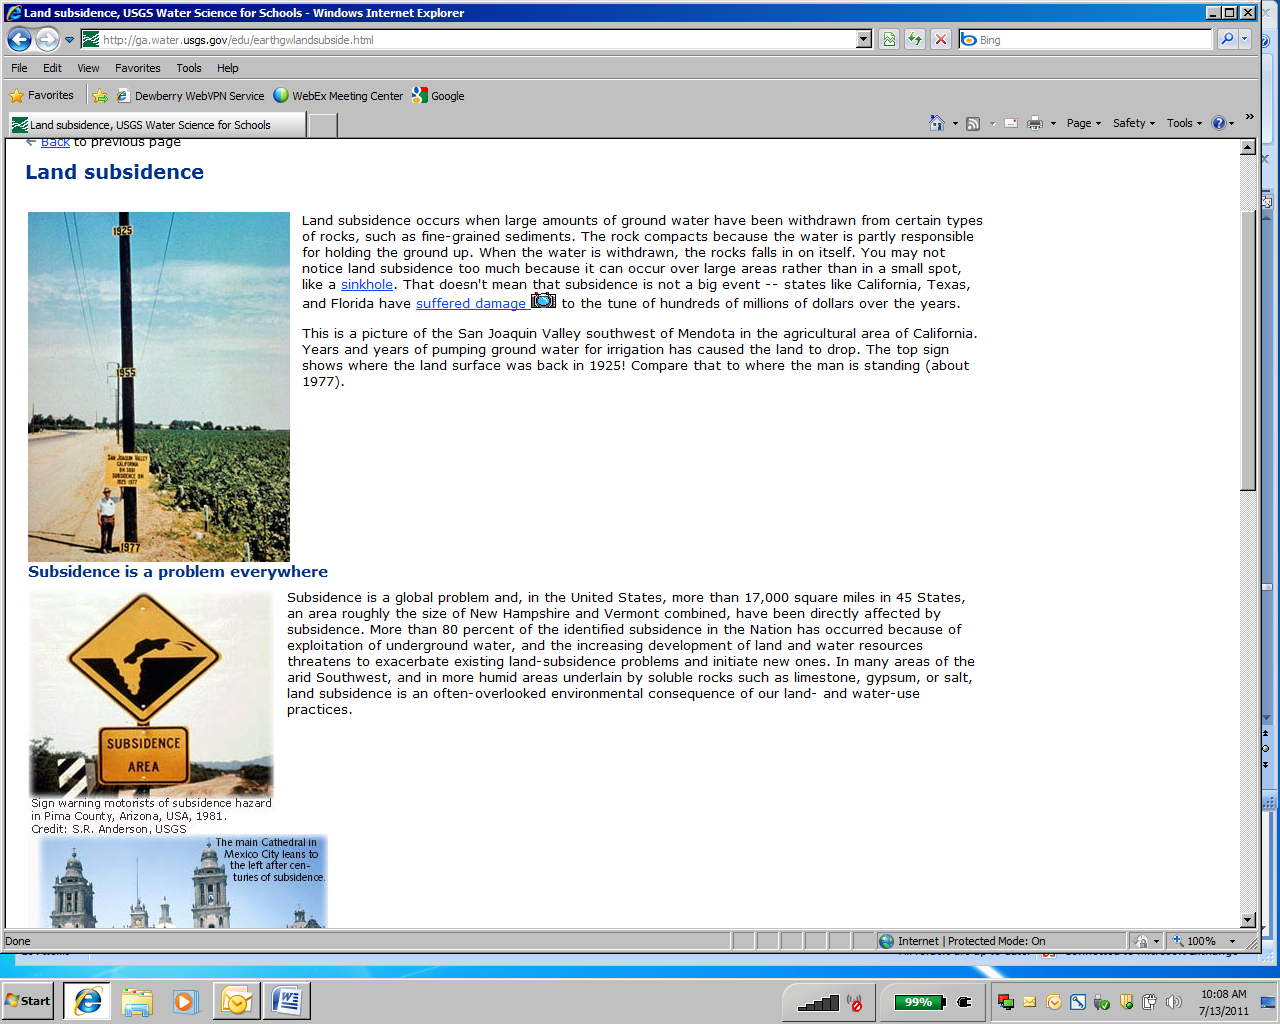
Subsidence has the following effects:
Changes in elevation and gradient of stream channels, drains, and other water transporting facilities
Damage to civil engineering structures – weirs, storm drains, sanitary sewers, roads, railroads, canals, levees, and bridges
Structural damage to private and public buildings
Failure of well casings from forces generated by compaction of fine-grained materials in aquifer systems
In some coastal areas, subsidence has resulted in tidal encroachment onto lowlands
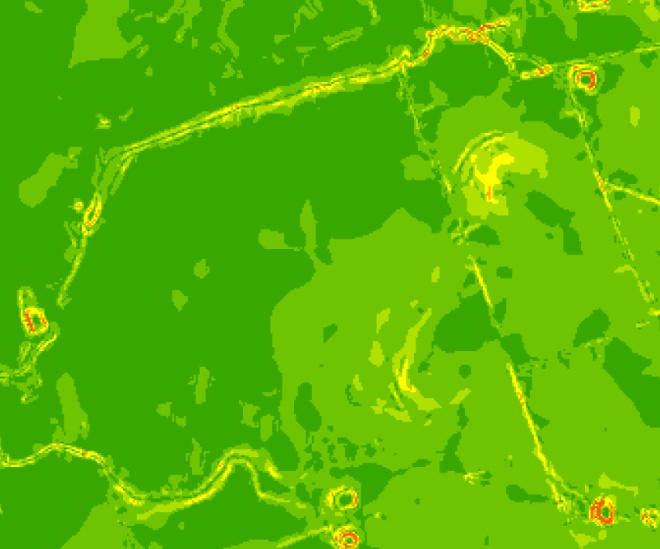
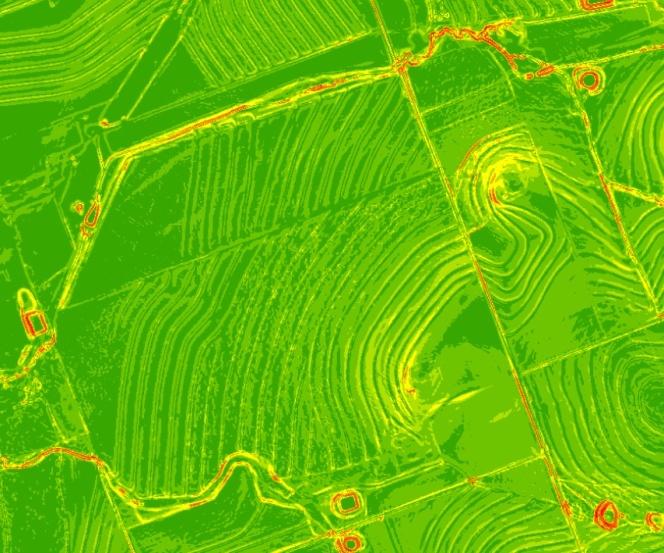
Agricultural Practices. In order to participate in USDA farm programs, Federal law requires that all persons that produce agriculture commodities must protect their highly erodible cropland from excessive erosion. In addition, anyone participating in USDA farm programs must certify that they have not produced crops on converted wetlands and did not convert a wetland. NRCS currently has numerous incentive programs (e.g., Stewardship Incentive Program (SIP), Emergency Watershed Protection (EWP) Program, Wildlife Habitat Incentives Program (WHIP), Cooperative Conservation Partnership Initiative (CCPI), Conservation Stewardship Program (CSP), Conservation Reserve Program (CRP) and Conservation Technical Assistance (CTA) Program), several of which encourage farmers to terrace their lands so as to retain water in the soil, rather than allow run-off of farm chemicals that pollute our streams. Lidar offers the perfect remote sensing tool for broad-scale analyses of slopes and slope changes, as well as changes to wetlands, rangelands and habitat. Figures 19 through 22 demonstrate how lidar data, and slope derivatives, could be periodically compared to monitor changes in slopes and to evaluate successes or failures of such incentive programs. This example does not explain how often periodic updates are required, but it does demonstrate the need and benefit of periodic data updates.
Figure 19. DEM hillshade prior to farm terracing |
Figure 20. DEM slope gradient prior to farm terracing |
Figure 21. DEM hillshade after farm terracing |
Figure 22. DEM slope gradient after farm terracing |
NRCS personnel cannot personally visit every farm to validate which actions qualify for incentive programs, but periodic updates allow for rapid assessments/comparisons of broad areas.
Other Topographic Change Assessments. Many other applications for digital elevation data require temporal change assessments of the changing topography, including: building/structure change analysis, changes to carbon stock estimates, changes to coastlines, debris flow monitoring, earthquake deformation metrics, changes to fire modeling and assessment, geologic/geophysical/seismic change analyses, geomorphic process monitoring, glacier change monitoring, habitat change assessment, landscape change analysis, landslide analysis, shoreline change monitoring, surface mining metrics, volcano metrics, urban modeling/change analysis, and wetland change analysis.
None of these are known to have established requirements for the frequency with which elevation datasets need to be updated, but these examples should help questionnaire respondents to understand that top reflective surfaces in Digital Surface Models (DSMs) and bare-earth Digital Terrain Models (DTMs) change regularly by natural or manmade activities. As with digital orthophotos, elevation datasets also need to be periodically updated so that 3D surface analyses can be accurate and up-to-date for diverse user requirements.
Sedimentation. Areas with active sediment deposition or removal, such as rivers and deltas, will create inaccuracies with previous bathymetry or coastal elevation data. These areas will require resurvey based on a user’s accuracy and precision requirements for their bathymetric and elevation data. Every area where sediment change occurs will have a different rate of sedimentation, and can be measured and monitored to provide a user with a model for when resurvey would be necessary.
Dredging/Reclamation. Similar to natural sediment changes, any artificial changes to seafloor topography may incite a need for updated bathymetry data. Practices of dredging will remove sediment and material from a one location and deposit the material in a dumping ground. Bathymetry data in both areas will change dramatically and may require resurvey. Similar activities include beach restoration, ocean reclamation, dredging, and shoring.
Storm effects. Hurricanes and other major storms can influence seafloor topography through heavy wave and storm surge effects. Seafloor material can be relocated when a storm passes over the area, and if the change is dramatic enough it may warrant a need for remapping. Storms can also deposit objects from land underwater or relocate and disturb objects on seafloor such as boulders or shipwrecks.
Underwater construction. Operations such as laying pipeline, pier construction, or bridge and tunnel construction can change the seafloor in the area. Such construction can alter the seafloor during operations or the product itself may change the user’s desired bathymetric data. In some cases, change to the seafloor can be limited to the change cause immediately by the construction. However, some changes can alter the sedimentation processes in the area and can influence changes outside the immediate vicinity. For example, a newly installed beach pier may affect the beach erosion or deposition that occur downstream of the beach currents.
FAQ #13: What are the different forms of hydrologic processing of topographic data?
Hydrologic Processing
Although the water surface elevations (WSE) of lakes are normally flat, and the WSE of rivers are monotonic (elevations decreasing steadily downhill as waters flow downstream), with most mapping technologies, it is common for shorelines of lakes and rivers to appear to undulate up and down with irregular changes in heights along stream banks, or logs and rock along the shoreline for example. Furthermore, lidar-derived DEMs often present challenges for hydrologic modeling, as they typically include features such as road fill and railroad grade overlaying culverts, bridges, and other raised surfaces that impede the natural flow of surface water. Water is carried through these features that cannot be represented in a lidar-derived DEM. Hydrologic processing is required to create a lidar-derived hydrologic DEM that represents the actual water flow surface for any hydrologic modeling. Hydro-flattening, hydro-enforcement, and hydro-conditioning are the three most common methods used to process lidar-derived DEMs for hydrologic modeling.
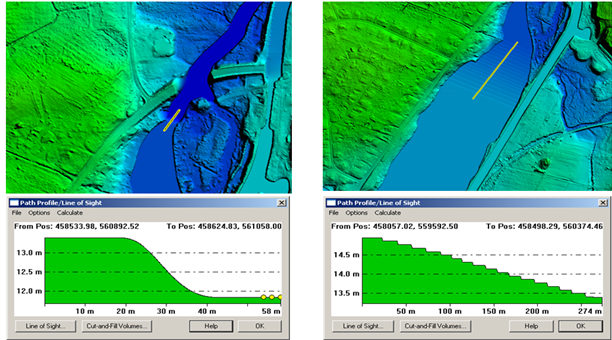
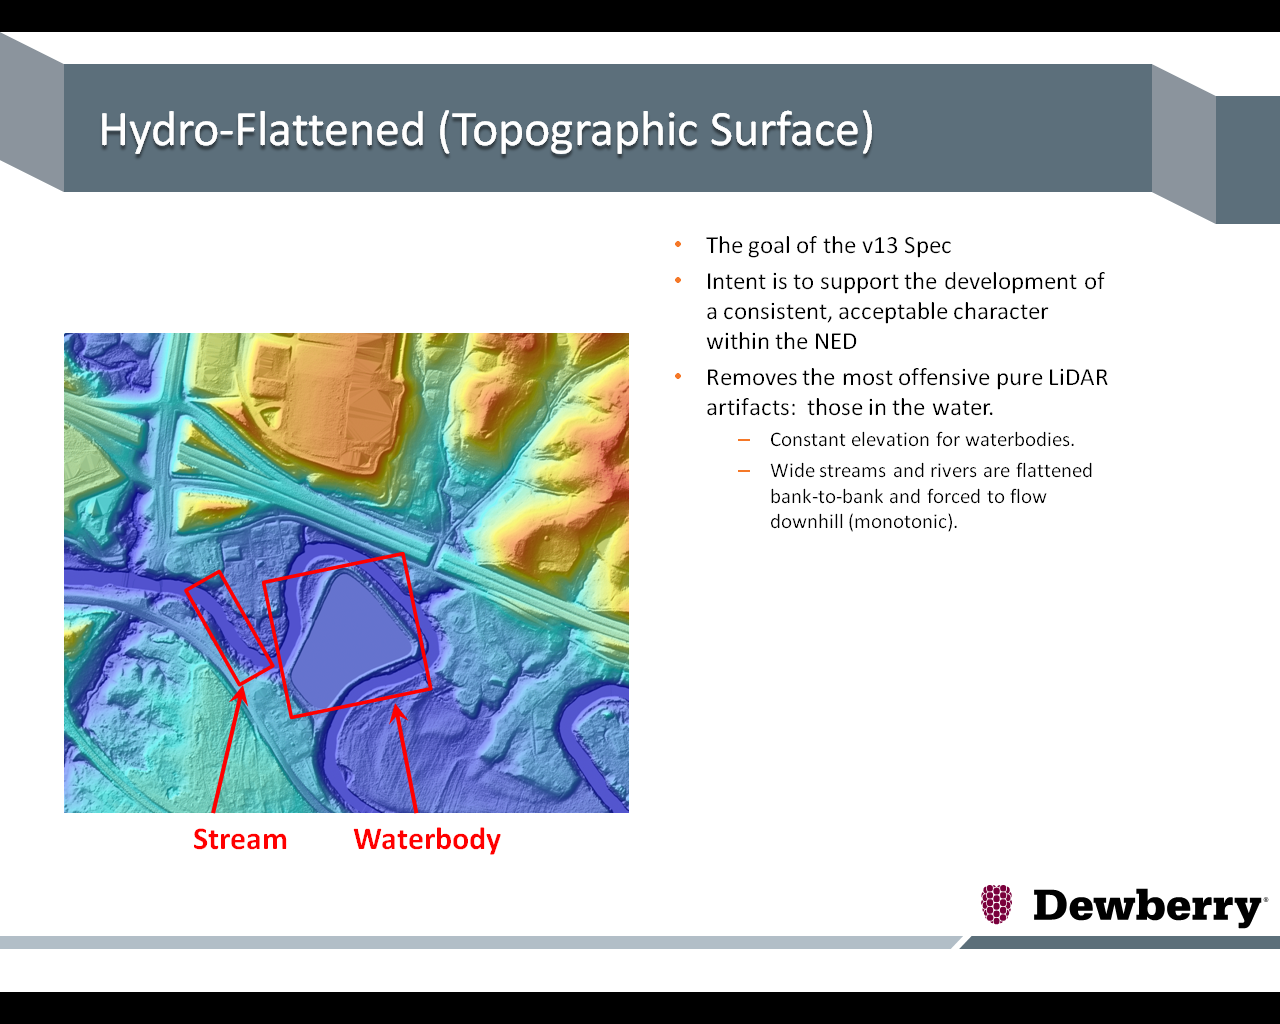
Hydro-Flattening: Hydro-flattening is a term used by USGS to explain how DEMs are processed for inclusion in the 3DEP. Hydro-flattening is performed to depict the bare-earth terrain as one could see and understand the terrain from an airplane flying overhead. Breaklines are used to force the surfaces of lakes and reservoirs to be flat, and rivers to be flat from bank to bank (perpendicular to the apparent flow centerline) while maintaining a downhill water surface gradient – either a smooth gradient as at Figure 23 or a stair-stepped gradient as at Figure 24. Additionally, man-made features such as bridges and overpasses are removed from a bare-earth DEM because they are artificially elevated above the natural terrain.
|
|
Figure 23. River hydro-flattened with a smooth gradient along the yellow profile |
Figure 24. River hydro-flattened with a stair-stepped gradient along the yellow profile (10 cm per step in this example) |
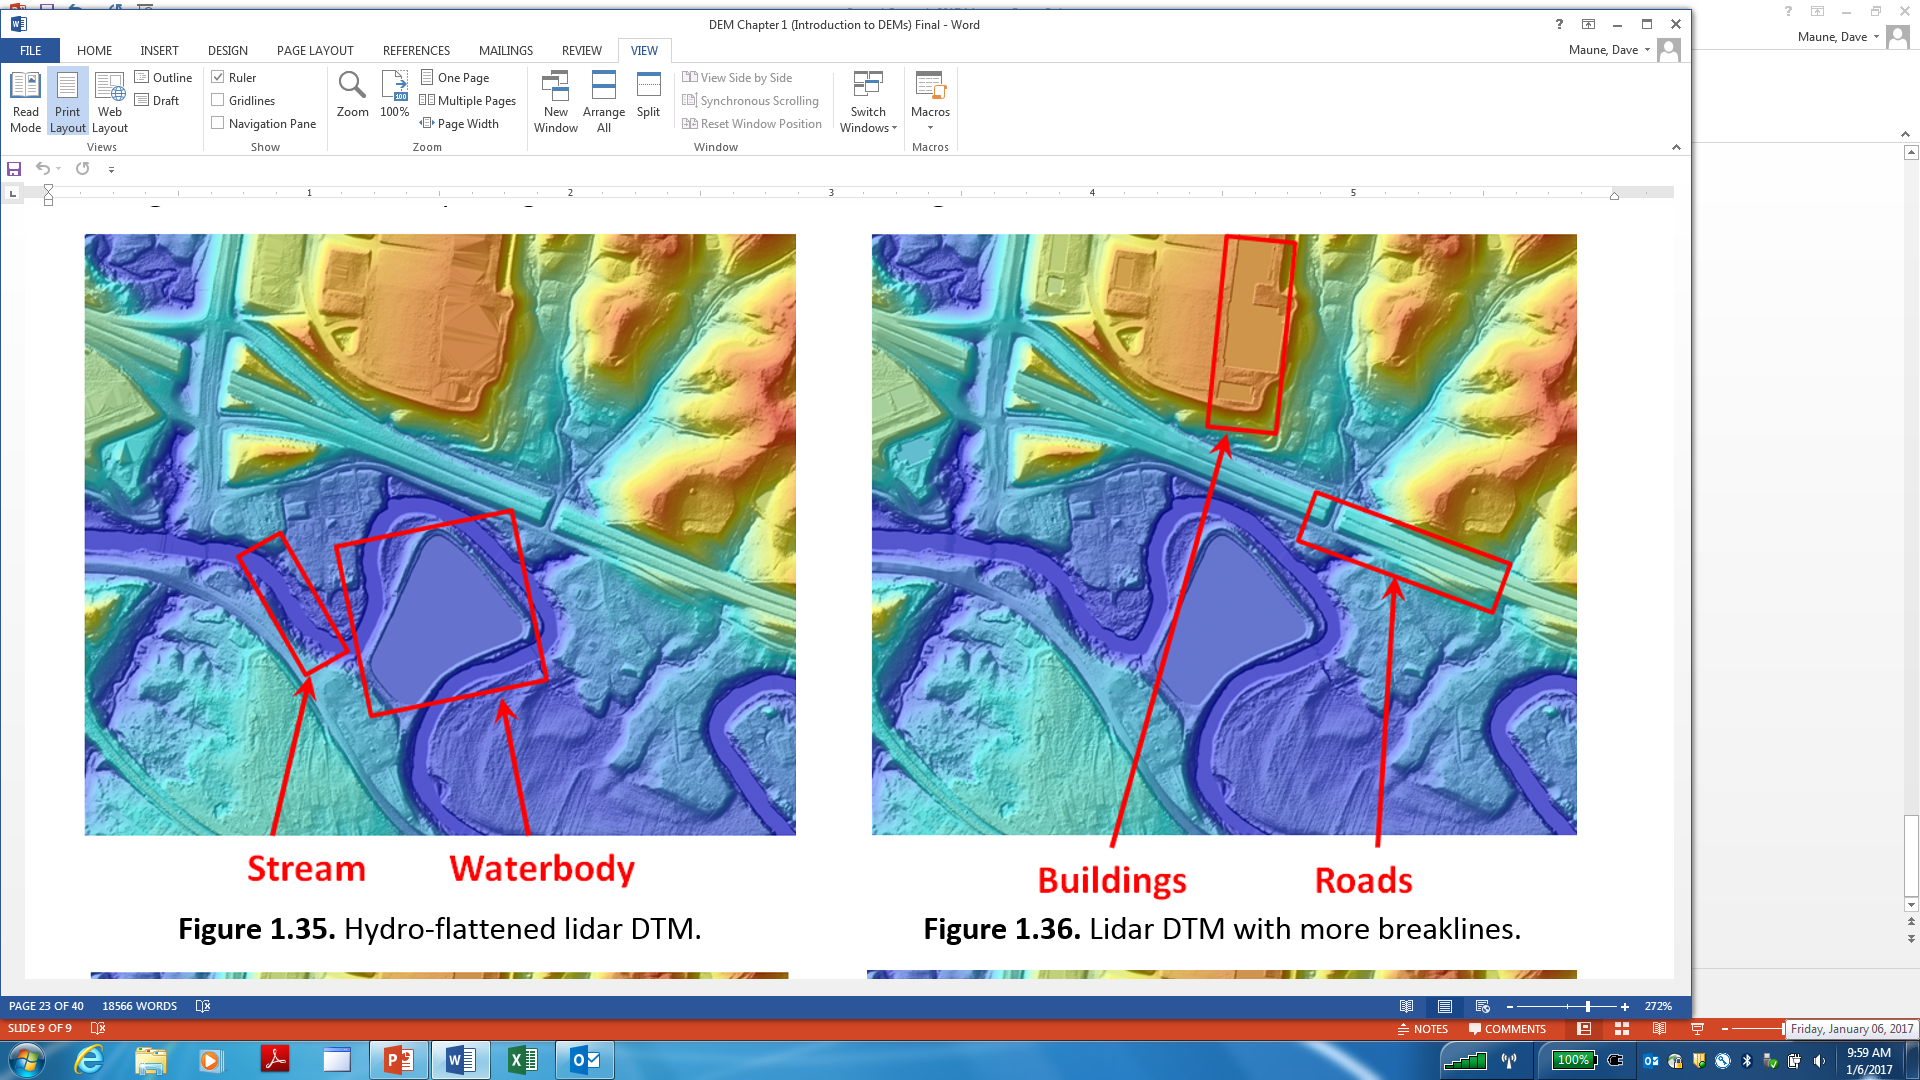
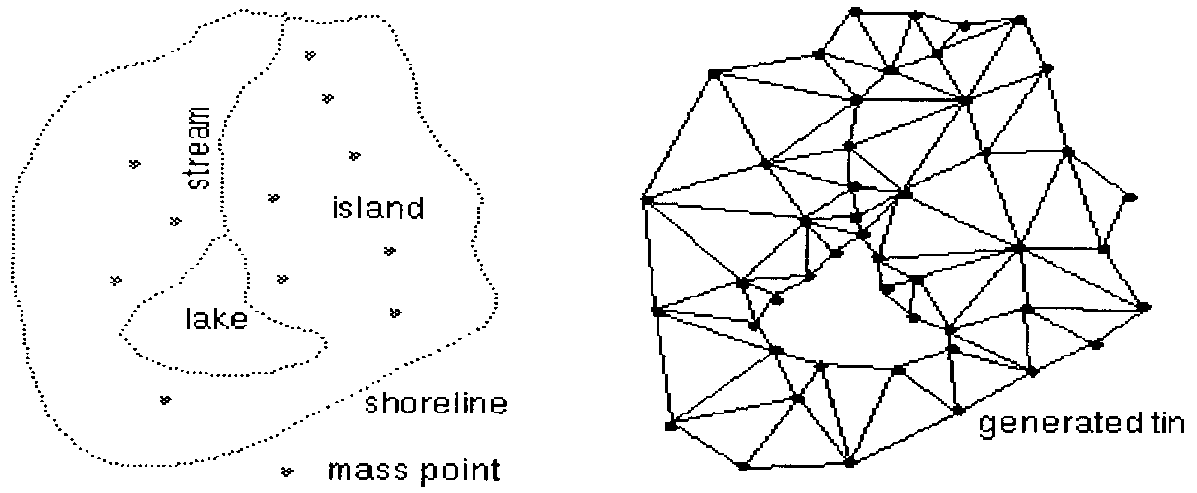
Figure 25 shows a DEM that has been hydro-flattened with breaklines to make the lake shoreline level and to flatten the stream from bank-to-bank. Note that bridges have been cut, but unseen culverts have not been cut. Compare with Figure 26 below which has been hydro-enforced.
Figure
25. Example of a lake and stream that have been hydro-flattened
with breaklines. |
Figure
26. Hydro-enforcement uncovers below-ground culverts so that water
will flow through these culverts in hydrologic and hydraulic
models. |
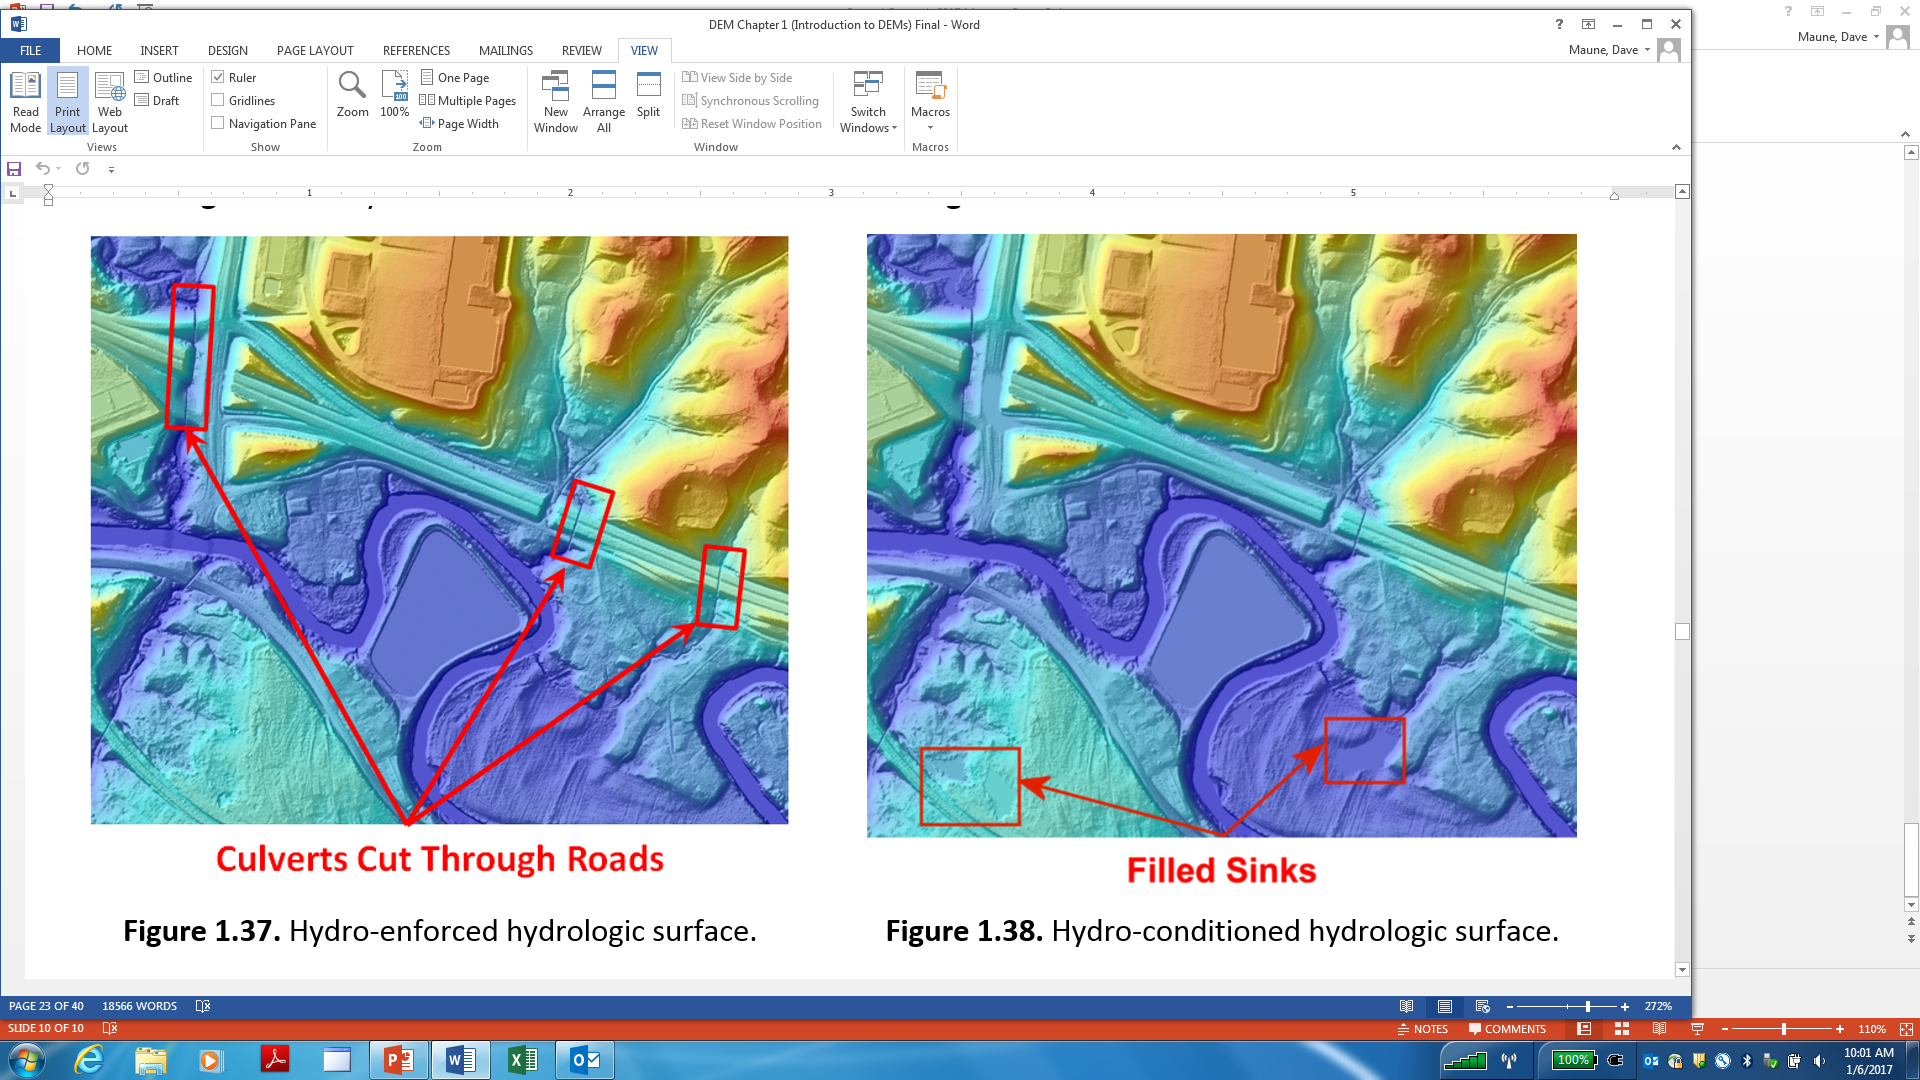
Hydro-Enforcement: Hydro-enforcement (Figure 26) includes hydro-flattening but adds steps for treatment of narrower dual- and single-line drains and culverts to enforce the downward flow of water. Hydro-enforcement is required for hydrologic modeling and management of watersheds and for hydraulic modeling of floodplains. It is also used for stormwater management. Hydro-enforcement is much more expensive than hydro-flattening because a large amount of manual processing is required.
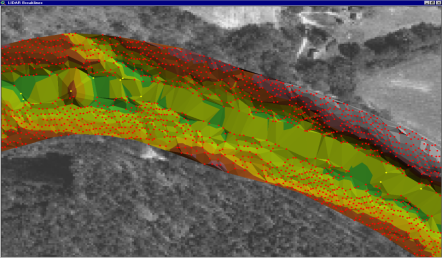
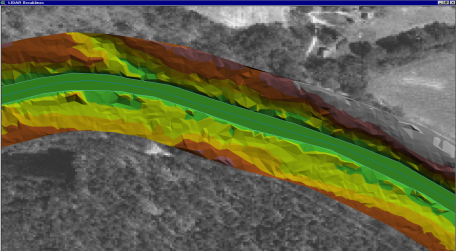
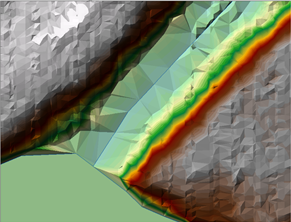
Figures 27 and 28 are commonly used as examples of how to hydro-enforce a dual-line stream that appears to block the flow of water in the TIN shown at Figure 27 but enforces the downward flow of water in the hydro-enforced TIN at Figure 28.
|
|
Figure 27. Rocks in the river, and/or natural undulating elevations along the shorelines, make the TIN appear as though water cannot pass downstream. |
Figure 28. Breaklines for the dual shorelines are cut beneath the mapped elevations in order to hydro-enforce the flow of water; but this can create other problems. |
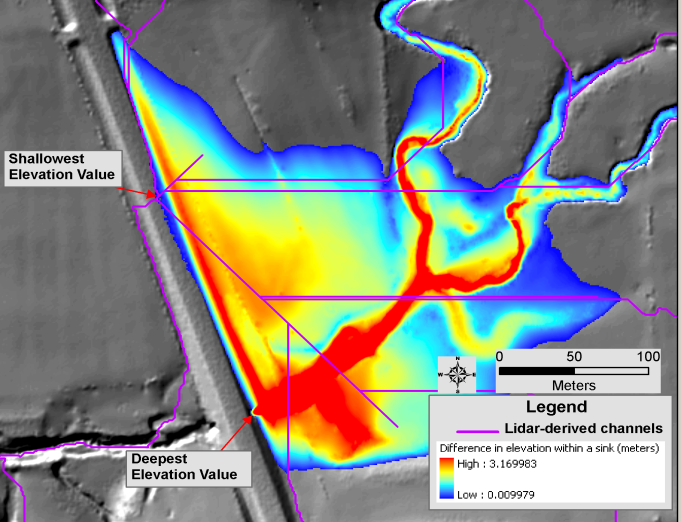
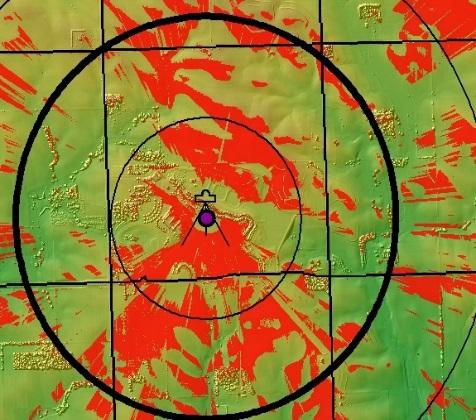
There are no uniform standards for hydro-enforcement of below-ground culverts. For the National Flood Insurance Program (NFIP), FEMA leaves it up to the hydraulic engineer to determine when, where and how to hydro-enforce streams, bridges and culverts of all sizes. Figure 29 shows what happens when a culvert is not hydro-enforced, and Figure 30 shows what happens when a culvert is hydro-enforced. Figures 29 and 30 show puddles (one or more elevation posts totally surrounded by higher elevations) with red being the deepest part of each puddle. The puddles in these examples are suitable for hydro-enforcement, i.e., being “cut” and drained by culverts that are inferred but not absolutely known; a “cut” is shown in Figure 30 with the purple connector line that crosses the road. Dry puddles should not be hydro-enforced; it is ideal when drainage features can be mapped when they are dry. Limestone sinks and dry swimming pools are types of puddles that should not be drained by hydro-enforcement or filled by hydro-conditioning.
Figure 29. This shows what happens when the culvert is not hydro-enforced. In hydro models, the water flows in the ditch beside the road until it overflows the road at its shallowest elevation (pour point) where the purple line crosses the road. |
Figure 30. This shows a culvert “cut” to hydro-enforce the flow of water through this culvert. The darkest red shows the deepest part of the “puddle” and most likely location for the culvert entrance. |
Figure
31. All sinks have been filled so there are no puddles.
FAQ #14: What is meant by seamless temporal integration and seamless spatial integration of 3D data?
Seamless temporal integration refers to the integration of multiple 3D datasets acquired at different times to reduce discontinuities between datasets acquired on different dates, and so that a user cannot see the differences. Temporal changes most commonly occur when the goal is to acquire 3D data during leaf-off conditions; early snowfall in the fall may cause data acquisition to be halted until the following spring, or leaf-on conditions in the spring may cause data acquisition to be halted until the following fall when leaf-off conditions return. Changes in water surface levels may be apparent due to the different time periods of collection. Exceptions are routinely made when data acquisition flights are interrupted by unavoidable events such as natural disasters, e.g., wildfires, hurricanes, tornadoes, earthquakes or floods that change the 3D landscape. Other exceptions are with tidal waters that continuously change coastal shorelines; the USGS Lidar Base Specification V1.2 states: “Vertical discontinuities within a water body resulting from tidal variations during the collection are considered normal and shall be retained in the final DEM.” In the case of tidal variations, the temporal integration of datasets acquired even just an hour apart may not be seamless. Other temporal variations may also be unavoidable.
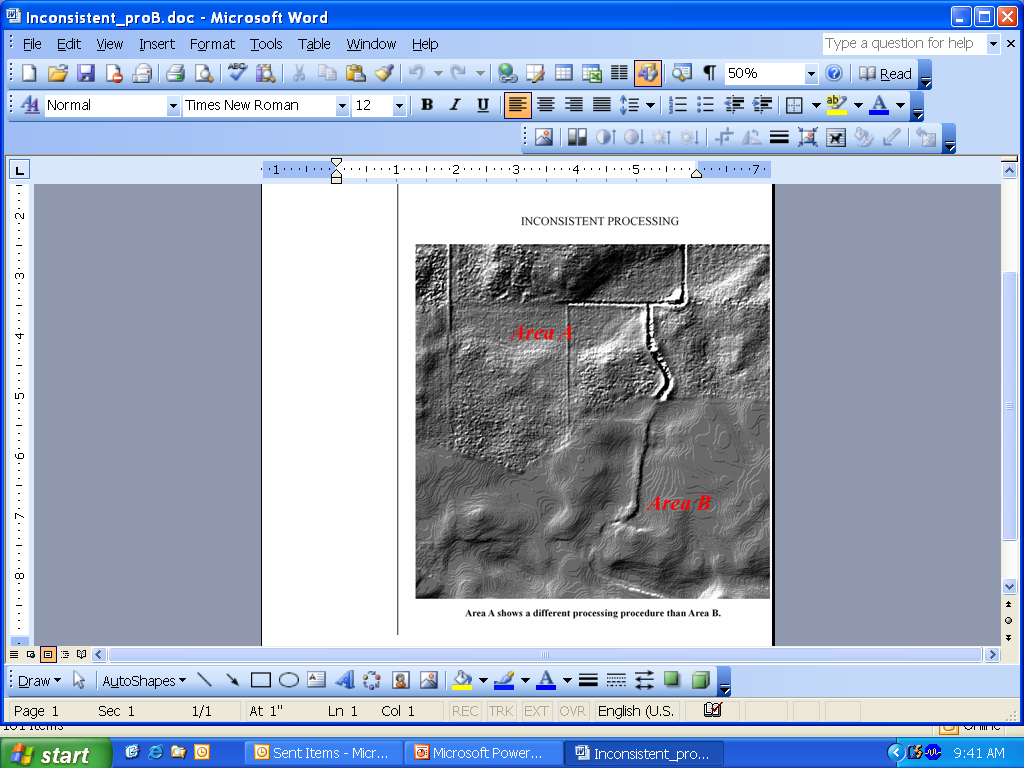
Seamless spatial integration refers to the integration of different datasets so that users cannot see seamlines between the two datasets. Figure 32 is an extreme example of poor integration of two datasets acquired on the same day with the same sensor. Areas A and B were processed differently by two different GIS analysts in the same organization, but they were trained differently or used different procedures for determining the bare-earth terrain, leaving an obvious seamline between Areas A and B. Furthermore, in Area B, the drainage ditch was erroneously modelled as a ridge. If two spatially-different datasets can result from the same source dataset in the same organization, one can imagine the spatial differences that could occur from datasets produced by different companies at two different times, or if using different sensors and different processing techniques. DEMs produced from photogrammetry, lidar and IfSAR can also have absolute and relative vertical offsets as shown in Figures 33 and 34.
|
|
Figure 32. Example of poor integration of two areas from the same 3D dataset processed differently by two analysts; the seamline is quite visible. |
|
|
|
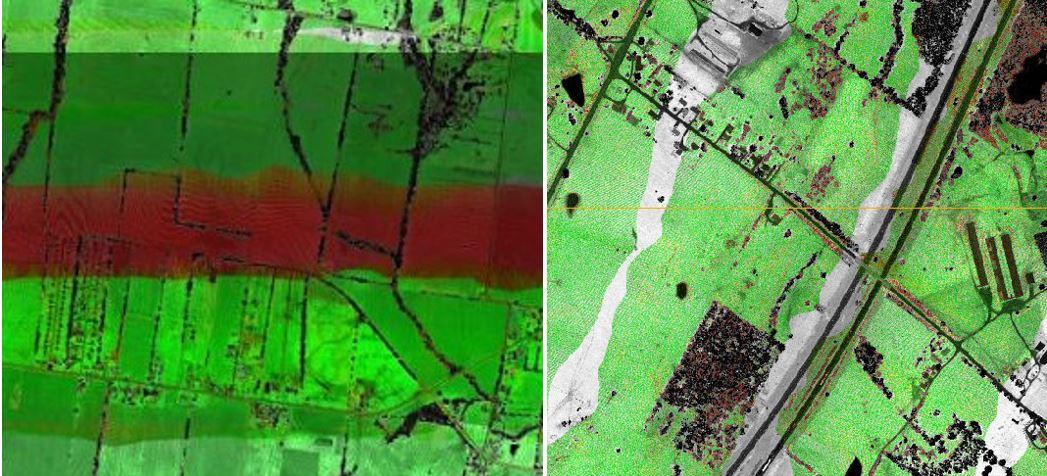
Figure 33. Absolute vertical offsets of several feet can occur if adjoining datasets do not both use accurate survey control such as Continuously Operating Reference Stations (CORS). Inaccurate local control points can cause offsets as shown when not surveyed relative to CORS. Old benchmarks are often very inaccurate relative to CORS. |
Figure 34. Relative vertical offsets of 6” or more can occur in overlapping flight lines from a poorly calibrated lidar sensor. The USGS Lidar Base Specification has rigorous criteria for smooth surface repeatability and swath overlap differences depicted in this ΔZ ortho that shows the inconsistent swath in red when >10 cm, for example. |
FAQ #15: What is meant by vertical manipulation as pertains to seamless spatial integration?
When merging or joining one elevation dataset to another, there is normally a visible seamline between disparate elevation datasets because of: (1) temporal differences, (2) sensor differences, (3) different Quality Levels and accuracy standards, or (4) differences between topographic and bathymetric surfaces along the ever-changing tidal zone, for example.
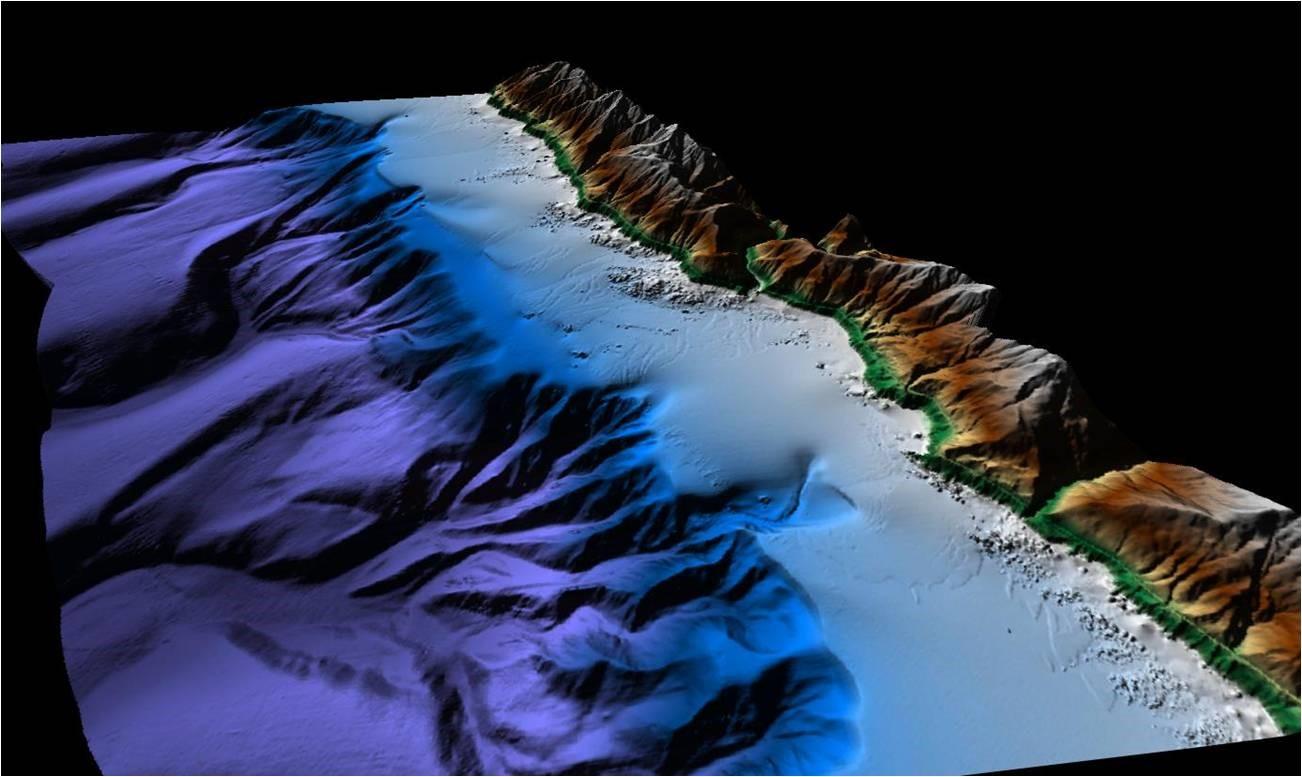
Figure 35 is an example of the merger of topographic lidar, with bathymetric lidar, with sonar for the entire California coastline, using diverse technologies and surveys over a 10+ year time period:
|
Figure 35. Coastal California data merge of sonar with topographic and bathymetric lidar |
To integrate disparate elevation datasets so they appear to be seamless, data producers normally don't have hard and fast thresholds (vertical differences) that can't be exceeded for merging; they use the "best available" data and then merge and smooth seamline areas to minimize discontinuities, after first adjusting for any vertical datum differences between the overlapping datasets (which is especially important for topo-bathy merging).
There are many questions to be answered prior to determining whether or not it is actually desirable to manipulate elevation datasets either horizontally or vertically to make them seamless:
Are point clouds to be merged, or just the resultant DEMs?
Which dataset do you hold as control? Presumably, the older dataset would be held fixed if it had previously been accepted and placed in the public domain. The issue here is that the previously accepted data is not the most current and is often less accurate than the newer dataset, so the newer, superior dataset might be degraded to “fit” the older, poorer dataset.
What about new projects that intersect with two or more older, adjacent datasets? The adjustment parameters for each edge would need to be different to make the data seamless.
How far into the dataset do you make the vertical adjustment? Is it just along the edge in which case the edge would no longer follow the same error distribution as the rest of the project; or does one try to adjust the entire project to match a certain edge?
What if the vertical manipulation (adjustment) causes the newly collected data to have a reduced accuracy? If the RMSEz is 3 or 4 cm worse, is that acceptable, or is it preferred to maintain the highest accuracy possible when tested against QA/QC checkpoints?
Should the new contractor place control points within the overlap area with old dataset to test the accuracy of the older dataset prior to determining whether or not the old and new datasets should be merged seamlessly?
Figure 36 is an example of an elevation “difference raster”
for the overlap area between an old and new lidar dataset. DEM
difference rasters are created by subtracting the elevations of the
older dataset from the elevations of the newer dataset. Units are in
feet. Differences in light pink are over 1’, differences in
dark pink are over 3’, and differences in orange are over 5’.
The long linear light pink feature spanning the right half of the
image may look like a road but it is actually a canal where
differences are expected because of changing water levels. Most
changes in pink and orange were determined to be temporal changes and
not spatial changes. Areas in green are unchanged and fit nicely.
Figure 36. This is an elevation difference raster created by subtracting the elevations of an old dataset from a new dataset. What appears to be spatial differences are actually temporal differences.
When making seamless integration at national scale and global scale, there are two primary references, too lengthy and complex to explain here, but URLs are provided:
Integrating Disparate Lidar Datasets from a Regional Storm Tide Inundation Analysis of Hurricane Katrina, by Jason Stoker et al. URL: https://pubs.er.usgs.gov/publication/70035535
Global Multi-resolution Terrain Elevation Data 2010 (GMTED2010), DOI Open File Report 2011-1073, by Jeffrey J. Danielson and Dean B. Gesch. URL: https://lta.cr.usgs.gov/GMTED2010
When making seamless topo-bathy elevation models, there are also several references, too lengthy and complex to explain here, but URLs are provided:
Development of a Seamless Multisource Topographic/Bathymetric Elevation Model of Tampa Bay, by Dean Gesch and Robert Wilson: URL: https://pdfs.semanticscholar.org/c7f9/76474827d7913fffb6da59090e40757bf58c.pdf
Topobathymetric Elevation Model Development using a New Methodology: Coastal National Elevation Database, by Jeffrey J. Danielson et al. URL: https://pubs.er.usgs.gov/publication/70179489
FAQ #16: What are the 3D elevation data products referred to in the questionnaire?
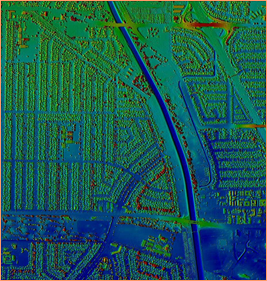
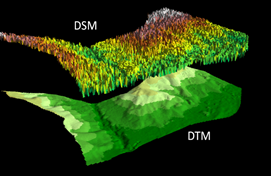
Digital Surface Model (DSM): A DSM is a “top of canopy” or “top reflective surface” elevation model, including the bare earth in open terrain areas where there are no elevated features. A DSM includes the tops of buildings, trees, towers, and other features elevated above the bare earth. See Figure 37. DSMs are produced from photogrammetry, lidar, IfSAR or sonar. DSMs are typically gridded, as are DEMs, for more efficient file storage. A top reflective surface DSM is currently a 3DEP “buy-up” option [1] [2] which is relatively inexpensive because DSMs are easily produced from lidar “first returns” from the raw point cloud, and then gridded into a raster DSM. |
Figure 37. A DSM maps treetops and rooftops
|
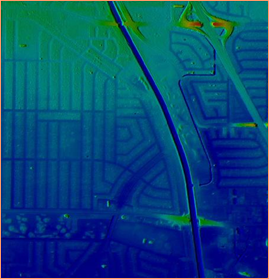
Digital Terrain Model (DTM): As shown by Figures 38 and 39, a DTM incorporates the elevation of significant topographic features on the land and irregularly-spaced mass points and breaklines to better characterize the true shape of the bare-earth terrain, free of vegetation and man-made structures. The net result of DTMs is that distinctive terrain features are more clearly defined and precisely located than a gridded DEM, and contours generated from DTMs more closely approximate the real shape of the terrain. Such DTMs are normally more expensive and time consuming to produce than uniformly spaced DEMs because breaklines are ill- suited for automated collection. |
Figure 38. A DSM maps the top surface and a DTM maps the bare-earth terrain beneath
Figure 39. A DTM maps the bare-earth terrain beneath trees with irregularly-spaced mass points and breaklines
|
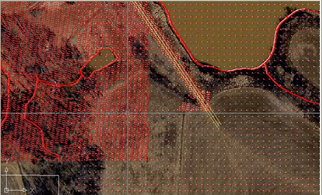
Digital Elevation Model (DEM): DEMs and DTMs are often confused because they both model the bare-earth terrain, free of trees, buildings, towers, bridges and other visible man-made features. Whereas a DTM consists of irregularly-spaced mass points and breaklines, a DEM is a raster (gridded) surface with a uniform cell size. Figure 40 shows the difference between irregularly-spaced mass points on the left, and uniformly-spaced DEM points on the right; it also shows breaklines for single-line drains and the shore of a pond. |
Figure 40. Higher density, irregularly-spaced lidar mass points (left side of image) are used to interpolate the lower-density regularly-spaced DEM elevation posts on the right. Several hydro breaklines are also shown in this image.
|
The DTM/DEM differences are compared in Figures 41 through 44 where DTMs are on the left and DEMs are on the right.
|
|
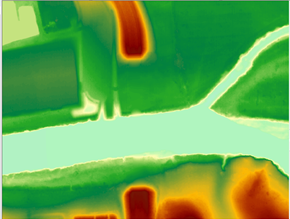
Figure 41. A DTM with irregularly-spaced mass points and breaklines for (1) center of the narrow stream and (2) for both shorelines of the wider stream. |
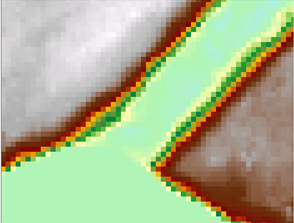
Figure 42. A DEM of the same area with regularly-spaced grid cells and no breaklines. The differences will be more apparent with the zoomed-in views below. |
|
|
Figure 43. The same DTM -- zoomed in -- shows irregularly-spaced mass points and breaklines for streams. Although more precise, DTMs are inefficient to store and use. |
Figure 44. The same DEM -- zoomed in -- shows square, regularly-spaced grid cells that are much more efficient to store and use |
For 3DEP, the DEM cell size is no greater than 2.5 feet and no less than the design Aggregate Nominal Pulse Spacing (ANPS). The 3DEP’s DEM surface is hydro-flattened but not hydro-enforced (see below).
Raw point cloud data: A point cloud is a set of 3D data points in some coordinate system defined by X, Y, and Z coordinates, often intended to represent the external surface of an object. Point clouds may be created by 3D scanners such as lidar or by photogrammetric means. A point cloud is “raw” when the data points have not yet been classified to explain the type of feature being mapped (e.g., land, water, trees, bridges).
Figure
45. Examples of lidar point clouds on trees. Note the color
differences for 1st, 2nd, 3rd, and 4th returns from each lidar
pulse.
Figure
25. Examples of lidar point clouds on trees. Note the
color-differences for 1st,
2nd,
3rd
and 4th
returns from each lidar pulse.
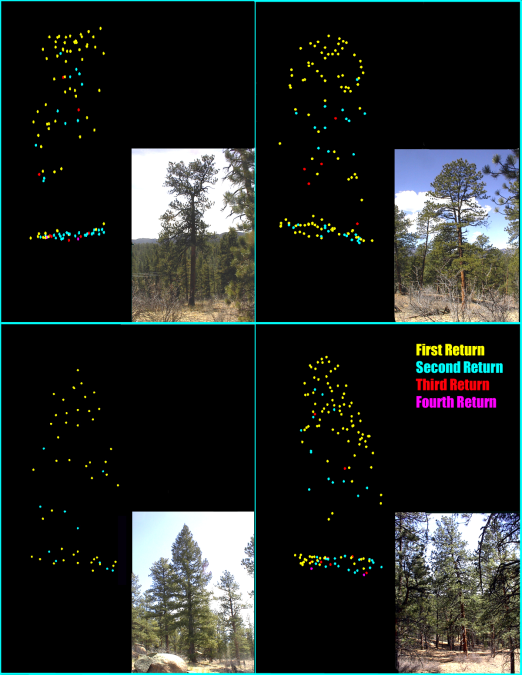
A photogrammetric point cloud can be produced using Semi-Global Matching (SGM) or Structure from Motion (SfM) technologies, developed to further enhance the advantages of a new generation of digital camera systems such as large digital frame cameras and push-broom scanners. Utilizing aerial triangulation with digital frame imagery, a high density digital surface model (DSM) is generated for use in orthophoto and map production. Capturing imagery and surface models during the same flight with the same sensor ensures that image features and image geometry perfectly match the DSM. The resulting pixel level correlation generated point cloud is photogrammetrically accurate to the same level as the mapping. The point density achieved (300 points/m2 at a 5cm GSD) is far greater than traditional linear-mode lidar (2-8 points/m2).
Classified point cloud data: Lidar point cloud data are subsequently processed to ASPRS LAS (laser file format) classes that distinguish between points on the ground, water, or elevated features such as buildings, trees, towers, bridges, etc. No points are discarded but may be classified as noise, or unclassified. All topographic lidar elevations in water are unreliable because sometimes the laser pulses are absorbed by the water, reflected from the water with differing intensities, or provide elevations on or below the level of the water surface.
Most topographic lidar datasets are flown with the laser scanning in a zig-zag pattern where the zigs and zags are so close that they appear to be parallel. The objective is to obtain pulse spacing and flight speed so that the nominal pulse spacing (NPS) is approximately equal in the in-flight and cross-flight directions.
Current ASPRS LAS classes are listed in Table 6. The minimum LAS classes for 3DEP topographic LiDAR datasets are classes 1, 2, 7, 9, 17, 18 and 20. Note also that class 20 was previously called class 10. Additional LAS classes for bathymetric or topobathymetric lidar include classes 40 through 45.
Table 6. LAS Classes
Class Value |
Meaning |
0 |
Created, never classified |
1 |
Processed but unclassified, including undefined points such as unclassified vegetation |
2 |
Bare-earth ground |
3 |
Low vegetation |
4 |
Medium vegetation |
5 |
High vegetation |
6 |
Building |
7 |
Low point (noise) |
8 |
Model key points |
9 |
Water |
10 |
Rail |
11 |
Road surface |
12 |
Reserved |
13 |
Wire – guard (shield) |
14 |
Wire – conductor (phase) |
15 |
Transmission tower |
16 |
Wire-structure connector (e.g., insulator) |
17 |
Bridge deck |
18 |
High noise |
20 |
Ignored ground (near a breakline) |
21 |
Snow |
40 |
Bathymetric point (e.g., seafloor or riverbed; also known as submerged topography) |
41 |
Water surface from bathy or topobathy LiDAR, distinct from Class 9 used for topo LiDAR |
42 |
Derived water surface (synthetic water surface used in computing refraction at water level) |
43 |
Submerged object, not otherwise specified (e.g., wreck, rock, submerged piling) |
44 |
International Hydrographic Organization (IHO) S-57 object, not otherwise specified |
45 |
No-bottom-found-at (bathy LiDAR point for which no detectable bottom return was received) |
46 |
Top of Unconsolidated Material |
Others to 63 |
Reserved |
64-255 |
User definable |
Full waveform data: Lidar data in which the entire reflection of the laser pulse is fully digitized, captured, and stored. [Note: Standard discrete return lidar point clouds may already be extracted by lidar providers from full waveform lidar data during post processing for simplified user applications. Not all lidar systems are capable of digitizing the entire return signal. Discrete return lidar captures and stores the important peaks in the waveform data, each peak representing a return from a different target, discernible in vertical or horizontal domains.] Lidar waveform datasets are much more demanding to store and process and require specialized software.
Breaklines required for standard hydro-flattening: Hydro-flattening is a term used by USGS to explain how DEMs are processed for inclusion in the 3DEP. Hydro-flattening is performed to depict the bare-earth terrain as one could see and understand the terrain from an airplane flying overhead. The viewer would assume that the surfaces of lakes and reservoirs are flat and that rivers are flat from shore to shore, perpendicular to the apparent flow centerline which maintains a downhill water surface gradient. The viewer would also recognize that bridges are man-made features that should be removed from a bare-earth DTM because they are artificially elevated above the natural terrain.
The USGS Lidar Base Specification, V1.2 provides detailed guidance on breaklines for hydro-flattening, including inland ponds and lakes (≥2 acre surface area), dual-line streams and rivers (≥100 feet nominal width), non-tidal boundary waters, tidal water bodies, and islands (>1 acre).
Figure 46 shows a DEM that has been hydro-flattened with breaklines to make the lake shoreline level and to flatten the stream from bank-to-bank. Note that bridges have been cut, but unseen culverts have not been cut. Compare with Figure 47 below.
|
|
Figure 46. Higher density, irregularly-spaced lidar mass points (left side of image) are used to interpolate the lower- density regularly-spaced DEM elevation posts on the right. Several hydro breaklines are also shown in this image. |
Figure 47. Example of a lake and stream that have been hydro-flattened with breaklines; overpasses and bridges are “removed” but culverts remain uncovered.
|
Additional breaklines required for hydro-enforcement of culverts: Looking back at Figure 46, it can be seen that there are three locations where the DEM appears to block the flow of water, forming artificial flow barriers where below-grade culverts route water under roads. These culverts were not readily visible from the air when lidar or aerial photography was acquired.
Figure
48. Intensity image showing streaks over water from multiple flight
lines. This is not a problem because topographic lidar measurements
on water are already assumed to be unreliable and are classified
separately as LAS class 9.
Figure
35. Hydro-enforcement uncovers below-ground culverts, allowing water
to flow through these culverts in hydrologic and hydraulic models.

Intensity Images: Lidar also produces intensity images that record the intensity of return from each laser pulse. Intensity images are used with lidargrammetry for compilation of 3D breaklines. Figure 48 shows a sample lidar intensity image. The 3DEP requires intensity images to be produced for each tile to match the Classified LAS and DEM files. Images are 8-bit, 256 color gray scale in GeoTIFF format. Cell size is 2.5 feet. IfSAR and side-scan sonar both produce images that are somewhat similar to lidar intensity images.
Figure
36. Intensity image showing streaks over water from multiple flight
lines. This is not a problem because topographic lidar measurements
on water are already assumed to be unreliable and are classified
separately as LAS Class 9.
Survey or Ground Control: The 3DEP requires ground control and check points that satisfy requirements specified in the ASPRS Positional Accuracy Standards for Digital Geospatial Data (2014). Ground control will be established by the data producer, but QA/QC checkpoints are funded by the client, and with the quantity of such checkpoints specified in ASPRS’ table below (Table 7).
Table 7. Recommended Number of Checkpoints Based on Area
Project Area (Square Kilometers) |
Horizontal Accuracy Testing of Orthoimagery and Planimetrics |
Vertical and Horizontal Accuracy Testing of Elevation Data sets |
||
Total Number of Static 2D/3D Checkpoints (clearly-defined points) |
Number of Static 3D Checkpoints in NVA2 |
Number of Static 3D Checkpoints in VVA |
Total Number of Static 3D Checkpoints |
|
≤500 |
20 |
20 |
5 |
25 |
501-750 |
25 |
20 |
10 |
30 |
751-1000 |
30 |
25 |
15 |
40 |
1001-1250 |
35 |
30 |
20 |
50 |
1251-1500 |
40 |
35 |
25 |
60 |
1501-1750 |
45 |
40 |
30 |
70 |
1751-2000 |
50 |
45 |
35 |
80 |
2001-2250 |
55 |
50 |
40 |
90 |
2251-2500 |
60 |
55 |
45 |
100 |
Using metric units, ASPRS recommends 100 static vertical checkpoints for the first 2,500 square kilometer area within the project (i.e., approximately 1,000 square miles), which provides a statistically defensible number of samples on which to base a valid vertical accuracy assessment. For horizontal testing of areas >2,500 km2, clients should determine the number of additional horizontal checkpoints, if any, based on criteria such as resolution of imagery and extent of urbanization. Figures 49 and 50 show how horizontal QA/QC checkpoints are selected.
For vertical testing of areas >2,500 km2, add five additional vertical checkpoints for each additional 500 km2 area. Each additional set of five vertical checkpoints for 500 km2 would include three checkpoints for Non-vegetated Vertical Accuracy (NVA) and two for Vegetated Vertical Accuracy (VVA). The recommended number and distribution of NVA and VVA checkpoints may vary depending on the importance of different land cover categories and client requirements.
|
|
Figure 49. This is an example of a photo-identifiable feature that makes a good control point or QA/QC checkpoint for either vertical or horizontal accuracy testing |
Figure 50. This feature is ideal for three reasons: (1) it is photo-identifiable on imagery or lidar intensity returns, (2) the target is a clearly-defined point feature at a 90 degree corner, and (3) its location will probably not move. |
FAQ #17: What geospatial data types could be integrated with 3D topographic data?
Aerial or Satellite Imagery: Aerial imagery includes digital orthophotos produced from aerial photography, and satellite imagery includes digital orthophotos produced from satellite photography -- either of which can be draped over digital elevation models and viewed in any chosen 3D perspective, as shown at Figure 51.
Figure 51. Top: Simulated view of Denali (highest mountain in the U.S.) created by draping a satellite image over the IFSAR DEM. Bottom: Actual fly-by photo of Denali photographed out the window of an aircraft in Alaska.
Geologic or seismic data: Geologic features such as seismic faults, volcanoes and landslide hazards are easier to visualize when draped over 3D elevation data, as shown at Figure 52. Note: Geologists use QL1 LiDAR or better for many of their applications, including delineation of geological features and seismic faults, often non-visible when walking on the terrain.
|
|
Figure 52. Geologic faults overlaid on digital terrain model |
Figure 53. Extraction of MHW shoreline at Sandy Hook, NJ from topobathymetric lidar. |
Shoreline data: Official shorelines, e.g., Mean High Water (MHW), are extracted from topobathymetric data, defining the official boundary between state-owned and privately-owned lands, as shown at Figure 53.
Land use/land cover (LU/LC) data: Elevation data are commonly used to identify LU/LC, especially as pertains to vegetation types, as shown at Figure 54, and forest metrics
|
|
Figure 54. NRCS uses lidar elevation data for quantification of vegetation types in rangeland. The number of acres of shrub and tree vegetation types can be estimated by spatial analysis map algebra functions. |
Wetland data: Wetlands are largely delineated from color infrared imagery and lidar data, as shown at Figure 55.
|
|
|
Figure 55. Color infrared imagery (left), lidar DTM (center) and lidar DSM (right) all work together for wetland identification. DTMs help differentiate wetland water regimes (flooding duration). DSMs help differentiate vegetation classification (e.g., trees vs. shrubs). Lidar point clouds help determine vegetation structure (e.g., pines vs. oaks). |
||
Inland surface water features: Inland surface water features such as lakes and ponds, streams and rivers, canals, oceans are delineated from 3D topographic data in a GIS so that each feature has a name and/or feature identification code
Bridge/culvert data: Bridge and culvert data can be integrated with 3D topographic data and attributed with feature identification codes in a GIS
Landmark features: Landmark features can be identified from 3D topographic data as recognizable natural or artificial features used primarily for navigation.
Cultural resources: Cultural features in National Parks or prehistoric Indian mounds can either be identified from 3D topographic data or integrated with 3D topographic data for 3D visualization
Coastal and riverine structures: Shoreline stabilization structures, levees, dams, jetties, piers, weirs, etc. can either be identified from 3D topographic data or integrated with 3D topographic data for 3D visualization.
Lowest floor elevations: Lowest floor elevations of buildings or other structures could be overlaid on 3D topographic data, but not derived from such 3D data. Lowest floor elevations in basements, for example, cannot be derived from aerial surveys of any type, but they can be estimated from mobile mapping systems capable of detecting basement windows, or for determining elevations of the bottom of front doors, for example, for structures without basements.
FAQ #18: How do I find out what topographic or bathymetric data are currently available?
Questionnaire respondents may need to know what elevation data already exist for their area of interest in order to better understand future requirements for more current and accurate data.
There are two Federal on-line inventories of elevation data where you can see what data are available, when they were collected, by whom, and to what level of accuracy. Each includes data collected by Federal, state, and local agencies, but may not include all locally or privately collected elevation datasets.
The U.S. Interagency Elevation Inventory is available here: https://coast.noaa.gov/inventory/. It includes information about topographic, and topobathymetric, and offshore bathymetry data. You can turn on and off the different data types and view their date and Quality Level. As shown at Figures 56 and 57, you can also download the spatial data for the inventory for further review or analysis.
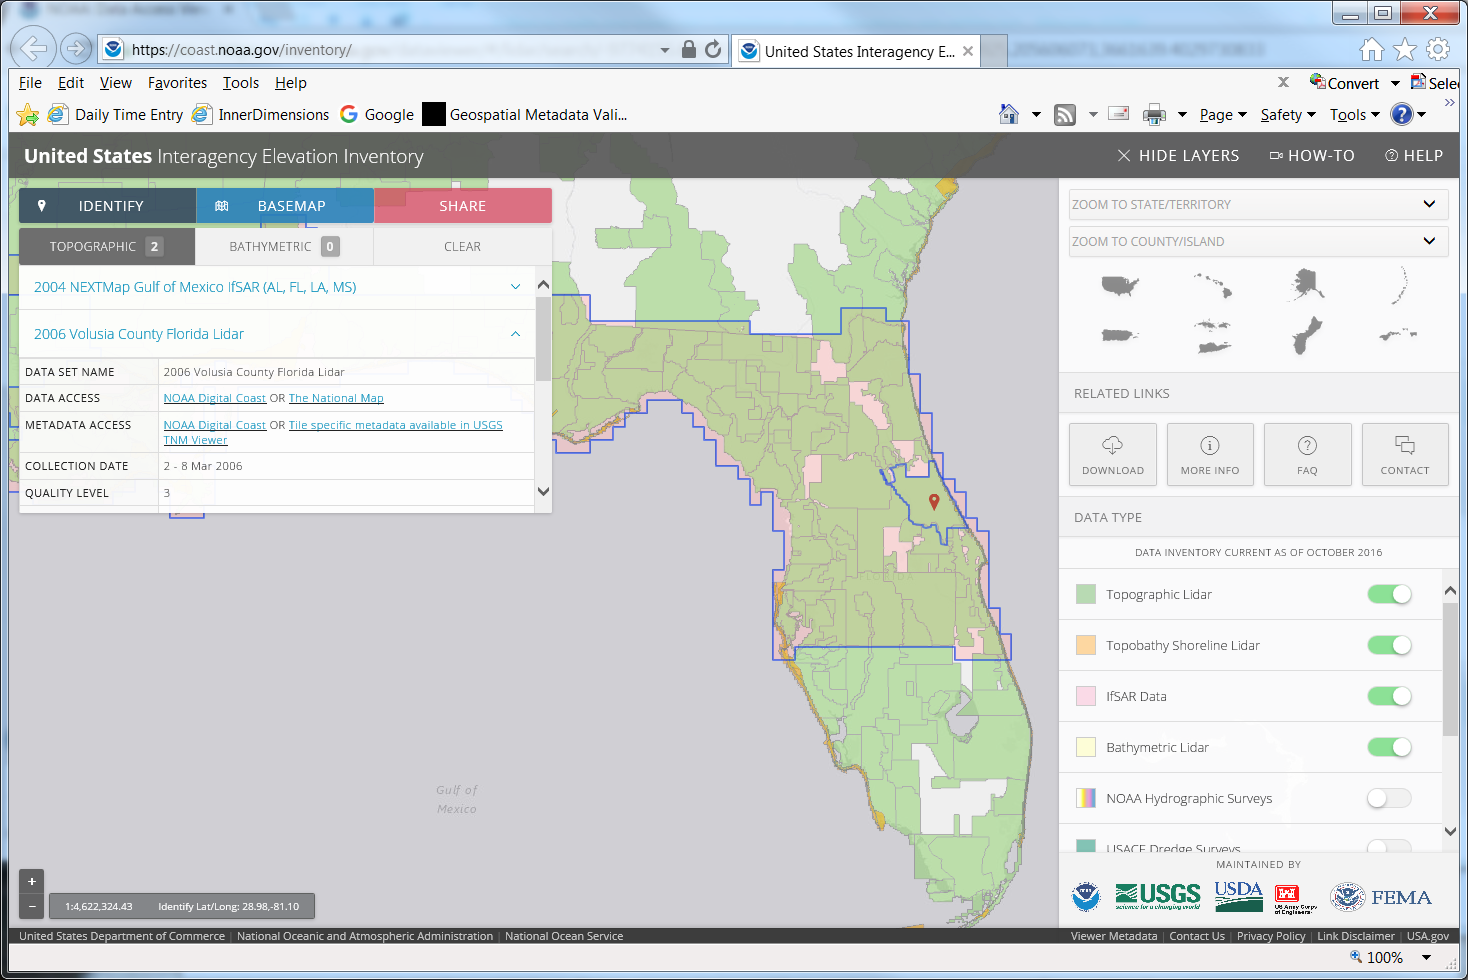
Figure 56. U.S. Interagency Elevation Inventory (USIEI)
NOAA’s Data Access Viewer is available here: https://coast.noaa.gov/dataviewer/#/lidar/search/. This is for lidar data download. You can also download actual elevation data from this site.
Figure 57. NOAA’s Data Access Viewer.
FAQ #19: Please explain the different 3D data sources referenced in the questionnaire.
The National Map: The National Map is a collaborative effort among the USGS and other Federal, State, and local partners to improve and deliver topographic information for the Nation. It has many uses ranging from recreation to scientific analysis to emergency response. The National Map is easily accessible for display on the Web, as products and services, and as downloadable data. The geographic information available from The National Map includes elevation, geographic names, hydrography, boundaries, transportation, structures, orthoimagery (aerial photographs) and land cover. Other types of geographic information can be added within the viewer or brought in with The National Map data into a Geographic Information System to create specific types of maps or map views. The National Map is a significant contribution to the National Spatial Data Infrastructure (NSDI) and currently is being transformed to better serve the geospatial community by providing high quality, integrated geospatial data and improved products and services including new generation digital topographic maps.
Digital Coast: The Digital Coast is a NOAA-sponsored website that was developed to meet the unique needs of the coastal management community. The website provides not only coastal data, but also the tools, training, and information needed to make these data truly useful. Content comes from many sources, all of which are vetted by NOAA. Data sets range from economic data to satellite imagery. The site contains visualization tools, predictive tools, and tools that make data easier to find and use. The Digital Coast is managed by NOAA’s Office for Coastal Management and was first released in 2007.
NOAA National Centers for Environmental Information (NCEI): NOAA's National Centers for Environmental Information (NCEI) hosts and provides public access to archives for environmental data on Earth with over 25 petabytes of comprehensive oceanic, atmospheric, and geophysical data. From the depths of the ocean to the surface of the sun and from million-year-old ice core records to near-real-time satellite images, NCEI is the Nation’s leading authority for environmental information. By preserving, stewarding, and maximizing the utility of the Federal government’s billion-dollar investment in high-quality environmental data, NCEI provides products and services to private industry and businesses, local to international governments, academia, as well as the general public.
Open Topography: OpenTopography is a distributor of free high-resolution, Earth science-oriented topographic data, related tools, and resources. Its mission is to:
The OpenTopography Facility is based at the San Diego Supercomputer Center at the University of California, San Diego and is operated in collaboration with colleagues in the School of Earth and Space Exploration at Arizona State University and at UNAVCO. Core operational support for OpenTopography comes from the National Science Foundation Earth Sciences: Instrumentation and Facilities Program (EAR/IF), Geoinformatics, and EarthCube. OpenTopography was initially developed as a proof of concept cyberinfrastructure in the Earth sciences project as part of the NSF Information and Technology Research (ITR) program-funded Geoscience Network (GEON) project.
USGS Coastal and Marine Geology Program Inland Waters of the United States Map Server: The U.S. Geological Survey (USGS) Coastal and Marine Geology Program (CMGP) conducts integrated mapping of the coastal and marine environment to define offshore hazards and sediment processes, support habitat and resource management, and monitor change. CMGP provides expertise in mapping and laboratory analyses, working with other governmental agencies, educational institutions, and private companies and conducting collaborative research and development with similar groups to continually correct and perfect the data collection tools, analytical techniques, and technologies utilized in coastal and marine studies.
The Coastal and Marine Geology Program Interactive Maps portal provides public access to published GIS-related data and maps, including bathymetric data for select inland waters of the U.S.
USGS Data Series: Through its Publications Warehouse, USGS publishes data sets that were collected or generated as part of USGS studies. The Data Series includes basic data sets, databases, and multimedia or motion graphics. An individual data set may include videos, computer programs, and collections of digital photographs. Each publication has its own descriptive citation page that is dynamically generated based on information stored in a database and provides a link to the publication itself and/or the data associated with the publication. |
NOAA Nautical Charts: NOAA maintains the nation’s nautical charts and publications for U.S. coasts and the Great Lakes. Over a thousand charts cover 95,000 miles of shoreline and 3.4 million square nautical miles of waters.
NOAA Electronic Navigational Charts (ENCs) are vector data sets that represent NOAA's newest and most powerful electronic charting product. NOAA ENCs conform to the International Hydrographic Office (IHO) S-57 international exchange format, comply with the IHO ENC Product Specification, and are provided with incremental updates that supply Notice to Mariners corrections and other critical changes. NOAA ENCs and updates are available for free download. NOAA ENC data may be used to fuel Electronic Chart and Display Information Systems (ECDIS).
In 1997, NOAA began a process of building a portfolio of ENCs that encompass the same areas covered by NOAA’s suite of approximately 1,000 paper and raster charts. The ideal and most accurate way to build ENCs is to recompile the paper chart from all of the original source material. Unfortunately, this process is impractical as it is far too labor intensive. Instead, NOAA ENCs have been compiled from source on those features that are deemed to be navigationally significant. U.S. Army Corps of Engineers' federal project limits have been captured from large-scale drawings. These precise coordinates of channel limits are being incorporated into the ENC. Likewise, high-accuracy positions are being used to chart U.S. Coast Guard aids to navigation. The paper chart has been the source for the remainder of items.
Figure
58. Example of an Inland Electronic Navigational Chart (IENC). which
includes coal, petroleum products, various other raw materials, food
and farm products, chemicals, and manufactured goods. The shallow
draft waterways have many unique characteristics and difficulties
over coastal harbor and ocean navigation; river levels can change by
over 30 feet in a seasonal cycle, the navigation channel can shift
significantly within the river banks, and shifting yet ever present
river currents pose constant challenges in these confined waterways.
Electronic chart systems can offer significant benefits to vessels
including accurate and real-time display of vessel position relative
to waterway features, voyage planning and monitoring, training tools
for new personnel and integrated display of river charts, radar, and
Automatic Identification Systems.
Figure
59. Example of an Inland Electronic Navigational Chart (IENC)
Figure
66. Example of data from Marine Minerals Program website
Figure
60. Example of a smooth sheet.


Figure
59. Map made using the Marine Minerals Program GIS.
Offshore political boundaries (planning areas, Submerged Lands Act boundaries, Protraction Map boundaries);
Environmental features (e.g., shorelines, habitats and biologically important areas, obstructions, shipwrecks, pipelines);
BOEM planning and administrative boundaries (e.g., lease areas, dredge areas, avoidance areas, study areas, sand resources, etc.);
Sample data used to identify sand resources (e.g., grab, core, and water samples; camera locations; endangered species impacts);
Bottom characteristics (e.g., faults; contours; isopachs; tracklines; geological, acoustic, and magnetic seabed features; sediments; seismic; paleo channels; and acoustic profiles);
Bathymetry and backscatter data (e.g., single beam, multi beam, lidar, magnetometer, sidescan sonar); and
BOEM construction survey data (e.g., construction tracklines, dredge pipelines, dredge pumpouts).
FAQ #20: How are navigable channels defined?
The U.S. Army Corps of Engineers (USACE) defines navigable waters as “those waters subject to the ebb and flow of the tide shoreward to the mean high water mark and/or are presently used, or have been used in the past, or may be susceptible for use to transport interstate or foreign commerce.” Thus, navigable channels would normally transport river barges carrying grain to downstream ports, for example, rather than smaller recreational or fishing boats that can navigate almost any stream.
FAQ #21: How does Total Horizontal Uncertainty (THU) at the 95% confidence level correlate with bathymetric/topobathymetric lidar Quality Levels and IHO hydrographic survey Orders for sonar?
Table 8 correlates bathymetric lidar Quality Levels with ANPD, RMSEx, RMSEy, RMSEr, RMSEz and THU at 10m depth. Horizontal accuracy from bathymetric lidar is also a function of positional errors from GPS/GNSS, INS and flying altitude of the sensor; however, both vertical and horizontal errors increase at greater water depths.
Table 8. Horizontal and vertical accuracies achievable for standard bathymetric Quality Levels at 10m depth
Bathymetric Data Quality Level |
RMSEz |
Aggregate Nominal Pulse Spacing (ANPS) |
ASPRS Horizontal Accuracy Class = RMSExy |
RMSEr |
Total Horizontal Uncertainty (THU) at 95% confidence level |
QL0B |
13.3 cm |
≤0.7m |
81.7cm |
1.16m |
2m |
QL1B |
13.3 cm |
≤2.0 m |
81.7cm |
1.16m |
2m |
QL2B |
16.7 cm |
≤0.7m |
1.23m |
1.73m |
~3m |
QL3B |
16.7 cm |
≤2.0m |
1.23m |
1.73m |
~3m |
QL4B |
26.4 cm |
≤5.0m |
2.25m |
3.18m |
5.5m |
Table 9 correlates IHO hydrographic survey orders for sonar feature detection, RMSEx, RMSEy, RMSEr, RMSEz and THU at 10m depth. Vertical and horizontal errors from sonar also increase at greater water depths.
Table 9. Horizontal and vertical accuracies achievable for IHO Orders for sonar at 10m depth
IHO Order |
RMSEz |
Feature Detection Capability |
RMSEx and RMSEy |
RMSEr |
Total Horizontal Uncertainty (THU) at 95% confidence level |
Special Order |
26.1 cm |
Cubic features >1m |
81.7cm |
1.16m |
2m |
1a |
32.7 cm |
Cubic features >2m |
2.25m |
3.18m |
5.5m |
1b |
32.7 cm |
N/A |
2.25m |
3.18m |
5.5m |
2 |
51.7 cm |
N/A |
8.58m |
12.13m |
21m |
FAQ #22: How does Total Vertical Uncertainty (TVU) at the 95% confidence level correlate with bathymetric/topobathymetric lidar Quality Levels and IHO hydrographic survey Orders.
The ASPRS Positional Accuracy Standards for Digital Geospatial Data (ASPRS, 2014) define Vertical Accuracy Classes in terms of RMSEz, and a 1.96 multiplier to convert RMSEz into Vertical Accuracy at the 95% confidence level or Total Vertical Uncertainty (TVU) at the 95% confidence level.
Accuracies of Bathymetric Lidar Quality Levels
Table 10, below, translates the latest ASPRS standard in terms of the bathymetric/topobathymetric lidar data Quality Levels used for this study.
Table 10. Vertical accuracy of bathymetric/topobathymetric lidar Quality Levels
Bathy/Topobathy Lidar Quality Levels |
RMSEz |
Aggregate Nominal Pulse Spacing (ANPS) |
Total Vertical Uncertainty (TVU) at 95% confidence level |
QL0B |
13.3 cm |
≤0.7m |
26.0 cm |
QL1B |
13.3 cm |
≤2.0m |
26.0 cm |
QL2B |
16.7 cm |
≤0.7m |
32.7 cm |
QL3B |
16.7 cm |
≤2.0m |
32.7 cm |
QL4B |
26.4 cm |
≤5.0m |
51.7 cm |
Accuracies of Sonar by IHO Orders
Table 11 shows the Total Vertical Uncertainty (TVU) at the 95% confidence level (highlighted in yellow) at three depth examples for the various IHO Orders of hydrographic surveys (sonar).
Table 11. TVA Examples for IHO Orders
IHO Order |
Special |
1a |
1b |
2 |
Total Horizontal Uncertainty (THU) (95% Confidence Level) |
2m |
5m + 5% of depth |
5m + 5% of depth |
20m + 10% of depth |
Total Vertical Uncertainty (TVU) (95% Confidence Level) |
a = 0.25m b = 0.0075 |
a = 0.5m b = 0.013 |
a = 0.5m b = 0.013 |
a = 1.0m b = 0.023 |
Full Seafloor Search |
Required |
Required |
Not required |
Not required |
Feature Detection Capability |
Cubic features > 1m |
Cubic features > 2m in depths up to 40m; 10% of depth beyond 40m |
Not applicable |
Not applicable |
Maximum Line Spacing |
Not applicable, as 100% search is required |
Not applicable, as 100% search is required |
3 x average depth or 25m, whichever is greater |
4 x average depth |
Depth Examples |
TVU of submerged elevations at 95% Confidence Level |
|||
0 m |
25.0 cm |
30.0 cm |
30.0 cm |
50.0 cm |
10 m |
26.1 cm |
32.7 cm |
32.7 cm |
51.7 cm |
20 m |
29.2 cm |
39.7 cm |
39.7 cm |
56.4 cm |
Example Applications |
Harbors, berthing areas, and associated critical channels where under-keel clearance is critical |
Harbors, harbor approach channels, recommended tracks, and some coastal areas with depths up to 100 m where under-keel clearance is less critical but of concern to surface shipping may exist |
Areas shallower than 100 m where under-keel clearance is not considered to be an issue for the type of surface shipping expected to transit the area |
Areas generally deeper than 100 m where a general description of the sea floor is considered adequate |
FAQ #23: How are inland and nearshore bathymetric and topobathymetric data produced and how are their Quality Levels (QLs) defined?
Bathymetric Mapping Technologies
For bathymetric mapping, airborne lidar bathymetry (ALB) is a technique for measuring the depths of moderately clear waters from a low-altitude aircraft using a green-wavelength scanning, pulsed laser beam. ALB have larger beam divergence and have greater depth penetration capability, up to 60 m water depths in clear water, and use sophisticated waveform analysis-based algorithms to determine water depth (Figure 60). |
|
|
Figure 60. Bathymetric and topobathymetric lidar, with green laser, map water surface and submerged topography. |
Topobathymetric lidar systems, also called topobathy systems, have smaller beam divergence with less penetration capability, up to 10 m water depths in clear water, and rely on a simple refraction correction technique to determine water depth. Most bathymetric and topobathymetric LiDAR systems can also provide topography data over land areas.
Acoustic Survey Systems (sonar) has long been used for bathymetric mapping and hydrographic surveying. Sonar systems use sound waves and echo sounders to measure water depths. Although there are several different types of sonar systems, multi-beam echo sounders (MBES), also called multibeam sonars, are generally best for broad area coverage, being similar to lidars in that they collect swaths of depth data with individual beams as shown in Figure 61.
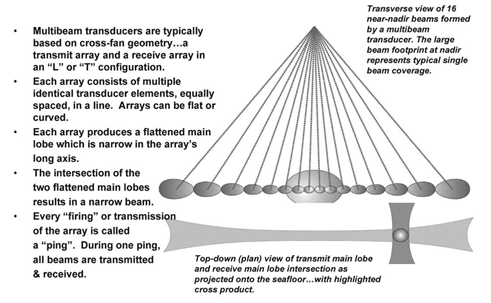
Figure 61. Individual beams in a multibeam transducer form a swath of elevation (depth) points.
Bathymetric Lidar Advantages
Bathymetric or topobathymetric lidar (Airborne Lidar Bathymetry – ALB) measures the depths of moderately clear, near-shore coastal waters, lakes, and rivers from a low-altitude aircraft. The round-trip time-of-flight of each laser pulse to the water surface and sea floor is measured by receivers in the aircraft. With this information, and the speed of light in air and water, accurate water depth can be calculated. This technique is also known as airborne lidar hydrography (ALH) when used primarily for nautical charting.
This is important because hydrographic charts for many of the world’s coastal areas are either out of date or nonexistent. The overall status of hydrographic surveying and nautical charting world-wide is rated in the range from poor to fair (UN, 1989). Hydrography, worldwide, is in a state of crisis regarding the ability of professional hydrographic organizations to provide the needed and desired products within their budgets and in a timely manner. Bathymetric lidar can deliver faster and cheaper shallow-water surveying for both hydrographic and bathymetric purposes.
Bathymetric lidar has proven to be an accurate, cost-effective, rapid, safe, and flexible method for surveying in shallow water and on coastlines where sonar systems are less efficient and can even be dangerous to operate.
The costs of operations for all current ALB systems are reported most often as 15-30% of the standard acoustic survey cost, depending on location, depth, and survey density. ALB soundings are densely spaced, typically on a 0.5-5 meter grid, within a wide swath under the aircraft, whose width is roughly typically greater than half of the aircraft altitude. The major limitation is water clarity. For areas with very clear water, the advantage of surveying a wide swath at aircraft speeds can be obtained for depths as great as 50 meters or more. The fact that airborne lidar can also measure land topography and survey simultaneously on both sides of the land/water boundary is highly beneficial and attractive to coastal engineers. Figure 62 presents a graphic comparison of lidar and sonar operations in shallow water.
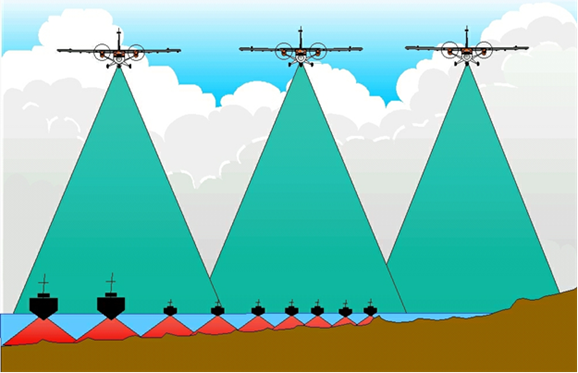
Figure 62. Depiction of lidar and multi-beam sonar operation in shallow water to emphasize lidar capabilities and efficiency.
Bathymetric Lidar Limitations
The major limitation of bathymetric or topobathymetric lidar is that success is largely dependent on the clarity of the water. Bathymetric or topobathymetric lidar cannot map the subsurface terrain beneath the muddy Mississippi River, lakes covered with algae, wetlands with murky waters, and shorelines with high sediment suspension from surf action. See Figures 63 and 64. The ability to determine the sea bottom is also dependent on the type of sensor being used. Traditional bathymetric lidar sensors that have a high-power wide beam are able to better penetrate through turbid waters. Topobathymetric sensors typically have lower power and utilize a narrow beam that results in more potential voids in turbid waters, but they are cheaper to operate. Bathymetric surveys must be conducted during periods of most optimal water clarity; sometimes water clarity changes seasonally or even daily.
|
|
Figure 63. Topobathymetric lidar data voids caused by bio-luminescence in this bay in Puerto Rico |
Figure 64. Topobathymetric lidar data voids caused by surf with suspended sediments |
Sonar Comparisons
Complete, high-resolution bathymetric surface models can, and have been for decades, developed using vertical beam echo sounder (VBES) techniques; however, the more modern multi-beam echo sounder (MBES) performs more quickly and efficiently in water depths deeper than about 20 meters. In calm waters shallower than ten meters, sweep sonar is very effective, and interferometric sonar sensors are effective at bathymetry between one and 20 meters deep. As object size decreases, side scan sonar may be used whenever object detection is the primary reason for surveying and environmental factors allow it to be accomplished safely. There is competition between the different sonar types with regard to which is best to use for a particular survey requirement, but they still represent the same basic acoustic technology. Figure 62, above, compares multi-beam sonar with ALB or topobathymetric lidar.
Bathymetric and Topobathymetric Quality Levels
The National Science and Technology Council has developed the National Coastal Mapping Strategy 1.0: Coastal LiDAR Elevation for a 3D Nation, in which it proposes bathymetric equivalents (QL0B, QL1B, QL2B, QL3B and QL4B) to topographic data Quality Levels in the USGS Lidar Base Specification (QL0 HD, QL0, QL1 HD, QL1, QL2, and QL5).
User requirements for bathymetric and/or topobathymetric data will be defined at five potential bathymetric Quality Levels (Table 12) consistent with standards of the International Hydrographic Office (IHO), USACE hydrographic survey requirements, the IWG-OCM National Coastal Mapping Strategy, and Quality Levels being considered for the 3D Nation. Note that QL0B and QL1B are equivalent to the IHO Special Order standard for vertical accuracy, and the vertical accuracy specification for QL4B is equivalent to the IHO Order 1 standard for vertical accuracy. The higher-density QL0B and QL2B are better for detection of submerged objects that may be hazardous to marine navigation.
Table 12. Bathymetric/Topobathymetric Lidar Data Density and Absolute Vertical Accuracy
|
QL0B |
QL1B |
QL2B |
QL3B |
QL4B |
|
IHO Special Order |
|
|
IHO Order 1 |
|
Aggregate Nominal Pulse Spacing |
≤0.7m |
≤2.0 m |
≤0.7 m |
≤2.0 m |
≤5.0 m |
Aggregate Nominal Pulse Density |
≥2.0 pts/m2 |
≥0.25 pts/m2 |
≥2.0 pts/m2 |
≥0.25 pts/m2 |
≥0.04 pts/m2 |
Depth Examples (m) |
Vertical Accuracy of submerged elevations at 95% Confidence Level (cm) |
||||
0 |
25.0 |
25.0 |
30.0 |
30.0 |
50.0 |
10 |
26.1 |
26.1 |
32.7 |
32.7 |
51.7 |
20 |
29.2 |
29.2 |
39.7 |
39.7 |
56.4 |
Applications |
Detailed site surveys requiring the highest accuracy and highest resolution seafloor definition; dredging and inshore engineering surveys; high-resolution surveys of ports and harbors |
Charting surveys; regional sediment management; general bathymetric mapping; coastal science and management applications; change analysis; deep water surveys; environmental analyses |
Recon/planning; all general applications not requiring higher resolution and accuracy |
||
Definitions of terms relevant to the terminology used in Table 12 are included below.
Nominal Pulse Spacing (NPS) — A common measure of the density of a point-based elevation dataset (e.g., lidar, IfSAR, sonar), it is the typical or average lateral distance between points in a dataset, most often expressed in meters. NPS refers to the average point spacing of a dataset typically acquired in a zig-zag pattern with variable point spacing along-track and cross-track. NPS is an estimate and not an exact calculation.
Aggregate Nominal Pulse Spacing (ANPS) — A variant of nominal pulse spacing (NPS) that expresses the typical or average lateral distance between pulses in a dataset resulting from multiple passes of the sensor, or a single pass of a platform with multiple sensors, over the same target area.
Nominal Pulse Density (NPD) — A common measure of the density of a single pass (single swath) of a point-based elevation dataset (e.g., lidar, IfSAR, sonar), expressed as points per square meter (PPSM), normally used when the Nominal Pulse Spacing (NPS) is less than one meter. PPSM = 1/NPS2.
Aggregate Nominal Pulse Density (ANPD) — A variant of nominal pulse density (NPD) that expresses the total expected or actual density of pulses occurring in a specified unit area resulting from multiple passes of the sensor, or a single pass of a platform with multiple sensors, over the same target area.
Bathymetric Vertical Accuracy — The value by which vertical accuracy of submerged topography mapped with topobathymetric or bathymetric sensors (e.g., lidar, sonar) can be equitably assessed and compared among datasets when applying the ASPRS Positional Accuracy Standard for Digital Geospatial Data. For practical purposes, absolute vertical accuracy of submerged topography can only be determined for nearshore bathymetry where GPS antenna on elevated range poles can be used to measure submerged QA/QC checkpoints. Then, the vertical accuracy at the 95% confidence level is determined by multiplying RMSEz x 1.9600.
FAQ #24: What are the 3D bathymetric data products referenced in the questionnaire?
Digital Surface Model: Typically used synonymously with DEM for bathymetry models. Since surface features are not typically removed from bathymetric models, the products become virtually the same.
Digital Terrain Model (DTM): Typically used synonymously with DEM for bathymetry models. Since surface features are not typically removed from bathymetric models, the products become virtually the same.
Digital Elevation Model (DEM) of bathymetric surface: Raster or gridded product of horizontal position and vertical position for each cell. Formats can range from ESRI grid, CARIS CZAR files, to georeferenced tiffs or images where color value is correlated to depth value.
Point cloud data: A point cloud is a set of 3D data points in some coordinate system defined by X, Y, and Z coordinates. Point clouds generally consist of processed data, meaning that correctors for motion, position, soundspeed, or tidal offsets are already applied. This is generally an intermediate step for users who will eventually create a DEM from the point could for later use. Users who wish to manage how the data is gridded, for example to preserve certain density and uncertainty requirements, may desire to receive point cloud data from their data source.
Edited/cube XYZ data: A delimited text file (either by space, comma, or tab) that contains three columns for Latitude, Longitude, and Depth. These files are typically containing gridded point values that have already had correctors such as sound speed and tide (see FAQ #28). XYZ data are typically referred to in format, and contain similar information to a DEM or DTM.
Watercolumn: Multibeam sonar data in which the entire travel time of the acoustic pulse is fully digitized, captured, and stored. Multibeam sonars create bathymetry data from a bottom detection algorithm that discerns which portion of the pulse is most likely the seafloor. A multibeam can receive acoustic returns objects or biology captured by the acoustic pulse, but not specifically digitized by the bottom detection algorithm. Watercolumn data is acquired when objects or biology are of interest while using the multibeam sonar.

Figure 65. A cross section of watercolumn sonar data visualized along a ship trackline.
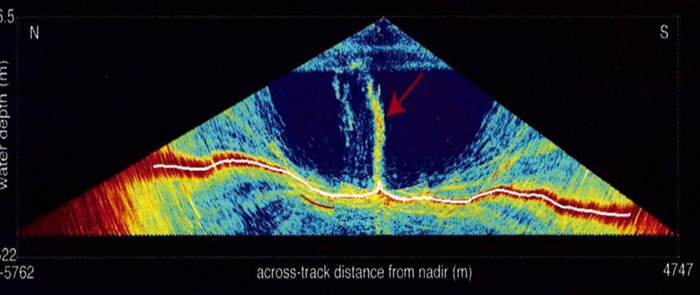
Figure 66. Methane plume in water column sonar data.
Bathymetric Attributed Grid (BAG) Files: Bathymetric Attributed Grid (BAG) is a non-proprietary file format for storing and exchanging bathymetric data developed by the Open Navigation Surface Working Group. BAG files are gridded, multi-dimensional bathymetric data files and are the standard used by NOAA’s National Ocean Service (NOS) for hydrographic data files made available for public release. Current versions of the BAG file contain position and depth grid data, as well as position and uncertainty grid data, and the metadata specific to that BAG file, providing end users information about the source and contents of the BAG file.
NCEI developed the capability to output data from BAG files as American Standard Code for Information Interchange (ASCII) xyz files. Empty space in BAG files is not included in xyz output files. On NCEI's web site, individual files, or entire surveys spanning multiple BAG files, can be selected, extracted, processed to xyz format, and zipped for shipment using a conversion capability. Each conversion also creates an Extensible Markup Language (XML) metadata file.
NOAA’s NOS also provides an image service of a seamless mosaic of high-resolution quality-controlled seafloor elevation from BAGs in U.S. coastal waters. Many nearshore areas have been mapped at high resolution (often 1 meter or better). The depths are usually relative to Mean Lower Low Water (MLLW) datum. Figure 67 provides a snapshot of an area of Long Island Sound seen in the BAG Viewer as a hillshaded image.
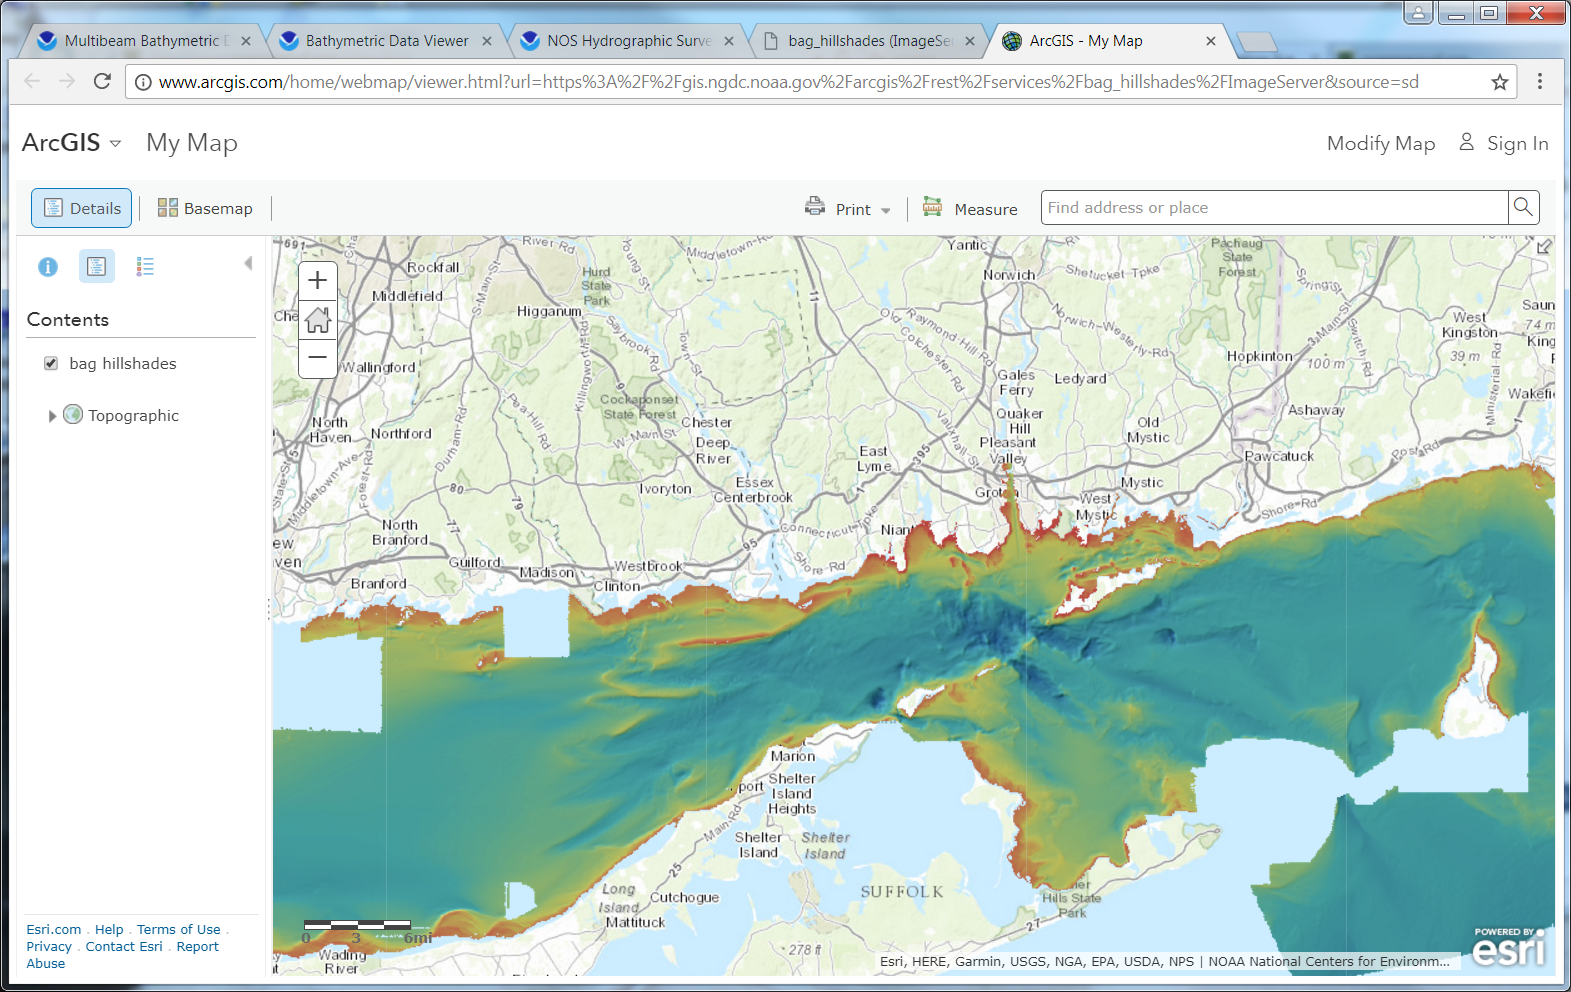
Figure 67. Snapshot image of an area of Long Island Sound seen in the BAG Viewer as a shaded image.
Backscatter: The amount of acoustic energy being received by the sonar after a complex interaction with the seafloor. This information can be used to determine bottom type, because different bottom types “scatter” sound energy differently. For example, a softer bottom such as mud will return a weaker signal than a harder bottom, like rock.
Backscatter products are typically a gridded in the same resolution as bathymetric products and are paired with bathymetry for analysis, as seen in Figure 66. The most common are georeferenced tiffs displaying numerical values for the backscatter intensity. These products are used for seafloor analysis, habitat modeling, and classification.
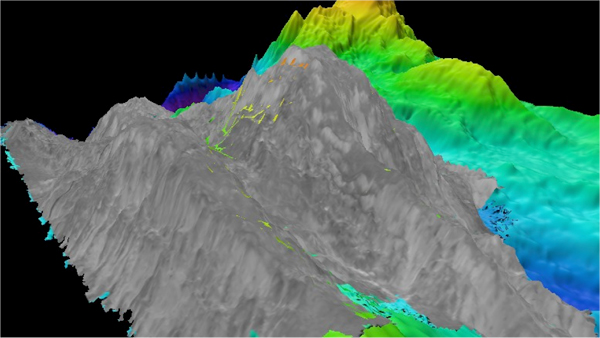
Figure 68. Example of backscatter (greyscale) draped over gridded bathymetry
Sidescan Sonar Mosaics: Sidescan sonar is collected using a towed transmitter that is typically towed close to the seabed to control the geometry of the pulses and the intensity of return. Sidescan sonar can be used to produce a detailed presentation of seabed features and manmade objects that may lie on the surface of the seabed in the form of a planimetric image. A sidescan sonar ensonifies the entire swath with the same acoustic transmit pulse. The same transducer is used for transmitting and receiving a pulse, thereby increasing the chances that the echoes received originated from points in the direction the transducer is pointing. However, removing multipath acoustic returns from the primary return can still be a challenge.
Variations in the intensity of the received sidescan sonar intensity signals can be used to identify differences in the materials that comprise the seabed. For instance, rock and gravel will return sound differently than sand, which will return sound differently than silt or decomposed organic matter. Interpretation of the sidescan sonar imagery requires considerable experience and first-hand knowledge of the backscatter characteristics of various rock types, gravels, sands, and the bed forms associated with them such as bedding, jointing, ripple marks, sand waves, etc.
Figure 69 shows a smaller-scale side-scan sonar mosaic. Figure 70 is an example of a high-resolution side-scan sonar mosaic created from survey data collected for the NOAA Bonaire coral reef expedition in 2008 by the GeoSwath sonar on the Gavia autonomous underwater vehicle (AUV). The image results from the measurement of high-frequency (500 kHz) short bursts of sound waves that bounce off of the seabed and return to the sonar unit. Bright areas indicate high return energy associated with coral fragments or scattered rocks, while dark patches represent shadow zones (areas where the sound was blocked) or patches of soft sand and/or mud that absorb more sound than rocks or corals. In this image the beach is towards the right and each grid cell is a 10- by 10-meter (m)/33- by 33-foot square. The total swath width (lateral distance from edge to edge) is 40 m (131 feet), and the line length from tip to tip is approximately 100 m (328 feet).
|
|
Figure 69. Example of small-scale sidescan sonar mosaic |
Figure 70. Example of high-resolution sidescan sonar mosaic |
Figure 71 shows a sidescan sonar image of the German U-boat U-166, collected by the HUGIN 3000 AUV in 2001. Image courtesy of NOAA, MMS, C & C, and the 2004 Gulf of Mexico Shipwreck Survey Expedition science party.
|
Figure 71. Sidescan sonar image of German U-boat U-166. |
Ground truthing: Many sonar data products can give information regarding the reflectance characteristics of the seafloor. By sampling the seafloor, these measurements can be correlated to specific seafloor characteristics such as sediment size, composition, texture, or as simple as a delineation between hard and soft seafloor areas. The specific characteristic used depends on the user’s data requirements and should be represented in the metadata. This practice is called ground truthing. Ground truthing can be accomplished using bottom sampling methods, such as a sediment sampler, photographic data, or video transects.
National Vertical Datum Transformation Tool (V-Datum): VDatum is a free software tool developed jointly by NOAA's National Geodetic Survey (NGS), Office of Coast Survey (OCS), and Center for Operational Oceanographic Products and Services (CO-OPS). VDatum is designed to vertically transform geospatial data among a variety of tidal, orthometric and ellipsoidal vertical datums - allowing users to convert their data from different horizontal/vertical references into a common system and enabling the fusion of diverse geospatial data in desired reference levels.
Merging datasets with inconsistent vertical datums can cause discontinuities that become problematic when producing maps, assimilating data and advanced model results, or performing simulations at the accuracy needed for informed, intelligent coastal zone management decision-making.
The VDatum tool is currently available for select areas of the U.S. Where available and uncertainties are established, VDatum supports the conversions among following:
Coordinate Systems: Geographic, UTM, State Plane Coordinates (SPC), and geocentric (ECEF)
Horizontal Datums: NAD27, NAD83(1986), and NAD83(HARN); and ellipsoidal datums such as of ITRF, WGS84, and NAD83 serializations
Vertical Datums:
Ellipsoidal Datums: NAD83, WGS84, ITRF88, ITRF89, ITRF90, NEOS 90, PNEOS 90, ITRF91, ITRF92, SIO/MIT 92, ITRF93, ITRF94, ITRF96, ITRF97, IGS97, ITRF2000, IGS00, IGb00, ITRF2005, IGS05, ITRF2008, IGS08, WGS84(transit), WGS84(G730), WGS84(G873), WGS84(G1150), WGS84(G1674), NAD83(PACP00), NAD83(MARP00)
Orthometric Datums: NAVD88, NGVD29, PRVD02, VIVD09, ASVD02, GUVD04, NMVD03, HAWAII EGM2008, EGM1996, and EGM1984
Tidal Datums: MLLW, MLW, LMSL, DTL, MTL, MHW, LWD, and MHHW
IGLD85
GEOID models: GEOID12B, GEOID12A, GEOID09, GEOID06 (Alaska only), GEOID03, GEOID99, and GEOID96
EGM models: EGM2008, EGM1996, and EGM1984
Supported file format: text(ASCII), LiDAR(.LAS) version 1.0 to 1.2, ESRI ASCII Raster(.ASC), and ESRI 3D shapefile
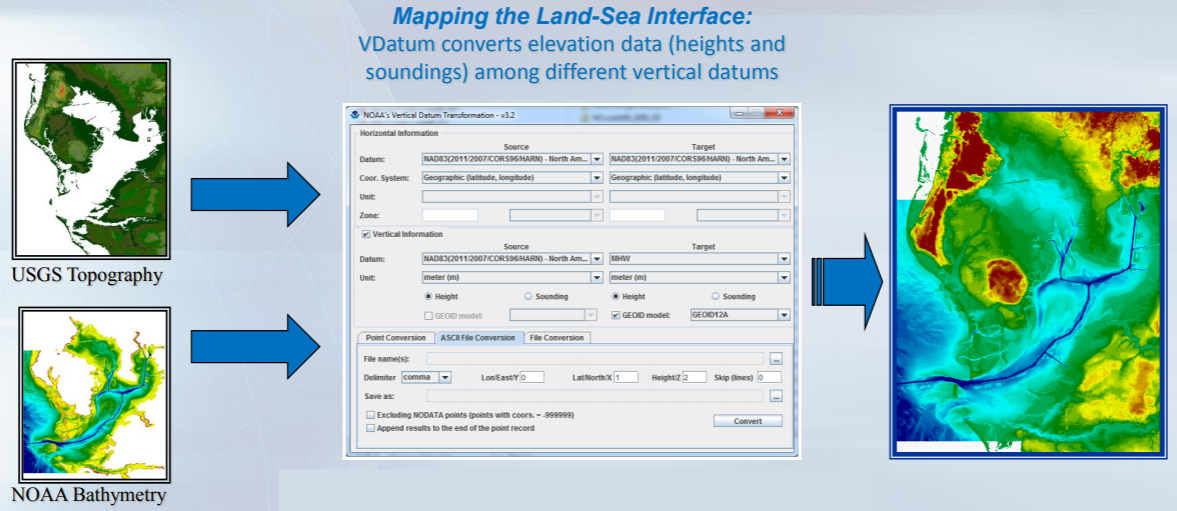
Figure 72. VDatum user interface and examples.
Tide Predictions: NOAA Tide Predictions allows users of the Tides and Currents website (http://tidesandcurrents.noaa.gov) to generate tide predictions for up to 2 years in the past or future, at any of 3000+ locations around the United States. This website service provides both a graphical plot of the predictions as well as a tabular listing and printable pages.
Tide predictions can only be accurately predicted at a location where tide data has been collected and analyzed. There are more than 3000 locations available through the NOAA Tide Predictions service. If you know that a station is available, you may use the search box to provide the station name or 7-digit ID number to retrieve predictions for the station. Otherwise you may search for a station from the map interface or the station listing.
Tide predictions are provided for two “classifications” of stations - Harmonic and Subordinate.
Harmonic stations are stations with tidal harmonic constants and tidal datums. Tide predictions for harmonic stations are generated directly from the harmonic constants. Harmonic stations have the greatest capabilities within the NOAA Tide Predictions service for providing predictions with different data intervals and relative to different tidal datums. These capabilities are controlled within the interface.
Subordinate stations are historic stations which do not have tidal harmonic constants available. Tide predictions for subordinate stations are generated by first generating high/low tide predictions for a designated harmonic station, called the “reference station”; then time and height adjustments are applied to correct the high/low predictions to the tidal conditions at the subordinate station. Subordinate stations only allow for the generation of high/low tide predictions, and heights will be relative to Mean Lower Low Water (MLLW), the standard chart datum for the U.S. coastline.
Once a station is selected, the system provides the tide predictions for the current day and the following day. Users can control the predictions to be generated by the system based on selected date(s), time zone, and units of measure.
Additional advanced capabilities allow the user to further customize the prediction based on datum, time interval, time units, and threshold. .
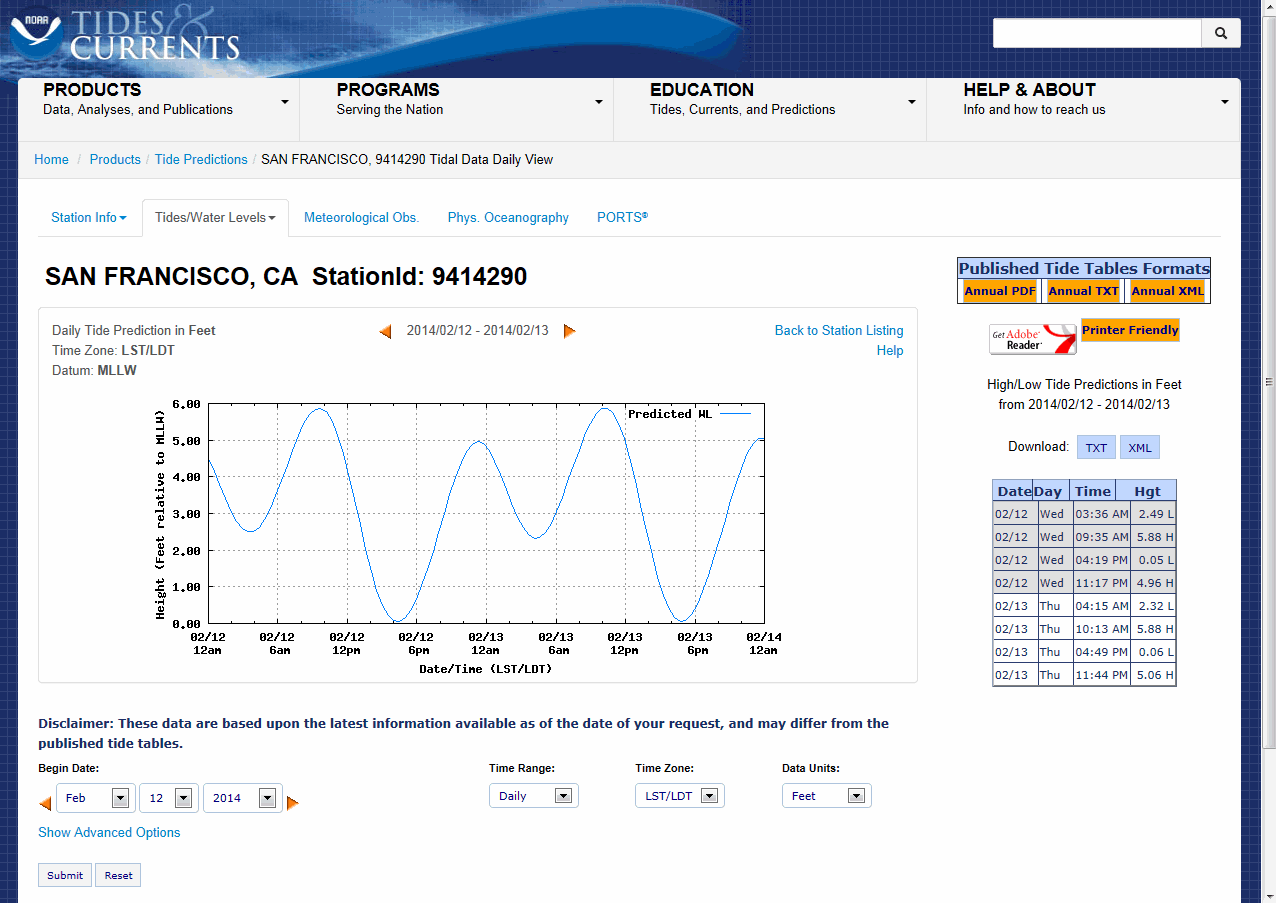
Figure 73. Daily tide prediction for San Francisco, CA, from NOAA's Tide Predictions website.
Tidal Constituent and Residual Interpolation (TCARI): TCARI is a quick, accurate method of providing tidal corrections to hydrographic data. TCARI works by separating the astronomic tide, residual, and datum difference components and treating them differently. First, the method spatially interpolates each tidal constituent's amplitude and phase throughout the region, based on data at the water level stations and makes a tidal prediction. The amplitude and phase of constituents at water level stations must have been previously determined by analysis of historical records. This predicted tide is then added to the residual component, which is computed by spatially interpolating the non-tidal values observed at the water level stations at the time of the survey. Finally, the datum offset, or difference between MSL and MLLW based on historical data, is interpolated throughout the region and added to the prediction.
All spatial interpolation is performed by a set of weighting functions. The weighting functions are computed before the survey by creating a grid mesh for the coastal region of interest and acquiring the historical data. Next, the weighting functions for the harmonic constants, tidal datums, and the residual are computed. In the field, a prediction of the instantaneous tide, relative to MLLW, is made using the stored weighting function, datum fields, and harmonic constants as well as observed water levels at the tide stations. The predicted value is subtracted from the sounding to give the water depth relative to chart datum of MLLW.
Figure 74. Predicted instantaneous water leveling of the central Chesapeake Bay relative to MLLW using TCARI.
FAQ #25: What geospatial data types could be integrated with inland bathymetric data?
Aerial or Satellite Imagery: Aerial or satellite imagery can be integrated with inland bathymetric data to display 2D imagery in a 3D perspective.
Geologic and/or seismic data: Geologic features such as seismic faults can be integrated with inland bathymetric data to display how such features are coincident.
Official shoreline data: Official shorelines for the US Great Lakes, for example, could be integrated with inland bathymetric data. It is also possible to compare current shorelines with historic shorelines of the past, or to show change rates.
Land use/land cover (LU/LC) data: LU/LC data can be integrated with inland bathymetric data to show that inland bathymetry has the correct LU/LC classification.
Wetland data: Wetlands can be delineated using color infrared imagery and inland bathymetry.
Inland surface water features: Inland surface water features such as lakes and ponds, streams and rivers, canals and reservoirs can be identified from inland bathymetry so that each feature has a name and/or feature identification code.
Bridge data: Bridge data can be integrated with inland bathymetric data and attributed with feature identification codes in a GIS.
Landmark features: Landmark features such as reference points or waypoints for safety of navigation on inland waterways can either be identified from or integrated with inland bathymetric data.
Cultural resources: Cultural features such as inundated archaeological sites, historical shipwrecks, sacred Indian fishing grounds can either be identified from or integrated with inland bathymetric data
Coastal and riverine structures: Shoreline stabilization structures, levees, dams, jetties, piers, weirs, etc. can either be identified from or integrated with inland bathymetric data for 3D visualization.
FAQ #26: What are the Marine Sanctuaries and Marine National Monuments, and where are they?
On October 23, 1972, Congress passed the Marine Protection, Research and Sanctuaries Act which, among other things, established the National Marine Sanctuary Program. Title III of the law was later renamed the National Marine Sanctuaries Act (NMSA). The Office of National Marine Sanctuaries serves as the trustee for this network of underwater parks encompassing more than 600,000 square miles of marine and Great Lakes waters from Washington State to the Florida Keys, and from Lake Huron to American Samoa. The network includes a system of 13 national marine sanctuaries and Papahānaumokuākea and Rose Atoll marine national monuments. The graphic in Figure 75 depicts the locations and names of the US National Marine Sanctuaries and Marine National Monuments. Geographical extents for each marine sanctuary can be downloaded from: https://sanctuaries.noaa.gov/library/imast_gis.html.
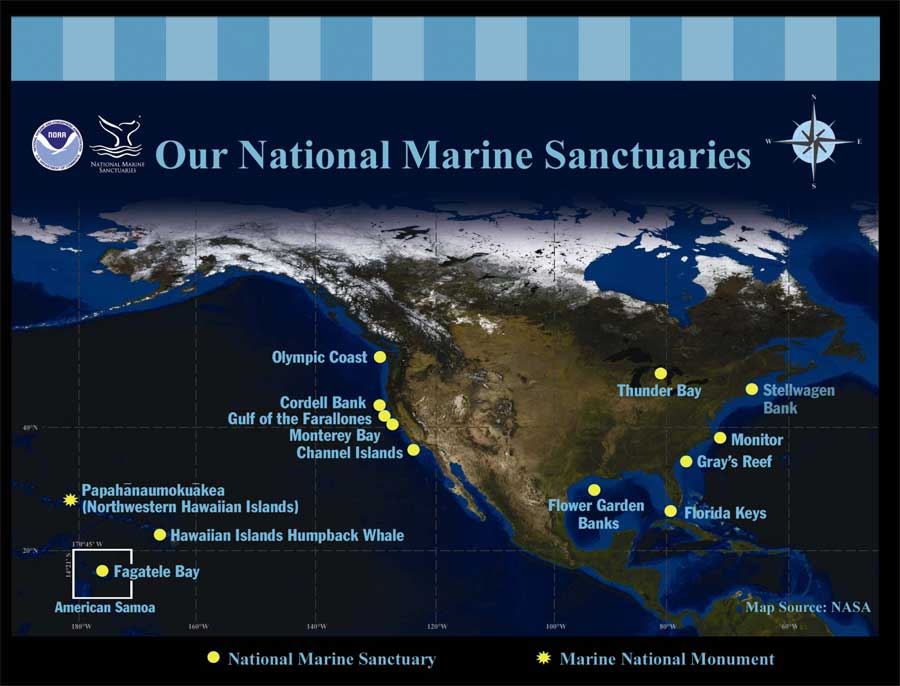
Figure 75. Locations of national marine sanctuaries and marine national monuments.
FAQ #27: What are maritime boundaries and how are they defined?
The maritime zones recognized under international law include internal waters, the territorial sea, the contiguous zone, the exclusive economic zone, the continental shelf, the high seas and the Area. With the exception of the high seas and the Area, each of these maritime zones is measured from the baseline determined in accordance with customary international law as reflected in the 1982 Law of the Sea Convention (UNCLOS). The limits of these zones are officially depicted on NOAA nautical charts. The limits shown on the most recent chart edition takes precedence. The boundaries of these maritime zones between coastal nations are established through international agreements entered into by those nations. For the official description of the U.S. maritime boundaries with other nations contact the U.S. Department of State.
Figure 76 shows how different states use different vertical datums to define the boundary line between privately-owned and state-owned lands. This graphic also shows how other boundaries are determined for the territorial sea, Exclusive Economic Zone (EEZ), contiguous zone, and high seas.

Figure 76. The official sea level boundaries differ by coastal state
State Waters: The seaward boundary of the Great Lake States is the U.S.-Canada International boundary. For most other states it is the 3 nautical mile territorial sea. Exceptions include Florida, whose Gulf of Mexico seaward boundary extends to 9 nautical miles; and Puerto Rico and Texas, whose seaward boundaries extends to 9 nautical miles.
Internal state waters are the waters on the landward side of the baseline from which the breadth of the territorial sea is measured. Each coastal State has full sovereignty over its internal waters as if they were part of its land territory. Examples of internal waters include bays, rivers and even lakes that are connected to the sea, e.g., the Great Lakes.
Federal Waters: In most places, Federal waters extend from where state waters end out to about 200 nautical miles or to where other country’s waters begin.
Navigationally Significant Areas: NOAA prioritizes areas in need of surveying to maximize limited resources. In the 1990s, the agency examined the 3.4 million square nautical miles (SNM) of the U.S. Exclusive Economic Zone (EEZ) for navigational significance. Navigational significance was determined using information about vessel traffic by vessel type, tracklines, vessel draft vs. water depth, and vessel volume. NOAA determined that approximately 500,000 SNM of the EEZ are navigationally significant. Navigationally significant area can be classified as critical area, priority 1, priority 2, priority 3, priority 4, and priority 5 as defined by the National Hydrographic Survey Priorities.
Territorial Sea: Each coastal State may claim a territorial sea that extends seaward up to 12 nautical miles (nm) from its baselines. Generally speaking, the normal baseline is the low-water line along the coast as marked on large-scale charts officially recognized by the coastal State. The coastal State exercises sovereignty over its territorial sea, the air space above it, and the seabed and subsoil beneath it. Foreign flag ships enjoy the right of innocent passage while transiting the territorial sea subject to laws and regulations adopted by the coastal State that are in conformity with the Law of the Sea Convention and other rules of international law relating to such passage. The U.S. claimed a 12 nautical mile territorial sea in 1988.
Contiguous Zone: Each coastal State may claim a contiguous zone adjacent to and beyond its territorial sea that extends seaward up to 24 nautical miles from its baselines. In its contiguous zone, a coastal State may exercise the control necessary to prevent the infringement of its customs, fiscal, immigration or sanitary laws and regulations within its territory or territorial sea, and punish infringement of those laws and regulations committed within its territory or territorial sea. Additionally, in order to control trafficking in archaeological and historical objects found at sea, a coastal State may presume that their removal from the seabed of the contiguous zone without its consent is unlawful.
Outer Continental Shelf (OCS): Defined in Title 43 of United States Code by Outer Continental Shelf Lands Act 1953. The seaward limit is defined as the farthest of 200 nautical miles seaward of the baseline from which the breadth of the territorial sea is measured or, if the continental shelf can be shown to exceed 200 nautical miles, a distance not greater than a line 100 nautical miles from the 2,500-meter isobath or a line 350 nautical miles from the baseline.
Outer Continental Shelf limits greater than 200 nautical miles but less than either the 2,500 meter isobath plus 100 nautical miles or 350 nautical miles are defined by a line 60 nautical miles seaward of the foot of the continental slope or by a line seaward of the foot of the continental slope connecting points where the sediment thickness divided by the distance to the foot of the slope equals 0.01, whichever is farthest.
Exclusive Economic Zone: Each coastal State may claim an Exclusive Economic Zone (EEZ) beyond and adjacent to its territorial sea that extends seaward up to 200 nautical miles from its baselines (or out to a maritime boundary with another coastal State). Within its EEZ, a coastal State has: (a) sovereign rights for the purpose of exploring, exploiting, conserving and managing natural resources, whether living or nonliving, of the seabed and subsoil and the superjacent waters and with regard to other activities for the economic exploitation and exploration of the zone, such as the production of energy from the water, currents and winds; (b) jurisdiction as provided for in international law with regard to the establishment and use of artificial islands, installations, and structures, marine scientific research, and the protection and preservation of the marine environment, and (c) other rights and duties provided for under international law. The U.S. claimed a 200 nautical mile EEZ in 1983.

.
FAQ #28: What is tide correction and why is it necessary?
Measurements of bathymetry and water depth inherently rely on a defined value of the water surface. Correcting for tide is when offset values are applied to bathymetry data based on the current level of tide during acquisition. In applying these tidal correctors, the bathymetry data is adjusted to represent the depth below the surface of the water at the datum used. A datum is the defined value for the surface, see FAQ #9. Any bathymetry data referenced to inland elevation models or seamless topography will need to be tide corrected.
Tidal corrections can be acquired via predicted tidal models, measured tidal data concurrent with the time of bathymetry acquisition, or using a separation model between another datum (such as VDATUM). Datums used to define the surface of the water include: Mean High Water (MHW), Mean Sea Level (MSL), Mean Low Water (MLW), and Mean Lower Low Water (MLLW). See FAQ#9.
FAQ #29: What other geospatial data types could be integrated with nearshore or offshore bathymetry?
Hydrographic Survey Data: Bathymetric data and associated features intended to update nautical chart products. Generally conforms to International Hydrographic Organization or NOAA standards.
Nautical and/or navigation charts: Products intended for use in safe navigation of ocean and sea-going vessels.
Acoustic imagery of the seafloor: Imagery of the seafloor created based on the intensity of acoustic sonar returns. Imagery is typically a georeferenced raster product that depicts intensity as the value.
Aerial and/or satellite imagery: Imagery of the seafloor supplied by aerial and satellite based sensors in areas where the optical properties of the water are clear enough.
Underwater videography: Video or photographs taken by a submerged camera. Typically used to visualize the seafloor, submerged objects, or underwater biology.
Bottom Texture: Similar to bottom type, but focuses largely on the grain size, sediment type, hardness and roughness characteristics that influence acoustic returns.
Bottom Type: roughness and hardness, sediment type, density, grain size, color, contaminants, composition (organic, shell and mineral, sand percentage)
Submerged features: including shipwrecks, archaeological sites, rock outcrops, debris, pipelines, cables, wellheads, piles,
Subbottom Characteristics: Properties of the seafloor located beneath the surface layer of the seafloor. The top layer of the seafloor is typically returned by most multibeam or singlebeam sonars designed to measure the water depth. Subbottom characteristics may include rock layers beneath sand, changes in rock layers, and other geologic characteristics.
Geologic and/or Seismic Data: Subbottom data that predominantly focuses on the geological construction of the seafloor and any factors that influence seismology of the area. Also of use for oil and gas exploration.
Water Column Properties - Physical Properties: The physical characteristics in the water mass between the sensor and the seafloor. Properties such as temperature, optical clarity, and turbidity
Water Column Properties - Chemical Properties: Chemical characteristics in the water mass between the sensor and the seafloor. Properties such as acidity, dissolved oxygen, and salinity.
Water Column Properties - Biological Properties: Biological elements in the water mass between the sensor and the seafloor. Properties such as specimen type, density, and mass.
Currents: The direction and magnitude of movement of water bodies.
Tide: The vertical change in water level associated due to lunar and solar influence.
Sea Ice Conditions: Location and extent of sea ice. May include extents measured concurrently with mapping operations, experienced over a season, or over a long term time series.
Habitat Distribution and Classification: Similarly to Land Use/Land Cover, ocean and seabed can be classified based on habitat, sediment or bottom type, and utilization. Classifications systems such as CMECS assist with values and guidelines for these geospatial delineations.
Boundaries: Offshore boundaries include the Exclusive Economic Zone (EEZ), continental shelf, marine sanctuaries and parks, Coastal Barrier Resources System (CBRS), archaeological and historic properties, and boundaries of restricted areas.
Routes: Transportation routes in open water include shipping, ferries, and other vessel traffic routes.
Lease Areas: The Bureau of Ocean Energy Management (BOEM) is responsible for all Outer Continental Shelf (OCS) leasing policy and program development issues for oil, gas, and other marine minerals.
The Marine Minerals Program partners with communities to address serious erosion along the Nation’s coastal beaches, dunes, barrier islands, and wetlands. Erosion affects natural resources, energy, defense, public infrastructure, and tourism. To help address this problem, the MMP leases sand, gravel and/or shell resources from federal waters on the Outer Continental Shelf for shore protection, beach nourishment, and wetlands restoration with vigorous safety and environmental oversight.
BOEM is the only federal agency with the authority to lease marine minerals from the OCS, including responding to commercial requests for OCS minerals such as gold, manganese, or other hard minerals.
Sediment resources on the OCS are leased to local communities or federal agencies to help them restore shorelines or wetlands in an effort to address chronic erosion, sea level rise, impacts from major storms, or to protect valuable infrastructure and habitat.

Figure 77. Official Protraction Diagrams (OPDs) and Lease Maps show the OCS block grids and other boundaries for a given area.
Fixed Obstructions: Fixed obstructions include aids to navigation, beacons, landmarks, wind turbines, and drilling platforms and equipment.
Floating Observation and Navigation Systems: Floating observation and navigation systems include buoys, monitoring stations, etc.
Land Use/Land Cover (LU/LC): LU/LC data can be used in conjunction with nearshore bathymetric data to identify areas that contribute to runoff, or other ecological impacts to water quality.
Wetlands: Wetlands can be delineated using color infrared imagery and nearshore bathymetry.
Estuaries: Estuaries and their surrounding wetlands are bodies of water usually found where rivers meet the sea. Estuaries are home to unique plant and animal communities that have adapted to brackish water—a mixture of fresh water draining from the land and salty seawater. Estuaries are among the most productive ecosystems in the world. Many animals rely on estuaries for food, places to breed, and migration stopovers.
FAQ #30: How are IHO Orders defined by the International Hydrographic Office (IHO)?
IHO Special Order: This is the most rigorous of the orders and its use is intended only for those areas where under-keel clearance is critical. Because under-keel clearance is critical, a full sea floor search is required and the size of the features to be detected by this search is deliberately kept small (1m size or larger). Because under-keel clearance is critical, it is considered unlikely that Special Order surveys will be conducted in waters deeper than 40 meters. Examples of areas that may warrant Special Order surveys are: berthing areas, harbors, and critical areas of shipping channels. The Total Horizontal Uncertainty (THU) at the 95% confidence level is 2m or better, and the Total Vertical Uncertainty (TVU) at the 95% confidence level varies from 25 cm on the surface to 29.2 cm at a depth of 20 meters.
IHO Order 1a: This order is intended for those areas where the sea is sufficiently shallow to allow natural or man-made features on the seabed to be a concern to the type of surface shipping expected to transit the area but where the under-keel clearance is less critical than for Special Order. Because man-made or natural features may exist that are of concern to surface shipping, a full sea floor search is required; however the size of the feature to be detected is larger (2m) than for Special Order. Order 1a surveys are of the second highest accuracy for selected harbors, harbor approach channels, recommended tracks, and some coastal areas. The Total Horizontal Uncertainty (THU) at the 95% confidence level is 5m + 5% of depth, and the Total Vertical Uncertainty (TVU) at the 95% confidence level varies from 30 cm on the surface to 39.7 cm at a depth of 20 meters.
IHO Order 1b: This order is intended for areas shallower than 100 meters where a general depiction of the seabed is considered adequate for the type of surface shipping expected to transit the area. A full sea floor search is not required which means some features may be missed although the maximum permissible line spacing will limit the size of the features that are likely to remain undetected. This order of survey is only recommended where under-keel clearance is not considered to be an issue. An example would be an area where the seabed characteristics are such that the likelihood of there being a man-made or natural feature on the seafloor that will endanger the type of surface vessel expected to navigate the area is low. The Total Horizontal Uncertainty (THU) at the 95% confidence level is 5m + 5% of depth, and the Total Vertical Uncertainty (TVU) at the 95% confidence level varies from 30 cm on the surface to 39.7 cm at a depth of 20 meters.
IHO Order 2: This is the least stringent order and is intended for those areas where the depth of water is such that a general depiction of the seabed is considered adequate. A full sea floor search is not required. It is recommended that Order 2 surveys are limited to areas deeper than 100 meters as once the water depth exceeds 100 meters, the existence of man-made or natural features that are large enough to impact on surface navigation and yet still remain undetected by an Order 2 survey is considered to be unlikely. The Total Horizontal Uncertainty (THU) at the 95% confidence level is 20m + 10% of depth, and the Total Vertical Uncertainty (TVU) at the 95% confidence level varies from 50 cm on the surface to 56.4 cm at a depth of 20 meters.
FAQ #31: What derivatives are typically produced by users from standard 3DEP deliverables?
Triangulated Irregular Network (TIN): Derived from point cloud data, a TIN is a set of adjacent, non-overlapping triangles computed from mass points and/or breaklines. Figure 78 shows how the TIN was generated from the mass points and breaklines in Figure 79. The TIN’s vector data structure is based on irregularly-spaced point, line and polygon data interpreted as mass points and breaklines and stores the topological relationship between triangles and their adjacent neighbors.
|
|
Figure 78. Example mass points and breaklines |
Figure 79. TIN produced from these mass points and breaklines |
Contours: Both contours and hillshades are derivative products that help users visualize the terrain in three dimensions. Contours have traditionally been produced from aerial photogrammetry but today they are more cost-effectively produced from lidar.
Contour lines are isolines that depict equal elevation on a surface. They are primarily used for 2D human interpretation of the 3D terrain surface. Figure 80 shows a contour map with 2’ contour interval, meaning that the RMSEz should be ≤8” (one third the contour interval). With modern GIS technology, contours can be generated with the push of a button from lidar datasets, but users can be easily misled if the contour interval is less than three times RMSEz making the contours appear to be more accurate than they really are. |
|
Figure 80. This is an example of a contour map with 2’ contour interval, with index contours at 10’ intervals. |
Hillshades: Hillshades, or shaded relief maps, with either grey-scale or colored elevation ramps are used to create an illuminated representation of the surface, using a hypothetical light source to enhance terrain visualization effects. In Figure 81, the hypothetical light is from the southwest (lower left corner). For many users, hillshades have replaced contour lines as the best way to visualize 3D topographic surfaces. Hillshade viewing angles and sun angles can be varied to maximize visual interpretability of terrain. |
|
Figure 81. Hillshade map example. |
|
Slope Maps: Slope maps are used for many environmental and engineering applications, including hydrologic and hydraulic modeling, erosion control, and soils mapping. Slope is the measure of change in elevation over distance, expressed either in degrees or as a percent. For example, a rise of 4 meters over a distance of 100 meters describes a slope of 2.3⁰ or 4%. The maximum slope in the map in Figure 82 is about 85%. |
|
Figure 82. Slope map example. |
|
Aspect Maps: Also used for many environmental and engineering applications, aspect is the slope direction of steepest gradient with respect to points of a compass, measured clockwise in degrees from due north. The value of each location in an aspect dataset indicates the direction the surface slope faces. The example in Figure 83 is of the same terrain as shown in Figures 81 and 82. |
|
Figure 83. Aspect map example. |
|
Curvature Maps: Usually derived from DEMs, curvature maps are key to numerous conservation activities, including soil and wetland mapping, because they model surface flow paths (see Figure 84) and soil wetness, for example. There are many types of curvature maps, including plan form curvature, profile curvature and tangential curvature. |
|
Figure 84. Types of curvature surface flow paths. |
|
Cross-Sections: Cross sections (also called profiles) are commonly “cut” through lidar point clouds or elevation surfaces in order to visualize or measure heights or elevation differences along the path of the profile. Figure 85 shows an example of a lidar profile cut across a river, to include elevation data on a bridge as well as elevations of bare-earth terrain, vegetation and buildings on either side of the river. Cross sections are profiles that are normally generated perpendicular to linear features such as roads and streams. |
|
Figure 85. Lidar profile (top) showing elevations along the transect (bottom) that crosses the river and bridge. |
|
Height-Above-Ground Maps: Commonly used for determining timber metrics, height-above-ground maps, also known as elevation difference maps and normalized DSM (or nDSM), are produced by subtracting the DEM from the DSM. In Figure 86, the original DEM is much higher on the right of this image, including a building on the hill top, but this elevation difference map normalizes the surfaces to determine which trees are taller when considering the terrain to be totally flat. |
|
Figure 86. Height-above-ground map where heights of trees (and building) are normalized. |
|
Viewshed Maps: Viewshed maps, also known as intervisibility or line-of-sight maps, are popularly used by military terrain analysts to determine what can be seen, or not seen, from friendly or enemy positions. Figure 87 (courtesy of the USGS) shows areas in direct line-of-site from the top of a 9.5-foot antenna and areas obscured from such intervisibility. The height of the tower can be virtually elevated to see changing results. Architects use viewshed maps for site selection and design, and real estate agents use them to advertise scenic views. |
|
Figure 87. Viewshed map showing what can be seen (red) and not seen (green) from an antenna 9.5 feet tall. |
|
Flow Direction Grids. The grid shown in Figure 88 describes the direction of flow
from each pixel to its steepest downslope neighbor. Each cell is
assigned a code (value) that defines the direction water will flow
from the cell. There are eight possible flow directions: east (1),
southeast (2), south (4), southwest (8), west (16), northwest (32)
north (64), and northeast (128). |
Figure 88. Example of a flow direction grid with arrows to indicate flow of water. |
Flow Accumulation Grids. Represents the number of upstream cells that flow to a specific cell. Flow accumulation grids are often used to define stream networks. At some threshold, representing some upslope contributing, cells are considered to be stream channels. |
Figure 89. Stream channels derived from a flow accumulation grid. Most of the cells (shown in gray) have relatively small upslope contributing areas, while cells shown in yellow, blue, and red have significantly larger contributing areas, and are identified as stream channels. . |
Hydrologic networks (e.g. streams, lakes). The hydrologic network is the set of creeks, streams, and rivers that route flow across the land surface within a defined channel. In some cases the network may include impoundments, such as lakes and ponds, through which water flows.
|
Figure 90.Hydrologic Units and stream networks delineated from an elevation model. Hillshading has been added to show the underlying terrain. |
Hydrologic Units (Watershed Boundaries) A hydrologic unit represents all or some portion of the areal extent of surface water drainage to a point, accounting for all land and surface areas. Hydrologic units are selected on the basis of topographic information and are determined solely upon science-based hydrologic principles, not favoring any administrative boundaries or special projects, nor particular program or agency. |
Figure 91. Progression of development of a Hydrologic Unit. |
Building Footprints. 2-D footprints have x/y coordinates only whereas 3-D footprints have x/y/z coordinates and typically show the highest elevation of any feature on the rooftop. Digital orthophotos are sometimes used to digitize 2-D building footprints but the building positions are distorted because of “building lean” from elevated features, often causing roofs to appear to overlay sidewalks and streets. Positionally accurate 3-D building footprints have long been compiled from stereo photogrammetry. 2-D or 3-D building footprints can also be derived from lidar datasets; the process is semi-automated but requires additional processing to create smooth roofline edges as shown with red outlines in Figure 92. |
Figure 92. Building footprints from lidar. This image is color-coded by elevation |
Breaklines for road edge-of-pavement: As shown in Figure 93, it is common to digitize either 2-D or 3-D breaklines for road edge-of-pavement from either imagery or from lidar. Road breaklines are used in cartography to visualize urban environments by distinguishing between narrow alleys and major city streets. Road breaklines are also used to map the area of impervious surfaces, which is used to model stormwater runoff for flood and water quality studies. Breaklines are used to map road grading and to identify pavement edge-drop off for planning road maintenance activities.
|
Figure 93. Edge-of-pavement breaklines can be digitized from orthoimagery (2-D), from stereo image compilation (3-D), or from lidar (3-D breaklines) |
Rugosity/Surface Roughness: Rugosity is an indicator of the complexity of a surface. In the marine environment rugosity is an important ecological parameter for fish, corals, and algae. In earth science, surface roughness is used to help identify - and subsequently study the processes acting upon - landforms. |
Figure 94. Healthy staghorn coral (Acropora cervicornis) thicket, Dry Tortugas National Park; photo credit: Ilsa B. Kuffner, USGS. or
Figure 95 Oblique onshore view of sea floor characterization map off Puʻukoholā Heiau National Historic Site and Kawaihae Harbor, Hawaiʻi. |
1 From a paper entitled, “Minimum LiDAR Data Density Considerations for the Pacific Northwest,” 01/22/10, by Watershed Sciences, Inc., now part of Quantum Spatial Inc.
2 Although vertical check points are normally not well defined, where feasible, the horizontal accuracy of lidar data sets should be tested by surveying approximately half of all NVA check points at the ends of paint stripes or other point features that are visible and can be measured on lidar intensity returns.
| File Type | application/vnd.openxmlformats-officedocument.wordprocessingml.document |
| File Modified | 0000-00-00 |
| File Created | 0000-00-00 |
© 2026 OMB.report | Privacy Policy


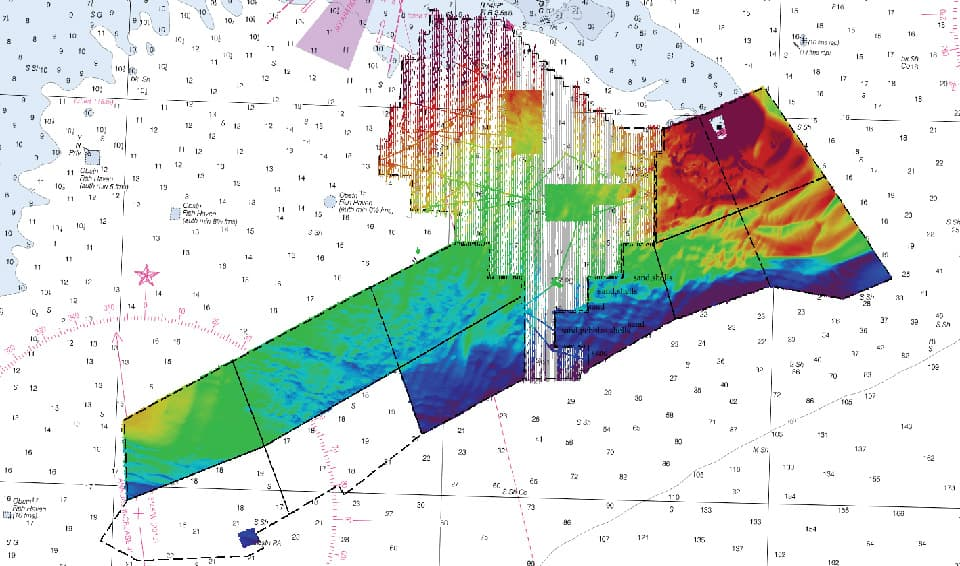
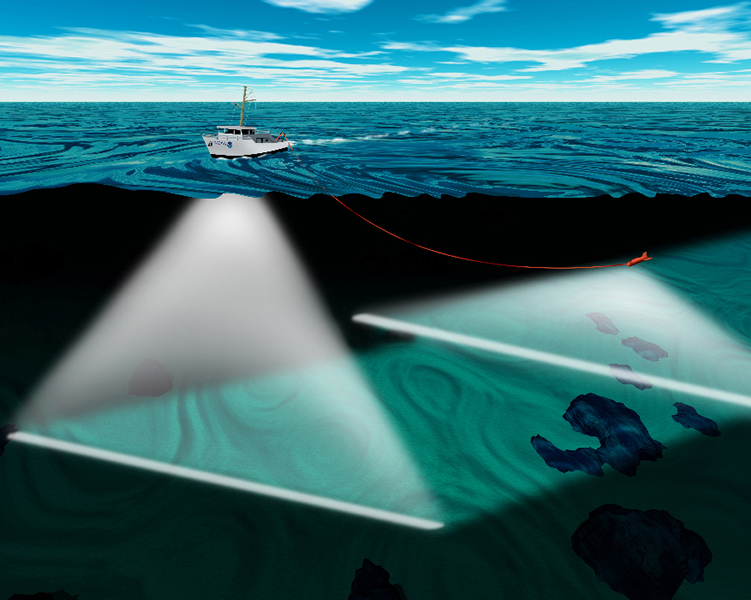

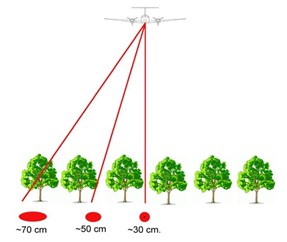 Figure
10. Lidar can map the bare-earth terrain in forests by single
pulses that penetrate between
trees and even through
trees in some instances. The footprint size of each laser pulse
varies by the angle of the scan, as shown here. Normally acquired
in zig-zag patterns, lidar scans are so dense that scan lines are
nearly parallel. Flying higher with a high pulse rate and narrow
left-right scan angle allows a high point density and increased
ability to penetrate dense vegetation by having near-vertical
laser pulses that can better penetrate between trees.
 Figure
11. In spite of dense vegetation shown on this orthophoto in
Florida, lidar data collected at a point density of 4 points/m2
was still able to establish a hydro flow line for the dry drainage
feature beneath.
 Figure
12. Color-coded by 1-foot contour elevation bands, the white
polygons define depression contours that show dry puddles
that should not normally be hydro-enforced (defined below). This
does not necessarily work in mangrove and sawgrass.
