HCAHPS Mode Experiment III
Attachment C - HCAHPS_Mode_Exp_III.doc
National Implementation of Hospital Consumer Assessment of Health Providers and Systems (HCAHPS) (CMS-10102)
HCAHPS Mode Experiment III
OMB: 0938-0981
ATTACHMENT C – HCAHPS MODE EXPERIMENT III
Objectives
For the new Coordination of Care (CoC) composite measure, analyze Mode
Experiment III results for the following:
Patient-mix adjustment to inform how patient sub-groups respond to the new measure.
Potential mode effects for the CoC measure.
Describe how CoC relates to other measures using psychometric analyses.
Analyze the potential effectiveness of new patient-mix adjustment survey items
related to self-rated mental health and emergency room admission.
Table of Contents
|
||
|
||
|
||
|
||
Appendices: |
|
|
|
|
|
Appendix A.1 Descriptive statistics for CoC items and composite, overall and by mode |
|
|
Appendix A.2 Cross tab of CoC items with Survey Mode |
|
|
Appendix A.3 Cross tab of CoC items with Survey Mode, missing included |
|
|
|
|
|
Appendix B.1 Cronbach Alpha and inter-item correlation matrix |
|
|
Appendix B.2 Correlation of linear coded CoC items and composite with other measures |
|
|
Appendix B.3 Correlation of top-box coded CoC items and composite with other measures |
|
|
|
|
|
Appendix C.1 Linear regression models predicting linear coded CoC composite from standard PMA, adding ER admission and/or MHP. |
|
|
Appendix C.2 Linear regression models predicting top-box coded CoC composite from standard PMA, adding ER admission and/or MHP.
|
|
|
Appendix D Mode effects for CoC linear and top-box composite . |
|
|
|
|
|
Appendix E Hospital-level ICC, Spearman correlation and reliability.
|
|
|
Appendix F.1 PMA adjusted mean scores for linearly and top-box scored measures Appendix F.2 Correlation and Informativeness of adjusted mean scores from Model 1 with alternative models
|
|
|
Appendix G Difference in adjusted mean scores from standard PMA Model (Base Model) and each of the alternate Models 2, 3 and 4 Appendix H Mode effects, with and without PMA adjustment Appendix I Mixed effect models with mode and standard PMA as fixed effects, and hospital and hospital by mode as random effects.
|
|
|
ii
APPENDIX A
Descriptive Statistics
METHODS
We produced tables that present descriptive statistics for age, service line, and all survey items for completed surveys overall and by mode. The descriptive statistics include means and simple frequencies. For each survey item, we produced a version of the descriptive statistics that includes percent missing and a version that excludes the missing cases
RESULTS
The mean, standard deviation, and number observed are presented for questions with ordinal response (Appendix A.1). The frequencies, overall and by mode, for the all variables are presented in Appendix A.2 (including percent missing) and A.3 (excluding the missing cases).
After reversing coding, the mean overall health and mental health perceptions on a scale from poor (1) to excellent (5) are 3.15 and 3.77 respectively, which corresponds to good health and very good mental health. More than half (62%) of patients reported having been admitted via the emergency room.
CONCLUSIONS
The distributions of HCAHPS items are as expected, with the exception that self-reported emergency room admission rates notably exceeded the rates seen for the administrative measures of emergency room admission, which was nearer to 40%.
APPENDIX B
Coordination of Care (CoC)/Transition Items
METHODS
There are three CoC items on a 4-point scale (strongly agree - strongly disagree), but one of the items has a fifth response value (a tailored not applicable) that we treated as missing. We generated two versions of each CoC item: 1) linear mean scoring on a 0-100 scale and b) top-box scoring (top = strongly agree vs. all other except not applicable/missing). We used both the linear and top-box versions of the three CoC items and the CoC composite in all analyses below.
For each of the three CoC items, we generated an inter-item correlation matrix and Cronbach’s Alpha. We also examined the correlation of the CoC composite and each CoC item with each of the 10 reported HCAHPS measures (correlating top-box with top-box and linear with linear).
RESULTS
The mean score for the CoC composite, with 0-100 linear mean scoring, is 80, which is between agree and strongly agree. The top-box proportion (strongly agree) for the CoC composite is 47%.
The inter-item correlations with linear scoring are between 0.50 and 0.65, and the standardized Cronbach’s alphas are 0.82 and 0.80 for the linear and top-box CoC composites, respectively (Appendix B.1). The Pearson and Spearman correlations for linear and top-box CoC composite and items with other HCAHPS measures are presented in Appendices B.2 and B.3, respectively. The Pearson correlations for the linearly scored CoC composite with other linearly scored HCAHPS measures are between 0.3 and 0.5, and slightly lower for the three individual CoC items (highest for Q23-staff took preferences into account and lowest for Q25-understood medications). The Spearman correlations show a similar pattern, and overall are lower than the Pearson correlations. The highest correlation with the linearly scored CoC composite is for recommending hospital (r=0.51) followed by Communication with Nurses (r=0.50), Communication about Medicine (0.49) and Rating of Hospital (0.48).
CONCLUSIONS
The CoC measure shows no evidence of a ceiling effect. The high Cronbach’s alpha suggests that the CoC measure has very good internal consistency reliability. The moderately high association with hospital rating and recommendation are evidence of validity and suggest that patients value good coordination of care. The moderate correlations with other HCAHPS measures indicate that the CoC composite is not redundant with other HCAHPS measures. The strong association of CoC with Communication with Nurses and Communication about Medicine suggests the importance of coordination of care to those domains.
APPENDIX C
Patient-Mix Adjustment (PMA)
METHODS
The purpose of the patient-mix adjustment analyses was to evaluate two new items: ER admission (ERA) and Mental Health Perception (MHP). We compared four sets of models:
Base model that corresponds to current official HCAHPS PMA1 (hospital intercepts plus current PMAs)
Alternate model 1: add ERA to base model
Alternate model 2: add 1df (linear) MHP to the base model
Alternate model 3: add both ERA and MHP to base model
For each patient mix model we ran four versions (one version corresponding to the base model, and three to Alternate Models 1-3) of 22 linear models (11 total outcomes, including the new CoC composite x linear/top-box scoring). We report the coefficients associated with the patient-mix adjusters for all 4 models. The new (candidate) patient-mix adjusters (ERA and MHP) appear on top of the table. We will also examine shifts in current patient-mix adjusters, including general health perception and service line, from the base model to the alternative models (these coefficients appear just below ERA and MHP).
b. RESULTS
For each linear measure the parameter estimates and significance from the four models are presented side-by-side in Appendix C.1. Similarly, the results for the top-box measures are presented in Appendix C.2. Regardless of linear or top-box coding, MHP is significant for all measures in both Models 2 and 3. In all instances the MHP coefficient indicates more positive experiences with better MHP. In contrast, ER admission alone or in combination with MHP is significant for only 3 (doctor communication, discharge info, CoC) of the 11 linear measures and 2 (doctor communication and discharge info) of the 11 top-box measures. In all of these instances the coefficient for ERA was negative, indicating less positive experiences for those admitted through the ER.
c. CONCLUSIONS
The associations of MHP and ERA with HCAHPS items are in the direction expected. Future research will inform the advisability of these items as patient-mix adjustors.
APPENDIX D
Mode Analyses
METHODS
We estimated a base series of models. Each model predicted CoC outcomes (linear and top-box) from hospital indicator and the three mode indicators (reference=mail mode). This version is not patient-mix adjusted.
RESULTS
The coefficients and significance for three mode indicators (CATI, Mixed, and TT-IVR) versus Mail Only mode are presented in Appendix D.
With respect to the CoC composite, the scores for CATI are significantly higher than Mail Alone mode for both linear and top-box scoring. However, we find no significant differences between IVR and Mixed mode relative to Mail Only mode.
CONCLUSIONS
The mode effect results for CoC are similar to what has been observed previously in Mode Experiment 1.
APPENDIX E
Coordination of Care (CoC)/Transition Items
METHODS
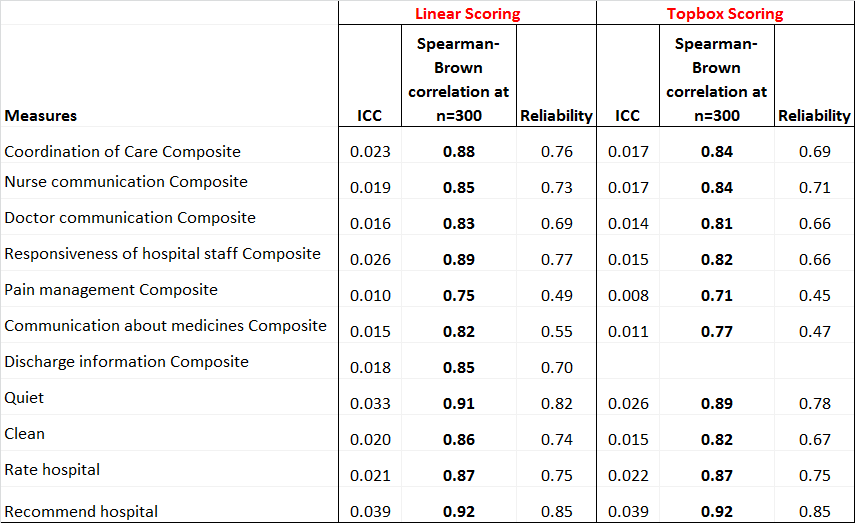
We will calculate the interclass correlation coefficient (ICC) at the hospital-level and Spearman-Brown (hospital-level) reliability of the new potential CoC composite and compare these to the ICCs for the 10 currently reported HCAHPS measures (linear mean and top-box versions of each).
RESULTS
Appendix F presents the ICC and the reliability statistics. ICC measures similarity of patients within a hospital and ranges between 0 and 1 (theoretically negative values are possible). The observed ICC’s (linear and top-box coded) across all measures are very low indicating that patients within hospitals are dissimilar with respect to the eleven HCAHPS measures. The reliabilities (at an average 130 completes) range from poor (<0.50) for Pain Management and Communication about Medicines to high (>0.90) for Quiet and Hospital Recommendation. The estimated Spearman-Brown reliabilities (at n=300) are good ranging between 0.71 and 0.92. The ICC and reliability (including Spearman-Brown Reliability) statistics are consistent across scoring methods (i.e., linear scoring and top-box scoring). The new Coordination of Care measure has ICC and reliability (at n=130) above the median for current HCAHPS measures under both linear and top-box scoring.
CONCLUSIONS
The new CoC measure has psychometric properties as good or better than current HCAHPS measures, having both ICC and reliability (at n=130) above the median with respect to the ten current measures.
APPENDIX F
Part II
a. METHODS
We will generate patient-mix-adjusted scores for each hospital for each of the 4 models, and calculate 1-R^2 where R is the correlation of final adjusted score for the base model with one of the three alternative models.. We will do this for linear and top-box coded versions of each measure. We will table these results by measure (for each of 11 measures).
b. RESULTS
The results are presented in Appendix H. For all measures, the adjusted means across the four models are very similar for both linear and top-box scoring. The adjusted means correlations between Model 1 and each of the alternate Models are very high. The informativeness (1-R²) is less than 1%, which indicates very small added information resulting from the added PMA (ERA and/or MHP). The Communication with Doctors measure (linear and top-box scoring) and Coordination of Care (top-box) show the biggest impact. However, on average the addition of ERA and MHP matter the same amount on measures linearly scored, while MHP matters a little more than ERA on top-box measures.
c. CONCLUSIONS
Overall, ERA and MHP have very little impact on informativeness. Thus, we recommend against addition of either item as a patient-mix adjuster. However, CMS will continue collection of these variables for analysis and oversight purposes.
APPENDIX G
Part III
a. METHODS
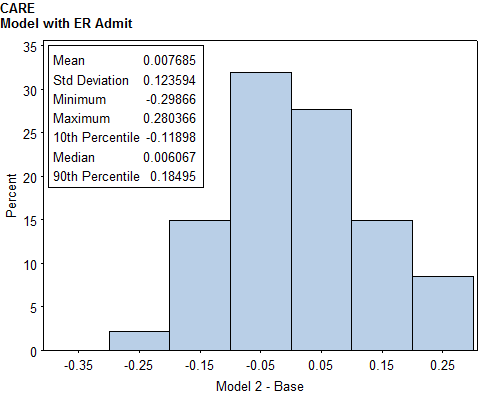
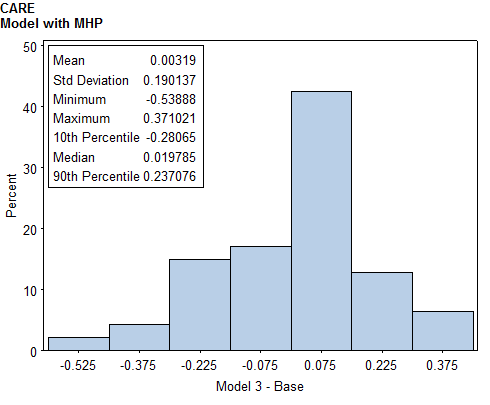
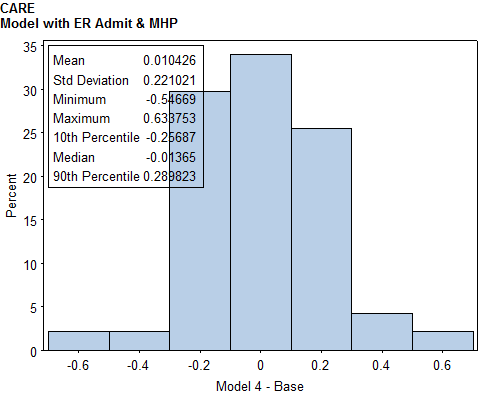
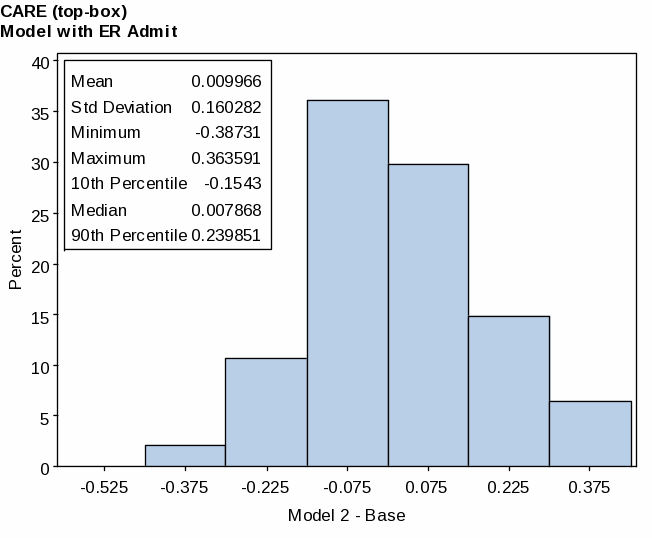
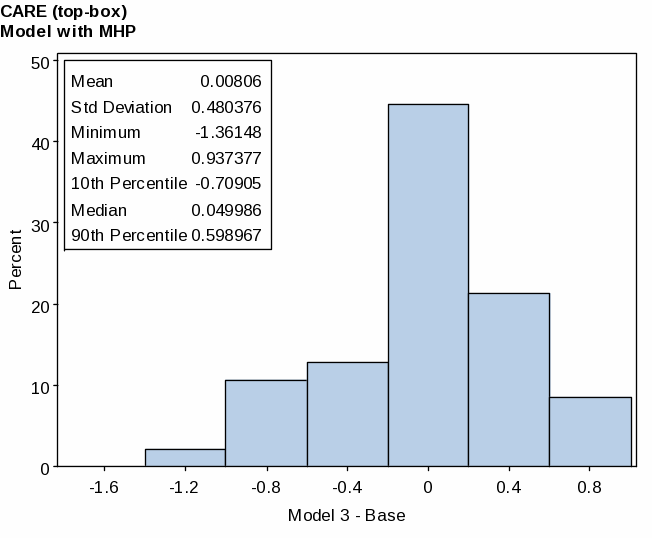
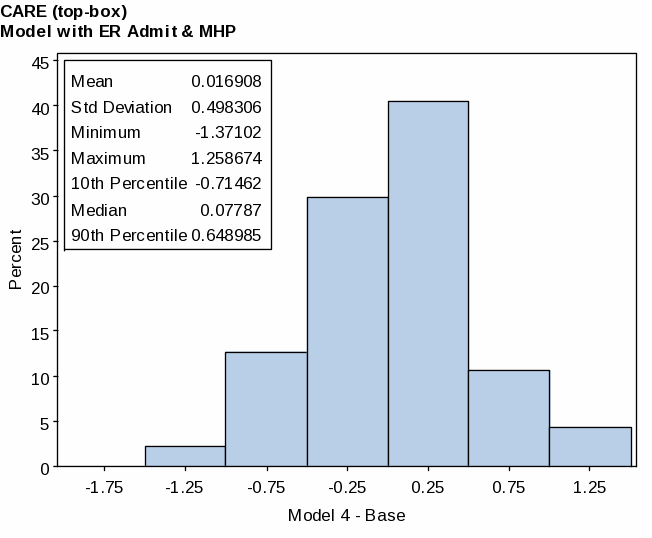
We will produce difference in hospital-level scores under standard PMA model and each of the alternative PMA models. We will show histograms and univariate descriptive statistics of these differences, and list the five hospitals with the biggest gains and losses for each measure, along with mean patient-mix-adjusters for those hospitals.
b. RESULTS
The results are presented in Appendix I. The alternate models have little impact on hospital-level adjusted means. In general, hospitals are effected by less than 1 point with the exception of top-box score Coordination of Care with 1 point on a 0-100 scale.
c. CONCLUSIONS
Overall, ERA and PMA have little effect on hospital scores. Furthermore, there are concerns about the validity of ERA because it is believed to be over-reported by patients, and MHP is moderately correlated with GHP and varies little from hospital to hosptial. For these reasons, we recommend against addition of ERA or MHP as PMA.
APPENDIX H
Mode Effects
Part I
METHODS
We will add patient-mix adjusters to the two base models that predict Coordination of Care outcome (in linear mean and top-box form) from hospital indicator and the three assigned mode indicators (with Mail Only mode as the reference mode). The top-box version of these patient-mix adjusted mode estimates would potentially be used for adjustment.
b. RESULTS
The CATI (phone) mode mode effects are larger for the CoC measure, with and without PMA. These mode effects are larger for top-box scored measures, ranging from 3.13 to 3.50 for with and without PMA, respectively. In contrast, the effects for IVR and Mixed mode are small.
c. CONCLUSIONS
Findings are similar to Mode Experiment I, with CATI having a larger adjustment for the new measure Coordination of Care..
APPENDIX I
METHODS
To evaluate heterogeneity of survey mode affects within hospitals, we will run mixed effect models with mode and standard PMA as fixed effects, hospital and hospital by mode random effects.
RESULTS
Since the interactions of CATI by hospital and Mixed mode by hospital are not significant there is no evidence that modes CATI and Mixed vary much from hospital to hospital with respect to CoC. However, the IVR variance component is significant indicating some variability in IVR mode from hospital to hospital.
Appendices
Appendix A.1
|
|
N |
Mean |
SD |
||||||||||||
|
|
Overall |
CATI |
IVR |
Mixed |
Overall |
CATI |
IVR |
Mixed |
Overall |
CATI |
IVR |
Mixed |
|||
q23 |
Staff took preferences into account in deciding what care needs would be when I left |
6098 |
1661 |
1478 |
1060 |
1899 |
3.27 |
3.32 |
3.25 |
3.19 |
3.29 |
0.71 |
0.65 |
0.71 |
0.78 |
0.70 |
q24 |
When I left the hospital, had good understanding of things I was responsible for managing health |
6256 |
1733 |
1501 |
1064 |
1958 |
3.41 |
3.47 |
3.37 |
3.35 |
3.40 |
0.67 |
0.62 |
0.66 |
0.75 |
0.67 |
q25 |
When I left the hospital, clearly understood the purpose for taking each of my medications |
5233 |
1357 |
1308 |
941 |
1627 |
3.49 |
3.54 |
3.46 |
3.44 |
3.49 |
0.66 |
0.58 |
0.67 |
0.72 |
0.67 |
care |
Coordination of Care Composite (3) |
6304 |
1742 |
1510 |
1071 |
1981 |
79.19 |
80.85 |
78.45 |
77.19 |
79.37 |
19.78 |
17.67 |
20.15 |
22.11 |
19.80 |
care_tb |
Coordination of Care top-box (average of top-box items) |
6304 |
1742 |
1510 |
1071 |
1981 |
47.13 |
48.82 |
45.31 |
45.86 |
47.72 |
42.45 |
41.48 |
43.22 |
42.81 |
42.48 |
Appendix A.2
Table of Q23 by MODE
Q23(Staff took preferences into account in deciding what care needs would be when I left)
MODE(Survey Mode (CATI/Telephone only, Mail, MIXED, TT-IVR)
Frequency ‚
Col Pct ‚CATI ‚Mail ‚TT-IVR ‚MIXED ‚ Total
ƒƒƒƒƒƒƒƒƒƒƒƒƒƒƒƒƒˆƒƒƒƒƒƒƒƒˆƒƒƒƒƒƒƒƒˆƒƒƒƒƒƒƒƒˆƒƒƒƒƒƒƒƒˆ
. ‚ 90 ‚ 87 ‚ 52 ‚ 125 ‚ 354
‚ 5.14 ‚ 5.56 ‚ 4.68 ‚ 6.18 ‚
ƒƒƒƒƒƒƒƒƒƒƒƒƒƒƒƒƒˆƒƒƒƒƒƒƒƒˆƒƒƒƒƒƒƒƒˆƒƒƒƒƒƒƒƒˆƒƒƒƒƒƒƒƒˆ
1 Strongly ‚ 29 ‚ 44 ‚ 49 ‚ 53 ‚ 175
disagree ‚ 1.66 ‚ 2.81 ‚ 4.41 ‚ 2.62 ‚
ƒƒƒƒƒƒƒƒƒƒƒƒƒƒƒƒƒˆƒƒƒƒƒƒƒƒˆƒƒƒƒƒƒƒƒˆƒƒƒƒƒƒƒƒˆƒƒƒƒƒƒƒƒˆ
2 Disagree ‚ 88 ‚ 105 ‚ 96 ‚ 113 ‚ 402
‚ 5.03 ‚ 6.71 ‚ 8.63 ‚ 5.58 ‚
ƒƒƒƒƒƒƒƒƒƒƒƒƒƒƒƒƒˆƒƒƒƒƒƒƒƒˆƒƒƒƒƒƒƒƒˆƒƒƒƒƒƒƒƒˆƒƒƒƒƒƒƒƒˆ
3 Agree ‚ 872 ‚ 773 ‚ 516 ‚ 964 ‚ 3125
‚ 49.80 ‚ 49.39 ‚ 46.40 ‚ 47.63 ‚
ƒƒƒƒƒƒƒƒƒƒƒƒƒƒƒƒƒˆƒƒƒƒƒƒƒƒˆƒƒƒƒƒƒƒƒˆƒƒƒƒƒƒƒƒˆƒƒƒƒƒƒƒƒˆ
4 Strongly agree ‚ 672 ‚ 556 ‚ 399 ‚ 769 ‚ 2396
‚ 38.38 ‚ 35.53 ‚ 35.88 ‚ 37.99 ‚
ƒƒƒƒƒƒƒƒƒƒƒƒƒƒƒƒƒˆƒƒƒƒƒƒƒƒˆƒƒƒƒƒƒƒƒˆƒƒƒƒƒƒƒƒˆƒƒƒƒƒƒƒƒˆ
Total 1751 1565 1112 2024 6452
Table of Q24 by MODE
Q24(When I left the hospital, had good understanding of things I was responsible for
managing health)
MODE(Survey Mode (CATI/Telephone only, Mail, MIXED, TT-IVR)
Frequency ‚
Col Pct ‚CATI ‚Mail ‚TT-IVR ‚MIXED ‚ Total
ƒƒƒƒƒƒƒƒƒƒƒƒƒƒƒƒƒˆƒƒƒƒƒƒƒƒˆƒƒƒƒƒƒƒƒˆƒƒƒƒƒƒƒƒˆƒƒƒƒƒƒƒƒˆ
. ‚ 18 ‚ 64 ‚ 48 ‚ 66 ‚ 196
‚ 1.03 ‚ 4.09 ‚ 4.32 ‚ 3.26 ‚
ƒƒƒƒƒƒƒƒƒƒƒƒƒƒƒƒƒˆƒƒƒƒƒƒƒƒˆƒƒƒƒƒƒƒƒˆƒƒƒƒƒƒƒƒˆƒƒƒƒƒƒƒƒˆ
1 Strongly ‚ 22 ‚ 25 ‚ 38 ‚ 43 ‚ 128
disagree ‚ 1.26 ‚ 1.60 ‚ 3.42 ‚ 2.12 ‚
ƒƒƒƒƒƒƒƒƒƒƒƒƒƒƒƒƒˆƒƒƒƒƒƒƒƒˆƒƒƒƒƒƒƒƒˆƒƒƒƒƒƒƒƒˆƒƒƒƒƒƒƒƒˆ
2 Disagree ‚ 46 ‚ 81 ‚ 61 ‚ 75 ‚ 263
‚ 2.63 ‚ 5.18 ‚ 5.49 ‚ 3.71 ‚
ƒƒƒƒƒƒƒƒƒƒƒƒƒƒƒƒƒˆƒƒƒƒƒƒƒƒˆƒƒƒƒƒƒƒƒˆƒƒƒƒƒƒƒƒˆƒƒƒƒƒƒƒƒˆ
3 Agree ‚ 764 ‚ 706 ‚ 452 ‚ 890 ‚ 2812
‚ 43.63 ‚ 45.11 ‚ 40.65 ‚ 43.97 ‚
ƒƒƒƒƒƒƒƒƒƒƒƒƒƒƒƒƒˆƒƒƒƒƒƒƒƒˆƒƒƒƒƒƒƒƒˆƒƒƒƒƒƒƒƒˆƒƒƒƒƒƒƒƒˆ
4 Strongly agree ‚ 901 ‚ 689 ‚ 513 ‚ 950 ‚ 3053
‚ 51.46 ‚ 44.03 ‚ 46.13 ‚ 46.94 ‚
ƒƒƒƒƒƒƒƒƒƒƒƒƒƒƒƒƒˆƒƒƒƒƒƒƒƒˆƒƒƒƒƒƒƒƒˆƒƒƒƒƒƒƒƒˆƒƒƒƒƒƒƒƒˆ
Total 1751 1565 1112 2024 6452
Table of Q25 by MODE
Q25(When I left the hospital, clearly understood the purpose for taking each of my
medications)
MODE(Survey Mode (CATI/Telephone only, Mail, MIXED, TT-IVR)
Frequency ‚
Col Pct ‚CATI ‚Mail ‚TT-IVR ‚MIXED ‚ Total
ƒƒƒƒƒƒƒƒƒƒƒƒƒƒƒƒƒˆƒƒƒƒƒƒƒƒˆƒƒƒƒƒƒƒƒˆƒƒƒƒƒƒƒƒˆƒƒƒƒƒƒƒƒˆ
. ‚ 38 ‚ 65 ‚ 58 ‚ 64 ‚ 225
‚ 2.17 ‚ 4.15 ‚ 5.22 ‚ 3.16 ‚
ƒƒƒƒƒƒƒƒƒƒƒƒƒƒƒƒƒˆƒƒƒƒƒƒƒƒˆƒƒƒƒƒƒƒƒˆƒƒƒƒƒƒƒƒˆƒƒƒƒƒƒƒƒˆ
Not given meds ‚ 356 ‚ 192 ‚ 113 ‚ 333 ‚ 994
‚ 20.33 ‚ 12.27 ‚ 10.16 ‚ 16.45 ‚
ƒƒƒƒƒƒƒƒƒƒƒƒƒƒƒƒƒˆƒƒƒƒƒƒƒƒˆƒƒƒƒƒƒƒƒˆƒƒƒƒƒƒƒƒˆƒƒƒƒƒƒƒƒˆ
1 Strongly ‚ 14 ‚ 26 ‚ 31 ‚ 39 ‚ 110
disagree ‚ 0.80 ‚ 1.66 ‚ 2.79 ‚ 1.93 ‚
ƒƒƒƒƒƒƒƒƒƒƒƒƒƒƒƒƒˆƒƒƒƒƒƒƒƒˆƒƒƒƒƒƒƒƒˆƒƒƒƒƒƒƒƒˆƒƒƒƒƒƒƒƒˆ
2 Disagree ‚ 19 ‚ 56 ‚ 37 ‚ 46 ‚ 158
‚ 1.09 ‚ 3.58 ‚ 3.33 ‚ 2.27 ‚
ƒƒƒƒƒƒƒƒƒƒƒƒƒƒƒƒƒˆƒƒƒƒƒƒƒƒˆƒƒƒƒƒƒƒƒˆƒƒƒƒƒƒƒƒˆƒƒƒƒƒƒƒƒˆ
3 Agree ‚ 540 ‚ 513 ‚ 364 ‚ 627 ‚ 2044
‚ 30.84 ‚ 32.78 ‚ 32.73 ‚ 30.98 ‚
ƒƒƒƒƒƒƒƒƒƒƒƒƒƒƒƒƒˆƒƒƒƒƒƒƒƒˆƒƒƒƒƒƒƒƒˆƒƒƒƒƒƒƒƒˆƒƒƒƒƒƒƒƒˆ
4 Strongly agree ‚ 784 ‚ 713 ‚ 509 ‚ 915 ‚ 2921
‚ 44.77 ‚ 45.56 ‚ 45.77 ‚ 45.21 ‚
ƒƒƒƒƒƒƒƒƒƒƒƒƒƒƒƒƒˆƒƒƒƒƒƒƒƒˆƒƒƒƒƒƒƒƒˆƒƒƒƒƒƒƒƒˆƒƒƒƒƒƒƒƒˆ
Total 1751 1565 1112 2024 6452
Appendix A.3
Table of Q23 by MODE
Q23(Staff took preferences into account in deciding what care needs would be when I left)
MODE(Survey Mode (CATI/Telephone only, Mail, MIXED, TT-IVR)
Frequency ‚
Col Pct ‚CATI ‚Mail ‚TT-IVR ‚MIXED ‚ Total
ƒƒƒƒƒƒƒƒƒƒƒƒƒƒƒƒƒˆƒƒƒƒƒƒƒƒˆƒƒƒƒƒƒƒƒˆƒƒƒƒƒƒƒƒˆƒƒƒƒƒƒƒƒˆ
1 Strongly ‚ 29 ‚ 44 ‚ 49 ‚ 53 ‚ 175
disagree ‚ 1.75 ‚ 2.98 ‚ 4.62 ‚ 2.79 ‚
ƒƒƒƒƒƒƒƒƒƒƒƒƒƒƒƒƒˆƒƒƒƒƒƒƒƒˆƒƒƒƒƒƒƒƒˆƒƒƒƒƒƒƒƒˆƒƒƒƒƒƒƒƒˆ
2 Disagree ‚ 88 ‚ 105 ‚ 96 ‚ 113 ‚ 402
‚ 5.30 ‚ 7.10 ‚ 9.06 ‚ 5.95 ‚
ƒƒƒƒƒƒƒƒƒƒƒƒƒƒƒƒƒˆƒƒƒƒƒƒƒƒˆƒƒƒƒƒƒƒƒˆƒƒƒƒƒƒƒƒˆƒƒƒƒƒƒƒƒˆ
3 Agree ‚ 872 ‚ 773 ‚ 516 ‚ 964 ‚ 3125
‚ 52.50 ‚ 52.30 ‚ 48.68 ‚ 50.76 ‚
ƒƒƒƒƒƒƒƒƒƒƒƒƒƒƒƒƒˆƒƒƒƒƒƒƒƒˆƒƒƒƒƒƒƒƒˆƒƒƒƒƒƒƒƒˆƒƒƒƒƒƒƒƒˆ
4 Strongly agree ‚ 672 ‚ 556 ‚ 399 ‚ 769 ‚ 2396
‚ 40.46 ‚ 37.62 ‚ 37.64 ‚ 40.49 ‚
ƒƒƒƒƒƒƒƒƒƒƒƒƒƒƒƒƒˆƒƒƒƒƒƒƒƒˆƒƒƒƒƒƒƒƒˆƒƒƒƒƒƒƒƒˆƒƒƒƒƒƒƒƒˆ
Total 1661 1478 1060 1899 6098
Frequency Missing = 354
Table of Q24 by MODE
Q24(When I left the hospital, had good understanding of things I was responsible for
managing health)
MODE(Survey Mode (CATI/Telephone only, Mail, MIXED, TT-IVR)
Frequency ‚
Col Pct ‚CATI ‚Mail ‚TT-IVR ‚MIXED ‚ Total
ƒƒƒƒƒƒƒƒƒƒƒƒƒƒƒƒƒˆƒƒƒƒƒƒƒƒˆƒƒƒƒƒƒƒƒˆƒƒƒƒƒƒƒƒˆƒƒƒƒƒƒƒƒˆ
1 Strongly ‚ 22 ‚ 25 ‚ 38 ‚ 43 ‚ 128
disagree ‚ 1.27 ‚ 1.67 ‚ 3.57 ‚ 2.20 ‚
ƒƒƒƒƒƒƒƒƒƒƒƒƒƒƒƒƒˆƒƒƒƒƒƒƒƒˆƒƒƒƒƒƒƒƒˆƒƒƒƒƒƒƒƒˆƒƒƒƒƒƒƒƒˆ
2 Disagree ‚ 46 ‚ 81 ‚ 61 ‚ 75 ‚ 263
‚ 2.65 ‚ 5.40 ‚ 5.73 ‚ 3.83 ‚
ƒƒƒƒƒƒƒƒƒƒƒƒƒƒƒƒƒˆƒƒƒƒƒƒƒƒˆƒƒƒƒƒƒƒƒˆƒƒƒƒƒƒƒƒˆƒƒƒƒƒƒƒƒˆ
3 Agree ‚ 764 ‚ 706 ‚ 452 ‚ 890 ‚ 2812
‚ 44.09 ‚ 47.04 ‚ 42.48 ‚ 45.45 ‚
ƒƒƒƒƒƒƒƒƒƒƒƒƒƒƒƒƒˆƒƒƒƒƒƒƒƒˆƒƒƒƒƒƒƒƒˆƒƒƒƒƒƒƒƒˆƒƒƒƒƒƒƒƒˆ
4 Strongly agree ‚ 901 ‚ 689 ‚ 513 ‚ 950 ‚ 3053
‚ 51.99 ‚ 45.90 ‚ 48.21 ‚ 48.52 ‚
ƒƒƒƒƒƒƒƒƒƒƒƒƒƒƒƒƒˆƒƒƒƒƒƒƒƒˆƒƒƒƒƒƒƒƒˆƒƒƒƒƒƒƒƒˆƒƒƒƒƒƒƒƒˆ
Total 1733 1501 1064 1958 6256
Frequency Missing = 196
Table of Q25 by MODE
Q25(When I left the hospital, clearly understood the purpose for taking each of my
medications)
MODE(Survey Mode (CATI/Telephone only, Mail, MIXED, TT-IVR)
Frequency ‚
Col Pct ‚CATI ‚Mail ‚TT-IVR ‚MIXED ‚ Total
ƒƒƒƒƒƒƒƒƒƒƒƒƒƒƒƒƒˆƒƒƒƒƒƒƒƒˆƒƒƒƒƒƒƒƒˆƒƒƒƒƒƒƒƒˆƒƒƒƒƒƒƒƒˆ
1 Strongly ‚ 14 ‚ 26 ‚ 31 ‚ 39 ‚ 110
disagree ‚ 1.03 ‚ 1.99 ‚ 3.29 ‚ 2.40 ‚
ƒƒƒƒƒƒƒƒƒƒƒƒƒƒƒƒƒˆƒƒƒƒƒƒƒƒˆƒƒƒƒƒƒƒƒˆƒƒƒƒƒƒƒƒˆƒƒƒƒƒƒƒƒˆ
2 Disagree ‚ 19 ‚ 56 ‚ 37 ‚ 46 ‚ 158
‚ 1.40 ‚ 4.28 ‚ 3.93 ‚ 2.83 ‚
ƒƒƒƒƒƒƒƒƒƒƒƒƒƒƒƒƒˆƒƒƒƒƒƒƒƒˆƒƒƒƒƒƒƒƒˆƒƒƒƒƒƒƒƒˆƒƒƒƒƒƒƒƒˆ
3 Agree ‚ 540 ‚ 513 ‚ 364 ‚ 627 ‚ 2044
‚ 39.79 ‚ 39.22 ‚ 38.68 ‚ 38.54 ‚
ƒƒƒƒƒƒƒƒƒƒƒƒƒƒƒƒƒˆƒƒƒƒƒƒƒƒˆƒƒƒƒƒƒƒƒˆƒƒƒƒƒƒƒƒˆƒƒƒƒƒƒƒƒˆ
4 Strongly agree ‚ 784 ‚ 713 ‚ 509 ‚ 915 ‚ 2921
‚ 57.77 ‚ 54.51 ‚ 54.09 ‚ 56.24 ‚
ƒƒƒƒƒƒƒƒƒƒƒƒƒƒƒƒƒˆƒƒƒƒƒƒƒƒˆƒƒƒƒƒƒƒƒˆƒƒƒƒƒƒƒƒˆƒƒƒƒƒƒƒƒˆ
Total 1357 1308 941 1627 5233
Frequency Missing = 1219
Appendix B.1
Linear coding
Cronbach Coefficient Alpha
Variables Alpha
ƒƒƒƒƒƒƒƒƒƒƒƒƒƒƒƒƒƒƒƒƒƒƒƒƒƒƒƒ
Raw 0.818870
Standardized 0.819706
Pearson Correlation Coefficients, N = 5064
Prob > |r| under H0: Rho=0
Q23 Q24 Q25
Q23 1.00000 0.64079 0.53106
Staff took preferences into account in deciding <.0001 <.0001
what care needs would be when I left
Q24 0.64079 1.00000 0.63554
When I left the hospital, had good understanding <.0001 <.0001
of things I was responsible for managing health
Q25 0.53106 0.63554 1.00000
When I left the hospital, clearly understood <.0001 <.0001
the purpose for taking each of my medications
Top-box coding
Cronbach Coefficient Alpha
Variables Alpha
ƒƒƒƒƒƒƒƒƒƒƒƒƒƒƒƒƒƒƒƒƒƒƒƒƒƒƒƒ
Raw 0.804103
Standardized 0.803886
Pearson Correlation Coefficients, N = 5064
Prob > |r| under H0: Rho=0
rq23_tb rq24_tb rq25_tb
rq23_tb 1.00000 0.60453 0.50339
(Top-box) Staff took preferences into account in <.0001 <.0001
deciding what care needs would be when I left
rq24_tb 0.60453 1.00000 0.62431
(Top-box) When I left the hospital, had good understanding <.0001 <.0001
of things I was responsible for managing health
rq25_tb 0.50339 0.62431 1.00000
(Top-box) When I left the hospital, clearly understood <.0001 <.0001
the purpose for taking each of my medications
Appendix B.2
Linear coding
Pearson Correlations:
CoC Q23 Q24 Q25
0.49586 0.45955 0.43899 0.39580
Nurse communication Composite <.0001 <.0001 <.0001 <.0001
6292 6088 6246 5223
0.46687 0.40369 0.43257 0.37435
Doctor communication Composite <.0001 <.0001 <.0001 <.0001
6282 6078 6235 5217
0.39208 0.37004 0.35160 0.29872
Responsiveness of hospital staff Composite <.0001 <.0001 <.0001 <.0001
5742 5570 5698 4840
0.43102 0.40108 0.38750 0.33000
Pain management Composite <.0001 <.0001 <.0001 <.0001
4554 4433 4526 3909
0.49176 0.42734 0.42095 0.44382
Communication about medicines Composite <.0001 <.0001 <.0001 <.0001
3572 3474 3544 3142
0.41069 0.38573 0.36170 0.29870
Discharge information Composite <.0001 <.0001 <.0001 <.0001
5904 5719 5864 4936
0.30425 0.26776 0.27647 0.24951
Quiet <.0001 <.0001 <.0001 <.0001
6263 6062 6217 5199
0.32255 0.32193 0.28734 0.22954
Clean <.0001 <.0001 <.0001 <.0001
6261 6060 6213 5199
0.48049 0.44864 0.42519 0.36346
Rate hospital <.0001 <.0001 <.0001 <.0001
6233 6035 6187 5174
0.50586 0.47413 0.44763 0.38463
Recommend hospital <.0001 <.0001 <.0001 <.0001
6253 6054 6207 5192
Appendix B.3
Top-box coding
Spearman Correlations:
CARE_tb rq23_tb rq24_tb rq25_tb
0.39736 0.34257 0.36234 0.32614
Nurse communication top-box (average of top-box items) <.0001 <.0001 <.0001 <.0001
6292 6088 6246 5223
0.39455 0.32021 0.36502 0.32495
Doctor communication top-box (average of top-box items) <.0001 <.0001 <.0001 <.0001
6282 6078 6235 5217
0.31590 0.27899 0.28785 0.24704
Responsiveness of hospital staff top-box (average of top-box items) <.0001 <.0001 <.0001 <.0001
5742 5570 5698 4840
0.34275 0.28059 0.32299 0.28451
Pain management top-box (average of top-box items) <.0001 <.0001 <.0001 <.0001
4554 4433 4526 3909
0.43816 0.36459 0.37405 0.40300
Communication about medicines top-box (average of top-box items) <.0001 <.0001 <.0001 <.0001
3572 3474 3544 3142
0.30304 0.26795 0.26319 0.23492
Discharge information top-box (average of top-box items) <.0001 <.0001 <.0001 <.0001
5904 5719 5864 4936
0.24378 0.20341 0.22498 0.20806
Quiet top-box (Always) <.0001 <.0001 <.0001 <.0001
6263 6062 6217 5199
0.26302 0.24238 0.23428 0.20292
Clean top-box (Always) <.0001 <.0001 <.0001 <.0001
6261 6060 6213 5199
0.39271 0.33693 0.35120 0.32085
Rate hospital top-box (9 or 10) <.0001 <.0001 <.0001 <.0001
6233 6035 6187 5174
0.40812 0.34280 0.37075 0.33439
Recommend hospital top-box (Definitely Yes) <.0001 <.0001 <.0001 <.0001
6253 6054 6207 5192
Appendix C.1 (linear measures)
|
Coordination of Care Composite |
|||
|
Base Model |
Model 1 |
Model 2 |
Model 3 |
ER admit |
|
-1.58 ** |
|
-1.49 * |
MHP |
|
|
-2.33 *** |
-2.32 *** |
Maternity |
9.82 *** |
8.78 *** |
9.39 *** |
8.41 ** |
Surgical |
6.66 ** |
6.08 ** |
6.67 ** |
6.12 ** |
Age: |
|
|
|
|
18-24 |
0.16 |
0.13 |
0.11 |
0.08 |
25-34 |
2.28 |
2.01 |
2.34 |
2.09 |
35-44 |
2.29 |
2.11 |
2.5 |
2.32 |
45-54 |
2.38 |
2.31 |
2.38 |
2.32 |
55-64 |
3.31 ** |
3.21 ** |
3.27 ** |
3.18 ** |
65-74 |
3.93 *** |
3.84 *** |
3.72 *** |
3.64 *** |
75-84 |
1.42 |
1.38 |
1.36 |
1.32 |
Education |
-0.02 |
-0.05 |
-0.28 |
-0.31 |
GHP |
-2.71 *** |
-2.67 *** |
-1.62 *** |
-1.58 *** |
Language other than English |
-1.08 |
-0.98 |
-1.18 |
-1.09 |
Response Percentile |
-1.23 |
-1.17 |
-1.16 |
-1.11 |
Maternity*Age |
-2.43 * |
-2.3 * |
-2.42 * |
-2.3 * |
Surgical*Age |
-0.77 * |
-0.8 * |
-0.82 * |
-0.85 * |
*** p<0.001, ** p<0.01 and * p<0.
Appendix C.2 (top-box measures)
|
Coordination of Care Composite |
|||
|
Base Model |
Model 1 |
Model 2 |
Model 3 |
ER admit |
|
-2.08 |
|
-1.86 |
MHP |
|
|
-5.89 *** |
-5.88 *** |
Maternity |
18.43 *** |
17.07 ** |
17.33 ** |
16.12 ** |
Surgical |
8.35 |
7.59 |
8.38 |
7.7 |
Age: |
|
|
|
|
18-24 |
5.77 |
5.73 |
5.64 |
5.6 |
25-34 |
9.56 ** |
9.2 ** |
9.72 ** |
9.4 ** |
35-44 |
10.4 ** |
10.16 ** |
10.91 *** |
10.7 *** |
45-54 |
11.97 *** |
11.88 *** |
11.98 *** |
11.9 *** |
55-64 |
12.7 *** |
12.57 *** |
12.6 *** |
12.49 *** |
65-74 |
10.92 *** |
10.8 *** |
10.39 *** |
10.29 *** |
75-84 |
3.19 |
3.13 |
3.04 |
2.99 |
Education |
0.89 * |
0.84 |
0.23 |
0.19 |
GHP |
-5.55 *** |
-5.49 *** |
-2.78 *** |
-2.73 *** |
Language other than English |
-4.82 |
-4.68 |
-5.06 |
-4.94 |
Response Percentile |
-4.02 * |
-3.95 * |
-3.84 * |
-3.78 * |
Maternity*Age |
-5.31 * |
-5.14 * |
-5.29 * |
-5.14 * |
Surgical*Age |
-0.68 |
-0.72 |
-0.8 |
-0.83 |
*** p<0.001, ** p<0.01 and * p<0.05
Appendix D
Mode (Mail only as reference): |
CARE model1 |
CARE model2 |
CARE model3 |
CARE model4 |
CARE tb model1 |
CARE tb model2 |
CARE tb model3 |
CARE tb model4 |
CATI |
2.14 ** |
2.17 ** |
2.07 ** |
2.1 ** |
3.33 * |
3.37 * |
3.16 * |
3.19 * |
MIXED |
1 |
1 |
0.97 |
0.97 |
2.96 * |
2.97 * |
2.89 * |
2.89 * |
IVR |
-2.03 ** |
-2 ** |
-2.28 ** |
-2.24 ** |
-1.05 |
-1 |
-1.65 |
-1.6 |
*** p<0.001, ** p<0.01 and * p<0.
(This Table is based on data with all correct exclusions)
Appendix E
Hospital-level InterClass Correlation (ICC), Spearman Brown Correlation (n=300) and Reliability
Appendix F.1
Patient-Mix Adjusted Means Scores for Linearly Scored Measures
PROVID |
CARE_1 |
CARE_2 |
CARE_3 |
CARE_4 |
010024 |
80.01 |
80.02 |
80.05 |
80.05 |
030037 |
75.36 |
75.24 |
75.38 |
75.27 |
030122 |
79.82 |
79.63 |
79.87 |
79.69 |
040014 |
78.34 |
78.29 |
78.37 |
78.32 |
040027 |
79.71 |
79.61 |
79.98 |
79.89 |
050069 |
79.28 |
79.29 |
79.46 |
79.47 |
050104 |
78.63 |
78.7 |
78.87 |
78.93 |
050438 |
84.81 |
84.72 |
84.72 |
84.64 |
050455 |
78.56 |
78.51 |
78.65 |
78.61 |
050506 |
80 |
79.93 |
80.16 |
80.1 |
050746 |
74.93 |
75.06 |
74.94 |
75.06 |
060030 |
83.94 |
83.86 |
83.89 |
83.82 |
100113 |
81.67 |
81.52 |
81.78 |
81.65 |
100135 |
79.9 |
79.79 |
80.04 |
79.94 |
100187 |
65.07 |
65.06 |
64.87 |
64.86 |
100189 |
76.46 |
76.69 |
76.53 |
76.75 |
110075 |
78.88 |
78.89 |
78.72 |
78.73 |
110198 |
71.71 |
71.9 |
71.69 |
71.87 |
120006 |
85.18 |
85.46 |
85.55 |
85.81 |
150012 |
81.24 |
81.17 |
81.31 |
81.25 |
150150 |
80.45 |
80.15 |
80.47 |
80.18 |
190046 |
79.31 |
79.3 |
79.32 |
79.3 |
210019 |
79.69 |
79.62 |
79.41 |
79.35 |
210040 |
76.71 |
76.83 |
76.92 |
77.03 |
230002 |
78.68 |
78.7 |
78.52 |
78.54 |
230070 |
84.43 |
84.5 |
84.43 |
84.49 |
230236 |
82.17 |
82.29 |
81.92 |
82.03 |
240053 |
79.11 |
79.02 |
79.12 |
79.04 |
260027 |
76.23 |
76.11 |
76.54 |
76.43 |
260094 |
78.16 |
78.43 |
78.19 |
78.45 |
290022 |
68.45 |
68.71 |
68.39 |
68.63 |
290041 |
75.07 |
75.1 |
75.02 |
75.05 |
310081 |
79.42 |
79.53 |
79.08 |
79.19 |
360012 |
81.63 |
81.6 |
81.63 |
81.59 |
360155 |
81.8 |
81.82 |
81.65 |
81.67 |
370008 |
77.49 |
77.55 |
77.51 |
77.57 |
370149 |
81.52 |
81.66 |
81.86 |
81.99 |
390211 |
79.47 |
79.47 |
79.17 |
79.18 |
440034 |
80.53 |
80.58 |
80.64 |
80.69 |
440091 |
83.15 |
82.96 |
83.13 |
82.95 |
450056 |
80.47 |
80.42 |
80.56 |
80.51 |
450424 |
78.96 |
79.09 |
78.58 |
78.71 |
450647 |
80.46 |
80.35 |
80.52 |
80.42 |
450675 |
77.99 |
78.06 |
78.21 |
78.28 |
450697 |
73.43 |
73.42 |
72.89 |
72.89 |
450742 |
76.27 |
76.27 |
76.35 |
76.34 |
490075 |
77.4 |
77.4 |
77.22 |
77.23 |
Note: Model 1 is composed of the standard patient-mix adjustor; Model 2 adds to Model 1 the indicator for ER admission; Model 3 adds to Model 1 linear MHP; Model 4 adds to Model 1 the indicator for ER admission and linear MHP.
Patient-Mix Adjusted Means Scores for Top-Box Scored Measures
PROVID |
CARE_tb_1 |
CARE_tb_2 |
CARE_tb_3 |
CARE_tb_4 |
010024 |
46.38 |
46.39 |
46.47 |
46.48 |
030037 |
37.52 |
37.36 |
37.56 |
37.43 |
030122 |
50.78 |
50.54 |
50.92 |
50.7 |
040014 |
47.53 |
47.47 |
47.61 |
47.55 |
040027 |
47.33 |
47.2 |
48.02 |
47.9 |
050069 |
48.84 |
48.86 |
49.3 |
49.31 |
050104 |
43.2 |
43.29 |
43.8 |
43.88 |
050438 |
57.78 |
57.67 |
57.56 |
57.46 |
050455 |
46.46 |
46.4 |
46.71 |
46.66 |
050506 |
47.79 |
47.7 |
48.21 |
48.13 |
050746 |
40.95 |
41.12 |
40.97 |
41.12 |
060030 |
55.47 |
55.37 |
55.35 |
55.26 |
100113 |
51.85 |
51.67 |
52.15 |
51.98 |
100135 |
48.75 |
48.62 |
49.12 |
49 |
100187 |
37.87 |
37.86 |
37.36 |
37.35 |
100189 |
40.32 |
40.61 |
40.5 |
40.76 |
110075 |
44.69 |
44.7 |
44.29 |
44.29 |
110198 |
29.14 |
29.38 |
29.08 |
29.29 |
120006 |
57.96 |
58.33 |
58.9 |
59.22 |
150012 |
51.63 |
51.54 |
51.82 |
51.74 |
150150 |
47.98 |
47.59 |
48.03 |
47.68 |
190046 |
49.57 |
49.55 |
49.58 |
49.56 |
210019 |
47.46 |
47.38 |
46.75 |
46.68 |
210040 |
42.02 |
42.18 |
42.55 |
42.69 |
230002 |
44.03 |
44.06 |
43.63 |
43.66 |
230070 |
57.91 |
58 |
57.91 |
57.99 |
230236 |
54.27 |
54.43 |
53.63 |
53.77 |
240053 |
45.32 |
45.21 |
45.35 |
45.25 |
260027 |
40.74 |
40.59 |
41.52 |
41.38 |
260094 |
46.97 |
47.32 |
47.04 |
47.36 |
290022 |
30.67 |
31 |
30.52 |
30.81 |
290041 |
40.43 |
40.48 |
40.32 |
40.36 |
310081 |
47.42 |
47.57 |
46.57 |
46.7 |
360012 |
52.63 |
52.59 |
52.62 |
52.58 |
360155 |
54.7 |
54.72 |
54.32 |
54.34 |
370008 |
41.45 |
41.53 |
41.51 |
41.59 |
370149 |
50.89 |
51.07 |
51.73 |
51.89 |
390211 |
44.29 |
44.3 |
43.54 |
43.55 |
440034 |
51.02 |
51.09 |
51.31 |
51.38 |
440091 |
53.87 |
53.63 |
53.82 |
53.6 |
450056 |
49.45 |
49.38 |
49.66 |
49.6 |
450424 |
45.87 |
46.03 |
44.91 |
45.06 |
450647 |
48.61 |
48.47 |
48.76 |
48.63 |
450675 |
44.64 |
44.73 |
45.21 |
45.29 |
450697 |
37.17 |
37.15 |
35.8 |
35.79 |
450742 |
41.82 |
41.81 |
42.01 |
41.99 |
490075 |
43.97 |
43.98 |
43.53 |
43.54 |
Note: Model 1 is composed of the standard patient-mix adjustor; Model 2 adds to Model 1 the indicator for ER admission; Model 3 adds to Model 1 linear MHP; Model 4 adds to Model 1 the indicator for ER admission and linear MHP.
Appendix F.2
Correlation and Informativeness (1 - R²) of Adjusted Means from Model 1 with Each of the Three Alternative Models.
|
Correlation |
1 - R² |
||||
|
Model 1 & 2 |
Model 1 & 3 |
Model 1 & 4 |
Model 1 & 2 |
Model 1 & 3 |
Model 1 & 4 |
Linear |
||||||
Nurse communication Composite |
1.000 |
0.999 |
0.999 |
0.000 |
0.001 |
0.001 |
Doctor communication Composite |
0.997 |
0.998 |
0.995 |
0.007 |
0.003 |
0.010 |
Responsiveness of hospital staff Composite |
1.000 |
1.000 |
1.000 |
0.000 |
0.000 |
0.001 |
Pain management Composite |
1.000 |
0.999 |
0.999 |
0.000 |
0.002 |
0.002 |
Communication about medicines Composite |
1.000 |
0.999 |
0.999 |
0.000 |
0.002 |
0.002 |
Discharge information Composite |
0.999 |
1.000 |
0.999 |
0.002 |
0.000 |
0.002 |
Quiet |
1.000 |
1.000 |
1.000 |
0.000 |
0.000 |
0.001 |
Clean |
1.000 |
1.000 |
1.000 |
0.000 |
0.000 |
0.000 |
Rate hospital |
1.000 |
1.000 |
1.000 |
0.000 |
0.000 |
0.001 |
Recommend hospital |
1.000 |
1.000 |
1.000 |
0.000 |
0.000 |
0.000 |
Coordination of Care Composite |
0.999 |
0.999 |
0.998 |
0.001 |
0.002 |
0.003 |
Top-Box |
||||||
Nurse communication |
1.000 |
0.999 |
0.999 |
0.000 |
0.003 |
0.003 |
Doctor communication Composite |
0.996 |
0.998 |
0.995 |
0.007 |
0.004 |
0.010 |
Responsiveness of hospital staff Composite |
1.000 |
0.999 |
0.999 |
0.000 |
0.001 |
0.001 |
Pain management Composite |
1.000 |
0.999 |
0.999 |
0.000 |
0.002 |
0.003 |
Communication about medicines Composite |
1.000 |
0.998 |
0.999 |
0.000 |
0.003 |
0.003 |
Discharge information Composite |
0.999 |
1.000 |
0.999 |
0.002 |
0.000 |
0.002 |
Quiet |
1.000 |
1.000 |
1.000 |
0.000 |
0.001 |
0.001 |
Clean |
1.000 |
1.000 |
1.000 |
0.000 |
0.001 |
0.001 |
Rate hospital |
1.000 |
1.000 |
0.999 |
0.000 |
0.001 |
0.001 |
Recommend hospital |
1.000 |
1.000 |
1.000 |
0.000 |
0.001 |
0.001 |
Coordination of Care Composite |
1.000 |
0.997 |
0.997 |
0.001 |
0.005 |
0.006 |
Note: Model 1 is composed of the standard patient-mix adjustor; Model 2 adds to Model 1 the indicator for ER admission; Model 3 adds to Model 1 linear MHP; Model 4 adds to Model 1 the indicator for ER admission and linear MHP.
Appendix G
Difference in adjusted mean scores from standard PMA Model (Base Model) and each of the alternate Models 2, 3 and 4.
-
DUPONT HOSPITAL LLC (Gain: -0.299)
SOUTHWEST GENERAL HOSPITAL (Gain: -0.539)
SOUTHWEST GENERAL HOSPITAL (Gain: -0.547)
BANNER GATEWAY MEDICAL CENTER (Gain: -0.19)
SAN JACINTO METHODIST HOSPITAL (Gain: -0.379)
PENINSULA REGIONAL MEDICAL CENTER (Gain: -0.339)
MEMORIAL HOSPITAL, CHATTANOOGA, TN (Gain: -0.187)
UNDERWOOD - MEMORIAL HOSPITAL (Gain: -0.336)
SHARON REGIONAL HEALTH SYSTEM (Gain: -0.29)
SHANDS HOSPITAL AT THE UNIVERSITY OF FLORIDA (Gain: -0.143)
SHARON REGIONAL HEALTH SYSTEM (Gain: -0.299)
DUPONT HOSPITAL LLC (Gain: -0.262)
RESEARCH MEDICAL CENTER (Gain: -0.119)
PENINSULA REGIONAL MEDICAL CENTER (Gain: -0.281)
SAN JACINTO METHODIST HOSPITAL (Gain: -0.257)
NORTH FULTON REGIONAL HOSPITAL (Loss: 0.185)
SAINT FRANCIS MEDICAL CENTER (Loss: 0.237)
MEDICAL CENTER OF ARLINGTON (Loss: 0.29)
NORTHWEST MEDICAL CENTER (Loss: 0.227)
BAXTER REGIONAL MEDICAL CENTER (Loss: 0.274)
SAINT FRANCIS MEDICAL CENTER (Loss: 0.297)
DESERT SPRINGS HOSPITAL CENTER (Loss: 0.254)
RESEARCH MEDICAL CENTER (Loss: 0.307)
NORTHWEST HOSPITAL CENTER (Loss: 0.325)
SKAGGS COMMUNITY HEALTH CENTER (Loss: 0.272)
UNITY HEALTH CENTER (Loss: 0.336)
UNITY HEALTH CENTER (Loss: 0.466)
CASTLE MEDICAL CENTER (Loss: 0.28)
CASTLE MEDICAL CENTER (Loss: 0.371)
CASTLE MEDICAL CENTER (Loss: 0.634)
DUPONT HOSPITAL LLC (Gain: -0.387) |
SOUTHWEST GENERAL HOSPITAL (Gain: -1.361) |
SOUTHWEST GENERAL HOSPITAL (Gain: -1.371) |
BANNER GATEWAY MEDICAL CENTER (Gain: -0.246) |
SAN JACINTO METHODIST HOSPITAL (Gain: -0.957) |
SAN JACINTO METHODIST HOSPITAL (Gain: -0.808) |
MEMORIAL HOSPITAL, CHATTANOOGA, TN (Gain: -0.243) |
UNDERWOOD - MEMORIAL HOSPITAL (Gain: -0.849) |
PENINSULA REGIONAL MEDICAL CENTER (Gain: -0.78) |
SHANDS HOSPITAL AT THE UNIVERSITY OF FLORIDA (Gain: -0.186) |
SHARON REGIONAL HEALTH SYSTEM (Gain: -0.755) |
SHARON REGIONAL HEALTH SYSTEM (Gain: -0.744) |
RESEARCH MEDICAL CENTER (Gain: -0.154) |
PENINSULA REGIONAL MEDICAL CENTER (Gain: -0.709) |
UNDERWOOD - MEMORIAL HOSPITAL (Gain: -0.715) |
|
|
|
NORTH FULTON REGIONAL HOSPITAL (Loss: 0.24) |
SAINT FRANCIS MEDICAL CENTER (Loss: 0.599) |
MEDICAL CENTER OF ARLINGTON (Loss: 0.649) |
NORTHWEST MEDICAL CENTER (Loss: 0.294) |
BAXTER REGIONAL MEDICAL CENTER (Loss: 0.692) |
NORTHWEST HOSPITAL CENTER (Loss: 0.671) |
DESERT SPRINGS HOSPITAL CENTER (Loss: 0.329) |
RESEARCH MEDICAL CENTER (Loss: 0.776) |
SAINT FRANCIS MEDICAL CENTER (Loss: 0.672) |
SKAGGS COMMUNITY HEALTH CENTER (Loss: 0.352) |
UNITY HEALTH CENTER (Loss: 0.848) |
UNITY HEALTH CENTER (Loss: 1.007) |
CASTLE MEDICAL CENTER (Loss: 0.364) |
CASTLE MEDICAL CENTER (Loss: 0.937) |
CASTLE MEDICAL CENTER (Loss: 1.259) |
Appendix H
Mode Effects with and without PMA adjustment.
|
|
LINEAR SCORING |
TOP-BOX SCORING |
||||
|
|
CATI |
IVR |
MIXED |
CATI |
IVR |
MIXED |
|
|
|
|
|
|
|
|
CARE |
Without PMA |
2.25 ** |
-1.53 |
0.89 |
3.50 * |
0.12 |
2.53 |
|
With PMA |
2.10 ** |
-1.97 * |
0.88 |
3.13 * |
-0.77 |
2.45 |
Appendix I
Mixed effect models with mode and standard PMA as fixed effects, and hospital and hospital by mode as random effects.
|
CARE |
||
RANDOM EFFECTS: |
SE |
VAR |
|
PROVID |
2.65 |
7.01 |
** |
CATI*PROVID |
0.00 |
0.00 |
|
MIXED*PROVID |
0.60 |
0.36 |
|
IVR*PROVID |
4.07 |
16.54 |
* |
Residual |
19.06 |
363.4 |
*** |
1 The PMA are indicators for age (18-24, 25-34, 35-44, 45-55, 56-64, 65-74, 75-84 and 85 or older (reference)), linear education, linear overall health, indicators for maternity and surgical service lines, indicator for language other than English spoken at home, response percentile, and interaction of linear age with maternity and surgical.
| File Type | application/msword |
| Author | cg7684 |
| Last Modified By | Christine Payne |
| File Modified | 2015-07-07 |
| File Created | 2015-07-07 |
© 2026 OMB.report | Privacy Policy