Calling Protocol and Dispositions
Attachment 10 Calling Protocol and Dispositions.docx
Behavioral Risk Factor Surveillance System (BRFSS)
Calling Protocol and Dispositions
OMB: 0920-1061
Attachment 10
2019 BRFSS Data Collection Protocol
With Disposition Table


Table of Contents
Data Sharing, Security and Rights to the Datasets 16
State Pilot Projects Using Protocol Adjustments 17
Appendix A 2019 BRFSS Questionnaire 18
Appendix B: Disposition Table with Callback Rules 19
Appendix C: Understanding Coding for Technological / Telecommunication Barriers 37
Appendix D: Uploading BRFSS Data Using OneEdits 49
Appendix E: BRFSS State Data Submit File Process 77
Appendix F: Understanding the YTD Data Quality Reports 135
Appendix G: Crisis Protocol 213
Step 1: Recognize that a respondent is possibly distressed. 214
Step 2: Assess the level of distress that a respondent is apparently experiencing. 214
Step 3: Respond appropriately to the situation. 215
Step 4: Document the case—Adverse Event Report Form 222
Step 5: Self- Care for You 222
Situations Involving Other Individuals 222
Introduction
In 1984, the Centers for
Disease Control and Prevention (CDC) initiated the state-based
Behavioral Risk Factor Surveillance System (BRFSS)—a
cross-sectional telephone survey that state health departments
conduct monthly over landline telephones and, since 2011, cell
phones; the states conduct the BRFSS survey with the use of a
standardized questionnaire and the technical and methodologic
assistance from CDC. BRFSS collects prevalence data among
noninstitutionalized adult US residents regarding their risk
behaviors and preventive health practices that can affect their
health. Respondent data are forwarded to CDC to be aggregated for
each state, returned with standard tabulations, and published at
year's end by each state. In 2017, over 450,000 interviews were
conducted in the states, the District of Columbia, and participating
US territories and other geographic areas.
This
document provides data collectors with a BRFSS overview and outlines
the processes involved with calling, disposition-code assignment, and
data submission. This document does not cover details of sampling and
weighting, as they are not data-collectors’ responsibility.
Specific information regarding data quality, response and/or
cooperation rates, or calling outcome can be found in the yearly
Summary Data Quality Report released with the annual data set.
Find
yearly data and support documents here:
http://www.cdc.gov/brfss/data_documentation/index.htm.
Details of the data collection process are discussed in regularly scheduled conference calls and at the annual BRFSS meetings/training workshops. BRFSS encourages data collectors to participate in these events, as updating BRFSS data-collection protocol is a collective process that is strengthened when organizations and day-to-day stakeholders provide their input.
The
BRFSS Process
The BRFSS questionnaire was developed in collaboration with CDC and public health departments in each of the states, the District of Columbia, and participating territories. Data derived from the questionnaire provide health departments, public health officials, and policy makers with behavioral and health status information that, when combined with mortality and morbidity statistics, guide the development of health-related policies and priorities as well as help decision makers address and assess strategies to promote good health. A finalized version of the questionnaire is sent to the states each year. CDC also provides computer-assisted telephone interviewing (CATI) programming to states, but they may opt to use their own CATI programming software using the final version of the BRFSS questionnaire as a guide. States which develop their own programming systems are required to test it accurately against the CDC provided programming. States may not change the skip patterns or wording of questions in the questionnaire but are free to create state-added questions that can be customized to states’ individual needs (see below). In some instances, states may insert state-added questions into the questionnaire--with permission from CDC--when such questions fit into the context of extant topics/sections and do not impede the flow of the interview. Requests should be submitted to the state project officer or the survey methodologist on the Survey Operations Team.
Annual questionnaire construction
The BRFSS questionnaire is comprised of an annual standard core, which includes questions asked of respondents each year; a biannual rotating core, which includes questions asked only in even- or odd-numbered years; optional modules, which include standardized questions adopted verbatim by the states; and state-added questions, which states individually customized. Appendix A provides a draft copy of the 2019 BRFSS questionnaire, including modules with skip patterns. Data collectors will note that the 2019 questionnaire includes skip patterns for landline and cell phone interviews that administrators should follow when they are conducting interviews using a sample provided by CDC (see Sampling below).
Standard Core Questions: The portion of the questionnaire that is included each year and must be asked by all states. The core may include Emerging Core questions about “late-breaking” health issues. After 1 year, these questions are either discontinued, incorporated back into the standard core or become part of the rotating core or optional modules.
Rotating
Core Questions: The
portion of the questionnaire asked by all states on an
every-other-year basis. These questions regularly appear in even- and
odd-numbered years. A
few questions (dealing with immunization) appear on the BRFSS in
three year rotating cycles.
States may use rotation core questions as optional modules in
off-year questionnaires.
Optional
Modules:
Optional modules are sets of standardized questions on various topics
that each state may select and include in its questionnaire. Once
selected, a module must be used in its entirety and asked of all
eligible respondents. If an optional module is modified in any way
(e.g., if a question is omitted), then the questions will be treated
as state-added questions (see below).
In order to achieve a wide range of data, states may choose to “split” samples in order to give different modules to each smaller group of participants. For example, if a state adopts a questionnaire that is too long to ensure respondent cooperation, the state may choose to provide a version of the questionnaire with the core and a subset of modules. In this way a greater number of modules may be used if the state uses different modules on different versions of the questionnaire. Some respondents, therefore, will answer the core questionnaire and one set of modules, while others answer the core questionnaire and a different set of modules. States are required to conduct at least 2,500 interviews for each of the versions of the questionnaire in order to have enough responses for weighting purposes. States may adopt up to three versions of the questionnaire, each including the core (with standard and rotating core questions) and a specified number of modules, which will differ by version. States must include modules on both landline and cell phone interviews. Versions must also be included in both samples.
In many instances states may prefer to insert optional modules into the core questionnaire. This may be done to improve the flow of the questionnaire by grouping questions on similar topics. The following optional modules may be inserted into the questionnaire at the discretion of the BRFSS coordinators:
Name of Optional Module |
Approved section of questionnaire |
Industry and Occupation |
After the employment question in the demographics section |
Food Stamps |
After employment question or (I/O module) in demographics |
Diabetes/ Pre-diabetes |
After the diabetes question in the chronic disease section |
Healthcare access |
After core healthcare access questions |
Adult HPV, Place of Flu vaccination, Shingles |
In Immunization section |
Sexual Orientation and Gender Identity Sex at Birth |
In Demographics section just after the question on sex at birth (C08.05), if asked or just after C08.04 if C08.05 is not asked. |
Home/ Self-measured Blood Pressure |
Just after the Hypertension Awareness section of the core |
All other insertions of optional modules into the core sections should be approved by CDC prior to implementation of the survey.
State-added Questions: BRFSS encourages states to add their own extra questions to their questionnaire, so they can gather data on additional topics related to their specific health priorities. All questions included in the BRFSS, with the exception of state-added questions, are cognitively tested prior to inclusion in the questionnaire. It is up to each state to decide whether or not it will cognitively test its state-added questions before use. State-added questions may not be inserted into the text of the core questionnaire or optional modules without approval from BRFSS. States should contact their project officers to request insertion of state-added questions into text that has been approved for use by all states.
The wording of the questions in any part of the BRFSS, with the exception of state-added questions, is determined at the annual BRFSS meeting (in spring or early summer), where BRFSS state coordinators vote to adopt questions submitted by CDC programs. A governing group including state BRFSS coordinators, CDC staff and others known as the BRFSS Working Group, may add questions on emerging issues (such as the H1N1 flu questions added in 2009 and e-cigarette use in 2014). A field test of new questions, modules and those sections of the questionnaire affected by new questions is conducted after the state voting process. CDC then designs core components and optional modules and produces data processing layouts, while considering state priorities, potential funding, and other practical aspects. Minor changes in question wording and format may be made after the field test. The new BRFSS materials for the next surveillance year are then sent to the states, which may add their own questions that they have designed or acquired. A target of October 1 is set for finalization of the questionnaire for the upcoming year.
Data collectors should have the capacity to make modifications, including addition of questions, during the course of the year. In addition, data collectors must be capable of adjusting screening questions that determine eligibility during the course of the year.
Data
Collection
Data collection follows a suggested BRFSS interviewing schedule; all calls for a given survey month should be completed in the same sample month if possible. In some cases samples begun in one month may be completed in the first 7-10 days of the next month. Up to 15 calling attempts may be made for each landline phone number and up to 8 for each cell phone number in the sample, depending on state regulations for calling and outcomes of previous calling attempts. Although states have some flexibility in distribution of calling times, in general, surveys are conducted using the following calling occasions:
Conduct 20% of landline calling attempts on weekdays (before 5:00 PM)
Conduct 80% of landline calling attempts on weeknights (after 5:00 PM) and weekends
Conduct cell phone calling attempts during all three calling occasions (weekday, weeknight, and weekend), with approximately 30% on weekend calling occasions.
Change schedules to accommodate holidays and special events.
Make weeknight calls after 5:00 PM.
Adhere to respondents’ requests for specific callback/appointment times whenever possible.
With larger portions of the samples allocated to cell phone numbers, states may modify the calling schedule for efficiency. Data collectors must develop and maintain procedures to ensure respondents’ confidentiality, assure and document the quality of the interviewing process, and supervise and monitor the interviewers. CDC does not authorize the taping of interviews. Data collectors should keep in mind that state laws on recording conversations may vary, and there is no certainty when dialing a cell phone number as to where respondents are currently residing and accepting calls. Should a data collector record a call for any reason (such as training), CDC must be notified and approve of the procedure. In all cases where quality is being monitored by recording calls, respondents should be notified before the first questions are posed.
Each telephone number in the CDC-provided sample must be assigned a final disposition code to describe the result of calling the number:
A completed or partially completed interview (see definitions in Appendix B) or
A determination that:
A household was eligible to be included but an interview was not completed or
A telephone number was ineligible or could not have its eligibility determined.
The final disposition codes are then used to calculate response rates, cooperation rates, and refusal rates. The distribution of individual disposition codes and the rates of cooperation, refusal, and response are published annually in the Summary Data Quality Reports. BRFSS uses standards set by the American Association of Public Opinion Research (AAPOR) to determine disposition codes and response rates. All BRFSS disposition codes and rules for assigning disposition codes are provided in Appendix B: Disposition Table with Callback Rules. Given the myriad outcomes for assigning specific codes associated with technological barriers, additional guidance is provided in Appendix C: Understanding Coding for Technological/ Telecommunication Barriers. Data collectors must follow the rules for assigning disposition codes and train and monitor interviewers in the use of specific dispositions.
Survey Protocol
BRFSS sets standard protocols for data collection, in order to maintain consistency across states that permits state-to-state data comparison. Data collectors should follow the assignment of disposition codes provided in Appendix B: Disposition Table with Callback Rules. Disposition codes follow the format of 1000-1999 completed/partially completed; 2000-2999 non-completed interviews with eligible respondents/households; 3000-3999 non-completed interviews with unknown eligible persons/households; 4000-4999 ineligible numbers; 5000-5999 interim dispositions. A 2000 level disposition should not be assigned unless the interviewer is certain that both the household and respondent are eligible for the survey. Assigning incorrect disposition codes can lower response rates and efficient use of the sample. The following items are included in the BRFSS survey protocol:
1. All states must include the core questions and introductory scripts without modification. States may choose to add any, all, or none of the optional modules and state-added questions after the core component. Interviewers may not offer information to respondents on the meaning of questions, words, or phrases beyond the interviewer instructions provided by CDC and/or the state BRFSS coordinators. States may not insert state-added questions into the core component or into optional modules without permission. State coordinators should contact their CDC project officers to request the placement of state-added questions into text that has been approved for use by all states.
2. Systematic, unobtrusive electronic monitoring is a routine and integral part of monthly survey procedures for all interviewers. States may also use callback verification procedures to ensure data quality. Unless supervisory monitoring of 10% of all interviews is being routinely conducted, a 5% random sample of each month’s interviews must be called back to verify selected responses for quality assurance. Recording calls as part of quality assurance is not part of the BRFSS methodology and recording interviews without respondent knowledge is not legal in all states. Data collectors should remember that cell phone numbers may reach respondents in any state or country, where laws on recording calls may be different than in the state where the call originated.
3. An eligible household is defined as a housing unit that has a separate entrance, where occupants eat separately from other persons on the property, and that is occupied by its members as their principal or secondary place of residence. The following are non-eligible households: vacation homes not occupied by household members for more than 30 consecutive days per year, group homes, institutions, and (in the landline telephone sample) households in states other than the one conducting the BRFSS questionnaire. Persons in a state’s cell phone sample who are residents of other states are eligible for interview. The state contacting the respondent should complete the core questionnaire and then provide the data to CDC for transfer to the appropriate state of the respondents’ residence. States should especially attempt to obtain the state of residence of respondents who indicate that they have moved and retained their cell phone number from another state. States should collect verbatim county information on persons who live in other states in order to permit the correct weight for the respondent after data are transferred. Since 2012, persons living in college housing have been included as eligible respondents. Although it is rare to contact a college housing resident in the landline sample, this person would also be included as a single adult household. The BRFSS is a self-reported survey. If respondents report that they live in private residences, it is not the role of interviewers to question them. The only instances under which there is discussion of information on whether households qualify as private residences is when respondents initiate the question.
4. Eligible household members include all related adults (aged 18 years or older), unrelated adults, boarders/roomers, live-in au pairs or students and domestic workers who consider the household their home, even though they may not be home at the time of the call. College housing residents are treated as single adult households. Household members do not include adult family members (including students) who are currently living elsewhere.
5. Questions should be read verbatim. In many cases introductory phrases are provided which should also be read as written. Interviewer instructions are optional and can be read if the respondent is confused or needs additional information. Items in parentheses in statements are also optional and may be read for clarification. Interviewers should not offer their own interpretation of questions or response options.
6. Proxy interviews are not conducted in the BRFSS. For people interviewed on landline telephones, individual respondents are randomly selected from all adults living in a household and are interviewed in accordance with BRFSS protocol. Household members include all family members, domestic servants, and au pair or live-in students who have resided at the residence for at least 3 months. Cell phone interviews are conducted with respondents who answer the number called and are treated as one-person households.
7. An interview is considered complete if data are collected for all questions which would have normally been asked for any selected respondent. Partially completed interviews are defined as those where the first sections of the interview are completed and the portions of the demographic section which are used for weighting are also asked of the selected respondent in regular order of the questionnaire. For the 2019 questionnaire this will include through question 8.12 for landline respondents and 8.09 for cell phone respondents. If the respondent does not provide substantive responses for weighting variables (that is, the respondent refuses to answer or responds that he/she does not know), imputed values will be generated and used only to assign weights. If an interviewer codes a number of responses as “don’t know” or “refused” just prior to cut off in order to have an interview count as a partial complete, this will be noted by the CDC staff as potential falsification of data.
States should monitor data collection to ensure that the percentage of partial completes is not greater than 10% of the number of completes. A large percentage of partial completes could result in missing data for variables that follow the demographic sections including all optional modules. The number of partial completes which are not part of the RFP may be higher, if the state has contracted with the data collector ONLY on the number of 1100 dispositions.
8. With the exception of verbally abusive respondents, eligible people who initially refuse to be interviewed may be contacted at least one additional time and given the opportunity to be interviewed. Preferably, this second contact will be made by a supervisor or a different interviewer. Some states have regulations on whether refusals should be called again and the manner of the refusal conversion. For example, a period of two days between the initial refusal and second attempt is often standard protocol. Data collectors should contact the state BRFSS coordinator to determine the state’s policy on calling back refusals. Some states maintain an internal list of numbers which connect to households/persons who have been particularly adamant about being taken off calling lists. Numbers from new samples are matched against these list to prevent calling the numbers. States generally maintain a number on the list for up to two years. Numbers de-duped as a result of such lists should be coded with dispositions of 3700.
9. States are required to give a final disposition for every number in the sample, usually within the same month of the sample. States should complete all calling on each monthly sample within that month. A few states receive and account for all calling on a sample on a quarterly basis rather than a monthly basis. Data collectors should contact the state BRFSS coordinator to verify whether the state is receiving a monthly or quarterly sample from CDC.
10. The BRFSS OMB number and burden statement must appear on the header page of all interviewer forms. The CDC will provide the header with the questionnaire each year. Please note that the interviewers do not need to read any part of the OMB number or burden statement to the respondents unless asked. The entire burden statement does not need to be read if the respondent is simply asking how long the interview will take. If the respondent asks for any information at any time about the authority by which information is being collected, it is imperative that the OMB approval information be available to the interviewer. The interviewer may then cite the OMB control information, which would allow the respondent to review the project plan online.
11. CDC provides the states with a Spanish translation of the BRFSS questionnaire. Unlike the English version, states may change wording of the Spanish version in order to match local dialects.
12. Each data collector must assign a unique identifier to each interviewer, so that state health departments and the CDC may conduct interviewer-level analyses. This identifier should not be assigned to other interviewers working on the BRFSS for that state.
General callback and disposition coding rules are established by CDC (see Appendix B), and states are encouraged to adhere to them whenever possible. The calling rules are not universally applicable to each state. Data collectors contracted by the states should have the capacity to adhere to the calling rules listed below as well as those to in Appendix B.
All cell phone numbers must be hand dialed. Data collectors should seek legal advice if they are uncertain whether their practices are in any way contradictory to the regulations.
Interviewers should be trained specifically for the BRFSS and retrained each year.
If possible, calls made to non-English-speaking households and assigned the interim disposition code of 5330 (household language barrier) should be attempted again with an interviewer who is fluent in the household language (e.g., Spanish).
States should maximize calling attempts as outlined in Appendix B. The maximum number of attempts (15 for landline telephone and 8 for cell phone) may be exceeded if formal appointments are made with potential respondents. There are many instances in which the maximum number of callbacks is not required. States and data collectors should refer to the callback table provided in Appendix B with this document for the required number of callbacks for each calling outcome/ disposition.
Calling attempts should allow for a minimum of 6 rings and up to 10 rings if not answered or diverted to answering devices.
The maximum number of attempts may be set by the states. CDC recommendations for the maximum number of attempts are 15 for landlines and 8 for cell phones.
All numbers must be assigned a final disposition. Data should not be submitted with interim dispositions.
Messages left on answering devices/voice mail devices should be left by interviewers. Messages should never be left by any automated voice devices. States may have their own standard scripts for messages, describing the reasons for the call and when respondents might expect a return call. Messages can be left after any attempt. It is not recommended that respondents be burdened by repeated messages. States should adopt protocols to leave one or two messages during the calling attempts for a single number during the calling period.
If a respondent indicates that they will be available for a callback at a specific time/date, appointments may be made. Data collectors may send texts reminding cell phone respondents of the appointments after receiving verbal permission to text that information.
States adopting the Adverse Childhood Experience (ACE) Module, should train interviewers on how to handle respondents who become upset or stressed as a result of the questions. Appendix G provides a crisis protocol to train interviewers who will be administering this module.
Using the BRFSS Sample
In some instances, states design samples within boundaries of sub-state geographic regions. States may determine that they would like to sample by county, public health district, or other sub-state geography in order to make comparisons of geographic areas with their states. To conduct the BRFSS, states get samples of telephone numbers from CDC. States then review their sampling methodology with a state statistician and CDC to make sure data collection procedures are in place to follow the methodology. States must consult with CDC before making changes to methodology. States must maintain sample phone numbers in files that are separate from responses, in order to maintain standards of respondent confidentiality.
The BRFSS uses two samples: one for landline telephone respondents and one for cell phone respondents. State BRFSS coordinators work with CDC to produce all samples The CDC recommends that the range of completed cell phone interviews be a minimum of 50% to a maximum of 80% of total completed interviews. The 50-80% range of cell phone interviews is set to ensure the geographic distribution of the sample (since landlines samples can be geographically distributed across the state) and to ensure that the sample is demographically representative of the state. Data collectors are ultimately responsible to states for the distribution between landline and cell phones. Since landline telephones are often shared, household sampling is used in the landline telephone sample. Household sampling requires interviewers to collect information on the number of adults living in a residence and then select randomly from all eligible adults (see questionnaire). Cell phone respondents are treated as single adult households and therefore do not require household sampling. The samples are fully overlapping, so that any eligible person in the landline frame may also be eligible in the cell phone frame. States receive the sample monthly or quarterly, approximately by the 15th. Note that the BRFSS is a sample with replacement. It is possible, therefore, for a single household/respondent to be eligible and appear in a sample more than once within a year. Some states eliminate duplicate (“de-dup”) numbers that appear within the same quarter. A state with sub-state regions that represent small areas is more likely to encounter repeat numbers in the sample. States that wish to send advance letters should request addresses with their regular landline and cell phone samples. For states that send advance letters, mailing addresses are appended to telephone numbers. Data collections should release all replicates (of 30 numbers) in the sample in the first week of each month. Those who receive samples quarterly should release them in a manner that allows for sufficient calling prior to the end of the quarter. The table below provides the format for the landline and cell phone sample files received by the states.
Field Name |
Size |
Position |
Format/Values/Explanation |
|
||||||||||
Phone Number (AREACODS, PREFIXS, SUFFIXS) |
22 |
1-22 |
9,1-NNN-NNN-NNNNv20191 |
|
||||||||||
Geographic Stratum (_GEOSTRS) |
3 |
23-25 |
First position = 1 for Landline / 2= Cell phone Then States with no geographic strata=01 in each record. Others according to provided information. |
|
||||||||||
Density Stratum (_DENST2S) |
1 |
26 |
1=Listed number, 2=Not listed one-plus block, 3=Zero block, 9=Not applicable (GU, PR, VI). |
|
||||||||||
Sequence Number (SEQNO) |
10 |
27-36 |
A unique 10-digit number for a state for a year with year in the first four digits. For example: 2015000001. |
|
||||||||||
Number of Records Selected From Stratum (NRECSELS) |
6 |
37-42 |
Number of telephone numbers (eligible sampling units) selected from stratum. |
|
||||||||||
Number of Records in Stratum (NRECSTRS) |
9 |
43-51 |
Number of telephone numbers in the stratum from which sample was selected. |
|
||||||||||
Precall [GENESYS-ID] Status (PRECALLS) Landline sample |
1 |
52 |
1=To be called, 3=Non-working number, 5=Business phone. (Including GU, PR, VI) 4 = Cellular – PRO-T-S, 6 = Cellular - Interviewer |
|
||||||||||
Precall [Cell-WINS Screening] Status (PRECALLS) Cell phone sample |
1 |
52 |
1=Active, 3=Inactive, 7=Unknown Status
|
|
||||||||||
Replicate Number (SMONTH, REPNUM) |
6 |
53-58 |
The first two digits, 01-12, represent months, the last four digits a sequential number starting with 0001 each month. |
|
||||||||||
Replicate Depth (REPDEPTH) |
2 |
59-60 |
A sequential number from 01‑30 in each replicate. |
|
||||||||||
State FIPS Code (_STATE) |
2 |
61-62 |
FIPS code of assigned state. |
|
||||||||||
County FIPS Code (ASGCNTY) |
3 |
63-65 |
FIPS code of assigned county. Blank=GU, PR, VI. |
|
||||||||||
County FIPS Code of Listed Number (LISTCNTY) |
3 |
66-68 |
For listed numbers, FIPS code of the county in which number is located. For not listed numbers=999. Blank=GU, PR, VI, and cell phone sample |
|
||||||||||
Number of Landline Assignments in 1K Blocks in Assigned County (NOHHCTY) |
4 |
69-72 |
Number of Landline Assignments in 1K Blocks that are in assigned county. Blank=GU, PR, VI, and cell phone sample |
|
||||||||||
NXX Type (NXXTYPE) |
2 |
73-74 |
Blank |
|
||||||||||
Number of Landline Assignments in 100 series bank (BLCKSIZE) |
3 |
75-77 |
Number of landline assignments in hundred block=000-100. Blank=GU, PR, VI, and cell phone sample |
|
||||||||||
Number of Landline Assignments in 1K Block (LSTHHPRE) |
5 |
78-82 |
Number of Landline Assignments in 1K Block Blank=GU, PR, VI, and cell phone sample |
|
||||||||||
Estimated Total Households in Prefix (TOTHHPRE) |
5 |
83-87 |
BLANK |
|
||||||||||
Core Based Statistical Area (CBSACODE) |
5 |
88-92 |
99999=Not in an MSA. Blank=GU, PR, VI, and cell phone sample |
|
||||||||||
Metropolitan Status Code (MSCODE) |
1 |
93 |
1=In the center city of an MSA, 2=Outside the center city of an MSA but inside the county containing the center city, 3=Inside a suburban county of the MSA, 4=In an MSA that has no center city, 5=Not in an MSA. Blank=GU, PR, VI. |
|
||||||||||
Rate Center Name (RCNAME) Cell phone only |
30 |
94-123 |
Rate Center Name (RCNAME) |
|
||||||||||
V&H Coordinate (VNHCOORD) |
10 |
124-133 |
BLANK |
|
||||||||||
Date Sample Generated (DATESMP) |
10 |
134-143 |
mm/dd/yyyy |
|
||||||||||
Pre-screening Process Used (PRESCREN) |
1 |
144 |
0= Not screened 1=ID 2=ID Plus 3 = CSS, 4 = Cell
|
|
||||||||||
Date Sample Pre-screened (DATESCRN) |
10 |
145-154 |
mm/dd/yyyy
|
|
||||||||||
Release Date of Active Prefix Database (PHNRLDAT) |
10 |
155-164 |
mm/dd/yyyy Blank= cell phone sample |
|
||||||||||
Release Date of Listed Phone Number Database (LSTRLDAT) |
10 |
165-174 |
mm/dd/yyyy Blank=GU, PR, VI, and cell phone sample. |
|
||||||||||
CLEC Number (CLEC) |
1 |
175 |
1=Yes, 2=No. Blank=GU, PR, VI, and cell phone sample. |
|
||||||||||
Replicate designated for inclusion in Multi-Mode Mail Survey and address match status (MSREPMCH) Landline only |
1 |
176 |
Blank = All States |
|
||||||||||
Time Zone |
1 |
177 |
Eastern = 7, Central = 6, Mountain = 5, Pacific = 4, Alaska = 3, Hawaii =2 Blank= cell phone sample |
|
||||||||||
Blank |
1 |
178 |
Blank |
|
||||||||||
Listed in one of the following Databases: InfoUSA, Experian, (DIRLST) |
1 |
179 |
1=Yes, 2=No. Blank=GU, PR, VI, and cell phone sample. |
|
||||||||||
Secondary Screening Flags
|
1
|
180
|
Blank= cell phone sample |
|||||||||||
Indication of Address Matching Landline only |
1 |
181 |
1=Matched 2=Not matched Blank=GU, PR, VI, and cell phone sample |
|||||||||||
Path variable (PATH) used to help identify which questionnaire is used when there are dual questionnaires. (States may update this variable to use for multiple paths in split samples) |
2 |
182-183 |
10 = Default Genesys value Landline Survey Sample 20 = Default Genesys value Cell Phone Survey Sample |
|||||||||||
Note: Monthly files will be sorted by stratum, replicate, and depth. The order of numbers within a replicate will be randomized before assignment of depth numbers. All numeric fields are right aligned and padded with leading zeros. All character fields are left aligned with trailing blanks. |
||||||||||||||
Each phone number is assigned a precall status to indicate whether the number should be called. States may opt to call landline telephone numbers with precall status >1 but are not required to do so. States may also choose not to call landline numbers from the unlisted portion of the sample with precall status = 1 which also have secondary screening status as fax/modem lines or are listed as “busy” by the precall screener. States are not required to call cell phone sample numbers with an “inactive” precall status, but may choose to do so. States should call all cell phone numbers with active and unknown precall status in the cell phone samples. Given that the precall status indicates the potential for reaching an eligible respondent, calling landline numbers with precall >1 or cell phone numbers with inactive precall status may reduce response rates. States may also use the secondary precall status to assign bilingual interviewers to numbers with language barrier precall assignments, or make extra efforts to reach numbers which have precall status indicating residence/household status. In 2019, landline phone numbers will be differentiated in the sample as precall > 1 if a technical review indicates that the number is never answered or a business. This should reduce the calling efforts for landline no answers, which typically represent more than half of the final dispositions for landline sample.
The landline sample is taken from listed and unlisted numbers at a ratio of 1:2. The ratio has changed from previous years, when it was 1:1.5, due to the changes in stability of the landline samples. NOTE: The number of callbacks required on the landline sample is different based on the density strata. Numbers from the low density strata have eight required callbacks, while those on the high density strata should be called 15 times. Please see the callback rules table provided in Appendix B for information on the number of required callbacks for each calling outcome/disposition.
States that request addresses may send advance letters to those households to alert them to the fact that they will be receiving calls and the nature of the survey. States may include a toll free number for potential respondents to inquire about the BRFSS. Studies have shown that the use of advance letters does improve response rates. However, the proportion of the landline sample that is accurately matched to addresses is declining. Currently about 20-30% of the landline sample is accurately matched to an address. In 2019, for the first time, the BRFSS will also support sending advance letters to cell phone respondents. The ability to match cell phone numbers to addresses is improving, but states should only expect about 20-23% of cell phone numbers to match correctly to addresses. Since the cell phone sample is at the individual rather than household level, letters should specify which phone number connected to that address has been chosen. In order to maintain confidentiality, it is required that only portions of the phone number (such as the last four digits) be noted in the advance letters for cell phone respondents. The CDC will make every effort to provide addresses for advance letter as early as possible during each month. Data collectors should note that the cell phone sample is appended with landline numbers which have been ported to cell phone in previous months. Therefore the landline sample files may arrive earlier in the month than cell phone samples. Data collectors should speak to their BRFSS state coordinators about advance letters.
Samples for US territories differ from those from the states. BRFSS coordinators in US territories may deviate from the calling and sampling guidelines to fit the data needs of their jurisdictions. Data collectors should work closely with state BRFSS coordinators to ensure that the sample is properly managed. CDC will provide quarterly sample productivity tables on the upload/download site to alert the state coordinators of any problems with sample management.
Data collectors can track samples and productivity using the YTD Data Quality Reports (DQR) available with assigned logins on the upload site. Appendix F provides information on how to interpret information provided in the YTD Reports. The following table of contents lists the information available in the YTD Data Quality Reports. Changes in the information provided in the DQRs may change according to the needs of the data collectors and state coordinators. A short tutorial for using and understanding the YTD Data Quality Reports is found in Appendix F. BRFSS Coordinators and Data Collectors may attend training on using the YTD reports and Uploading Data at the annual BRFSS Questionnaire Meeting.
Year-to-Date Data Quality Reports Table of Contents |
|
Definition of Variables |
Final Disposition Codes |
Table 1A. Interview Month By File Month (Landline only) |
Table 1B. Interview Month By File Month (Cell phone only) |
Table 2A. Discrepancy in Sex Between Population Estimates and Unweighted BRFSS Data, Year-to-Date (Landline only) |
Table 2B. Discrepancy in Sex Between Population Estimates and Unweighted BRFSS Data, Year-to-Date (Cell phone only) |
Table 3A. Discrepancy in Age Between Population Estimates and Unweighted BRFSS Data, Year-to-Date (Landline only) |
Table 3B. Discrepancy in Age Between Population Estimates and Unweighted BRFSS Data, Year-to-Date (Cell phone only) |
Table 4A. Discrepancy in Race/Ethnicity Between Population Estimates and Unweighted BRFSS Data, Year-to-Date (Landline only) |
Table 4B. Discrepancy in Race/Ethnicity Between Population Estimates and Unweighted BRFSS Data, Year-to-Date (Cell phone only) |
Table 5A. Geo-Stratum by File Month and Year-to-Date (Landline only) |
Table 5B. Geo-Stratum by File Month and Year-to-Date (Cell Phone only) |
Table 6A. Date, Day of Week, Number of Interviewers and Final Disposition Code, by File Month (records with one or more attempts; Landline only) |
Table 6B. Date, Day of Week, Number of Interviewers and Final Disposition Code, by File Month (records with one or more attempts; Cell phone only) |
Table 7A. Number and Percent of Completes in the First 5, 10, 15, 20, and 25 Days by File Month (Landline only) |
Table 7B. Number and Percent of Completes in the First 5, 10, 15, 20, and 25 Days by File Month (Cell phone only) |
Table 8A. Eligibility and Status by Categories of Disposition Code, Year-to-Date (Landline only) |
Table 8B. Eligibility and Status by Categories of Disposition Code, Year-to-Date (Cell phone only) |
Table 9A. Eligibility and Status by Categories of Disposition Code by File Month (Landline only) |
Table 9B. Eligibility and Status by Categories of Disposition Code by File Month (Cell phone only) |
Table 10A. Detailed Disposition Code, Year-to-Date (Landline only) |
Table 10B. Detailed Disposition Code, Year-to-Date (Cell phone only) |
Table 11A. Detailed Disposition Code by File Month (Landline only) |
Table 11B. Detailed Disposition Code by File Month (Cell phone only) |
Table 12A. Number of Attempts by File Month (Landline only) |
Table 12B. Number of Attempts by File Month (Cell phone only) |
Table 13A. Outcome Rates, Year-to-Date by File Month (Landline only) |
Table 13B. Outcome Rates, Year-to-Date by File Month (Cell phone only) |
Table 14A. Income (77 and 99 collapsed), Year-to-Date (Completes only; Landline only) |
Table 14B. Income (77 and 99 collapsed), Year-to-Date (Completes only; Cell phone only) |
Summary Data Quality Reports are also available on the BRFSS website for previous years. States may compare their data productivity to that of other states in the summary reports, but will not have access to the YTD reports from other states.
Data Submission
CDC will provide a data layout file for monthly data submission. The BRFSS provides a data submission website to be used for uploading states’ data and monitoring the progress of processing. Access to this site is limited and requires a login accepted by CDC. Details on data submission are included in Appendix D: Uploading BRFSS Data Using OneEdits. Note that 2016 was the first year that OneEdits software will be used for data submission, so procedures have changed recently. Data collectors should download and run edit fix programs from the upload site prior to submitting data. Errors in submitted data will delay processing and may result in data sets being returned to states for corrections. Monthly data submission is preferable (and required during flu season, September-June). Data for each should be submitted by the 25th of April, July, October and January, respectively. Following the quarterly submissions, states will receive a data file for checking. Appendix E outlines the steps in submission of data files that have been cleaned through OneEdits.
Data Sharing, Security and Rights to the Datasets
State and territorial health departments are the owners of the datasets. Data Collectors which are contracted by health departments have NO data rights and should not share or publish from state data sets without written permission. States should consider carefully before permitting use of data which are not part of the public use dataset. Persons seeking access to county code information, industry and occupation information or other variables which are not part of the public use dataset may apply for access through the CDC Research Data Center (RDC) at https://www.cdc.gov/rdc/index.htm.
While the Privacy Act is not applicable, the appropriate security controls and Rules of Behavior should be incorporated to protect the confidentiality of information, proprietary, sensitive, and Personally Identifiable Information (PII) the data collector may come in contact with during the BRFSS data collection process.
As is noted elsewhere in this document, sample files and response files should not be merged or linked. Data collections should transmit data only through the upload sites provided by CDC and not by email attachments or other means. Data collectors should maintain the most recent virus protections, operating systems patch levels and other security measures to all computers used to collect BRFSS data. While computers used for CATI data collection are not in all cases accessible to the internet, data collectors should ensure that access to data using flash drives or other devices is restricted to authorized individuals for authorized purposes.
Sample files should not be retained past the data of final use for BRFSS purposes. BRFSS sample file use is restricted to completion of BRFSS data collection and data collection for BRFSS call-back surveys. BRFSS sample files are not to be used for any other or subsequent purpose. Data collectors may not obtain permission for such use from respondents and are restricted from soliciting BRFSS respondent to take part in other surveys, internet panels or any other related use.
Data collectors should not retain sample or data files beyond the time that is necessary to finalize data. During the time that datasets are retained by data collectors, they should meet all security requirements for data storage and firewalls that are included in the most current BRFSS OMB approval. Data collectors may choose to configure computers that contain BRFSS data with the applicable United States Government Configuration Baseline (USGCB) (see http://usgcb.nist.gov/). Note: USGCB is applicable to all computing systems, including desktops and laptops—regardless of function—but not including servers.
State Pilot Projects Using Protocol Adjustments
At any time during the data collection process, states may make greater efforts to reach respondents than the protocols listed here. These efforts may include increasing the number of attempts, increasing the ring times, calling all numbers in the sample regardless of the precall status or increased interviewer monitoring or training. On occasion states may wish to make adjustments to the data collection protocol in order to test the efficiency of a new procedure. For example, in 2017, one state determined that response rates might improve if the interviewer took a more conversational tone during the introduction of the survey. The protocol adjustment was approved and the change was made and tested by the state. States, and data collectors who wish to make protocol adjustments must have written approval from CDC in order to make adjustments. State coordinators should contact their project officers and the survey operations team at the Public Health Surveillance Branch of the Division of Population
Appendix A 2019 BRFSS Questionnaire
(to be inserted)
Appendix B: Disposition Table with Callback Rules
Definitions of terms |
|
Respondent |
An adult who is contacted by an interviewer and who may be eligible for interview. |
Calling attempt |
An attempt is an effort to reach a potential respondent by dialing a phone number, even if the dialing does not reach or connect with a working phone line. |
Complete |
An interview in which all questions are complete, including all core and module questions which would be assigned to a selected respondent. |
Partial compete |
An interview which in which the selected respondent has been asked all questions up to those which will be used for weighting. For the 2019 questionnaire this will include through question 8.12 for landline respondents and 8.09 for cell phone respondents. Questions do not have to be answered substantively to be counted as asked (respondents may have provided answers of “do not know” or refused to answer questions). |
Landline telephone |
A telephone that is used within a specific location. Includes traditional household telephones, VOIP and internet phones connected to computers in a household. |
Cell phone |
A mobile device that is not tied to specific location for use and uses cell towers to connect users. |
Selected respondent |
An adult who is eligible for interview. For the cell telephone sample a selected respondent is an adult associated with the phone number who lives in a private residence or college housing within the US or territories covered by the BRFSS. For the landline telephone sample a selected respondent is the person selected for interview during the household enumeration section of the screening questions. |
Calling occasions |
There are three calling occasions: weekday (before 5:00 pm on a weekday); weeknight (after 5:00 pm on a weekday), and; weekend (any time on Saturday or Sunday). |
Personal Cell phone |
A cell phone that is used for personal calls. Cell phones that are used for both personal and business calls may be categorized as personal telephones and are eligible for interview. Telephones that are used exclusively as business phones are not personal telephones and, therefore, are not eligible for interview. |
Private residence |
A non-institutionalized residence in which adults persons aged 18 and over reside at least 30 days per year that has a separate entrance and cooking capabilities. It may also be college housing, such as a dormitory, fraternity or sorority house, campus sponsored housing or college family housing, or international student or visiting faculty housing. Personal RVs may be private residences. Group homes, military barracks, vacation homes that are not lived in for 30 days, or other temporary housing are not private residences. The determination of private residence is primarily made by the respondents. If the respondents indicate that they live in private residences, interviewers do not question their interpretation of their living situations. |
Disposition Code |
Description |
Definition |
Range of Number of Attempts |
Callback Rules |
1100
|
Complete |
Assign if selected respondent completes questionnaire. |
1-15 attempts (landline) 1-8 attempts (cell phone) |
|
1200 |
Partial complete |
Assign if selected respondent completes demographic questions that are used for weighting. For the 2019 questionnaire this will include through question 8.12 for landline respondents and 8.09 for cell phone respondents. |
1-15 attempts (landline) 1-8 attempts (cell phone) |
Selected respondent may be called back to fully complete the interview. Give final disposition on 15th or subsequent call attempt even if there is only one occurrence of a refusal or termination. |
2111 |
Household level refusal (landline telephone only) |
Assign for landline telephone only if refusal after confirmation of reaching household telephone line used by adults in correct state but before household selection and core BRFSS Q1 in landline telephone. Refusal can be from any member of the household (note: if refusal by selected respondent use code 2112). Automated messages should not count as refusals. |
1-15 (8) attempts (landline) 1-8 attempts (cell phone) |
May be assigned after one attempt if hard refusal or special circumstance. Assign after maximum number of attempts and at least one interim disposition of 5111 (household level refusal). |
2112 |
Selected respondent refusal |
Assign if refusal by selected respondent before core BRFSS Q1 is answered by landline telephone. Automated messages should not count as refusals. Assign if cell phone respondent refuses after number determined to be personal phone and respondent confirms living in private residence or college housing. |
1-15 (8) attempts (landline) 1-8 attempts (cell phone) |
May be assigned after one attempt if hard refusal or special circumstance. Assign after maximum number of attempts and at least one interim disposition of 5112 (respondent refusal). |
2120 |
Break off/ termination within questionnaire |
Assign if selected respondent has completed portions of Core BRFSS with responses other than “don’t know” or “refused’ and terminates/breaks off prior to the last question used for weighting (in the demographics section). (NOTE: If respondent completes questionnaire through weighting questions, code 1200.) |
1-15 (8) attempts (landline) 1-8 attempts (cell phone) |
May be assigned after one attempt if hard refusal or special circumstance. Assign after maximum number of attempts with at least one interim disposition of 5120 (break off/termination). |
2210 |
Selected respondent never available |
Assign if selected respondent is never available during sample period. Selected respondent may not have been contacted or contacted and asked to be called later. Includes repeated unsafe location for interview, respondent away during period of interview, respondent not available for appointment. Includes selected respondents who die during interview period. |
1-15 (8) attempts (landline) 1-8 attempts (cell phone) |
Give final disposition when notified or after at least 5 calling occasions of no more than 3 attempts with at least 3 weekday, 3 weeknight and 3 weekend calls for landline telephone. Cell phone respondents may be called up to 8 times, with at least 2 weekday, 2 weeknight and 2 weekend attempts. Assign after maximum number of calling attempts with at least one interim disposition of 5100 (appointment), or 5560 (unsafe location). |
MOVE THESE CALLS TO 3140 |
|
|
|
|
2320 |
Selected respondent physically or mentally unable to complete interview |
Assign if selected respondent is unable to complete interview due to physical or mental impairment. This includes temporary conditions such as bereavement, which will last beyond the interview period. |
1-6 attempts |
Assign the first time a selected respondent is contacted or is described by someone else as physically or mentally incapable of completing survey or the second time a respondent who is physically or mentally impaired is contacted. |
2330 |
Language barrier, selected respondent |
Selected respondent does not speak English or other language for which interviewers are available. (NOTE: If language barriers prevent completion of respondent selection, assign code 3330 (language barrier, physical or mental impairment). |
1-6 attempts |
Assign the first time a selected respondent is contacted or is described by someone else as not speaking English or other language (i.e. Spanish) for which interviewers are available. |
3100 |
Unknown if eligible |
Assign if hang up or call back request without confirming private residence/college housing or age of respondent (landline telephone and cell phone). |
1-15 (8) attempts (landline) 1-8 attempts (cell phone) |
Give final disposition after second hang-up / call back request / termination or when a first time hang up will not be called back because of hard refusal or special circumstances and when household eligibility is NOT established. If the first occurrence is on 15th attempt, give final disposition. Assign after maximum number of attempts with at least one interim disposition of 5050 (hang up, unknown if housing unit). |
3130 |
No answer |
Assign if telephone rings normally but no one answers. |
6-15 (8) attempts |
Give final disposition after at least 5 calling occasions of no more than 3 attempts with at least 3 weekday, 3 weeknight and 3 weekend calls for landline telephones. Cell phone respondents may be called up to 8 times, with at least 2 weekday, 2 weeknight and 2 weekend attempts. Assign after maximum number of attempts with plurality of interim dispositions of 5130 (no answer). |
3140 |
Answering device, unknown whether eligible |
Assign if a mailbox is full or not yet established. Assign if answering device leaves open the possibility that the telephone number is not a residence or that the respondent is not eligible due to age. |
10-15 (8) attempts for landline telephones; up to 8 attempts for cell telephones |
Give final disposition after at least 5 calling occasions of no more than 3 attempts with at least 3 weekday, 3 weeknight and 3 weekend calls for landline telephones. Cell phone respondents may be called up to 8 times, with at least 2 weekday, 2 weeknight, and 2 weekend attempts. Assign after maximum number of attempts with plurality of interim dispositions of 5140 (answering device, unknown if eligible residence or respondent). |
3150 |
Telecommunication barrier |
Assign if call blocking, call ID requirements or other respondent initiated block device leaves open the possibility of the number reaching an eligible household and/or respondent. Assign if call forwarded to other number and there is some potential for reaching household or actual respondent at later time. |
1-6 attempts |
Give final disposition after up to 3 calling occasions of no more than 2 attempts with at least 2 weekday, 2 weeknight, and 2 weekend calls for landline telephones. Cell phone respondents may be called up to 6 times, with at least 2 weekday, 2 weeknight and 2 weekend attempts. Assign after maximum number of attempts with at least one interim disposition of 5150 (telecommunication barrier) and all others noncontact. |
3200 |
Household, not known if respondent eligible |
Assign for landline telephone sample if private residence confirmed without selecting respondent. (NOTE: If contact is made and household eligibility is unknown, use code 3100). Contact with vacation home may apply. Contact with household where residents are away for interview period may apply.
Assign for cell phone if contact is made with household resident without determining whether cell phone number and respondent are eligible. |
1-15 (8) attempts (landline) 1-8 attempts (cell phone) |
Give final disposition after second hang-up/ termination or when a first time hang up will not be called back because of hard refusal or special circumstances and when respondent eligibility is NOT established. If the first occurrence is on 15th attempt, give final disposition. Assign after maximum number of attempts with at least one interim disposition of 5050 (hang up, unknown if respondent eligible). |
3322 |
Physical
or mental impairment |
Assign if physical or mental impairment prevents determination of private residence or prevents determination of eligibility of household or resident. This is a household level assignment. If selected respondent is physically or mentally impaired, assign 2320 after first attempt. |
1-6 attempts |
Assign after maximum number of attempts with at least one interim disposition of 5320 (physical or mental impairment). |
3330 |
Language barrier, (household level) |
Assign if language barrier prevents determination of private residence or prevents determination of eligibility of household or resident. This is a household level assignment. If selected respondent has language barrier assign 2330 when informed. Information may come from respondent or other household member. |
1-6 attempts |
Assign after maximum number of attempts with at least one interim disposition of 5330 (household language barrier). Do not assign if there are interviewers within the calling center who could complete the interview in language spoken by household (i.e. Spanish). |
3700 |
On never call list |
Assign only if supervisor can determine that respondent/ household is on never call list. Interviewer should not assign based on respondent information. (NOTE: If respondent insists that he/she is on never call list assign household level refusal (2111) or respondent refusal (2112). |
No attempt |
Assign with confirmation by supervisor. Interviewer should not assign based on respondent information. |
4100 |
Out of sample |
Assign if out of state for landline telephone or out of country for cell phone. Assign if indication that number reaches vacation home or household members are not living in home during interview period. (NOTE: If contact is made with respondent who indicates that they have been reached at their vacation home where they live for at least 30 consecutive days per year, interview can continue). Assign if no adults available on landline number (teen phone).
Assign if landline telephone sample number connects to cell phone or if sample indicates that a number in the landline telephone sample has been ported to a cell phone. |
1-15 (8) attempts (landline) 1-8 attempts (cell phone) |
Assigned as soon as sample ineligibility determined. This should take priority over other final dispositions. |
4200 |
Fax/data/modem |
Assign if call reaches fax or data line without human contact. |
1-6 attempts |
May be assigned to landline unlisted sample with secondary precall status of fax. May be assigned after one attempt. If states choose to use 6 attempts, give final disposition after recommendation for 3 calling occasions with 2 weekday, 2 weeknight and 2 weekend calls for landline telephones. If states choose to use 6 attempts, cell phone respondents may be called up to 6 times, with recommendations for 2 weekday, 2 weeknight, and 2 weekend attempts. If 6 attempts are used, assign after maximum number of attempts with at least one interim disposition of 5200 (fax/data/modem) and all others noncontact with any person. |
4300 |
Nonworking number/ disconnected |
Assign if tritone. Assign if operator message of nonworking number. States may choose to assign for temporary nonworking number message on first attempt or after repeated temporary nonworking number messages. Assign if “number changed” message. Assign if correctly dialed number rings to incorrect number. Assign if respondent reports that connection has been made to wrong number. A number that does not accept incoming calls (such as a hospital line only used for outgoing calls) |
1-6 attempts. Do not call more than 6 attempts. |
May be precall assigned (for both landline and cell phone). May be assigned after one attempt. If states use 6 attempts, give final disposition after recommendation for 3 calling occasions with 2 weekday, 2 weeknight, and 2 weekend calls for landline telephones. Cell phone respondents may be called up to 6 times, with recommendations for 2 weekday, 2 weeknight, and 2 weekend attempts. Assign after maximum number of attempts with at least one interim disposition of 5400 (technological barrier), 5300 (possible nonworking) or 5550 (busy) and all others noncontact. |
4400 |
Technological Barrier |
Assign if repeated busy, fast busy or circuit busy messages. Assign if repeated ambiguous operator messages. Assign if repeated poor audio quality. Assign if number repeatedly does not connect.
Assign if number reaches a retrieval or connectivity system (such as Skype or OnStar).
Assign if cell phone respondent is outside calling area. Assign if respondent is unable to receive calls. DO NOT assign if answering device (which permits leaving messages) is reached. |
1-6 attempts. Do not call more than 6 attempts. |
May be assigned to landline unlisted sample with secondary precall status of busy. May be assigned after one attempt. If states use 6 attempts, give final disposition after recommendation for 3 calling occasions with 2 weekday, 2 weeknight, and 2 weekend calls for landline telephones. Cell phone respondents may be called up to 6 times, with recommendations for 2 weekday, 2 weeknight, and 2 weekend attempts. Assign after maximum number of attempts with interim dispositions of 5200 (fax/data/modem), 5400 (technological barrier), 5300 (possible nonworking) and/or 5550 (busy) and all others noncontact. |
4430 |
Call forwarding / pager |
Assign if message indicates number has been forwarded. Assign if number reaches a pager. Assign if connection produces series of beeps. NOTE: Do not select respondents from landline household or location that is different from the original number. Do not enumerate the number of adults at location which is different from original number.
However, landline respondent may be interviewed if number has been temporarily forwarded and the respondent is still living at location of original number. Cell phone respondents who have forwarded their numbers may also be interviewed. |
1-6 attempts. Do not call more than 6 attempts. |
May be assigned after one attempt. May give final disposition after respondent or automated message informs that the number has been forwarded after multiple attempts. May give final disposition after series of beeps indicates a pager has been reached. If states use 6 attempts, give final disposition after recommendation for 3 calling occasions with 2 weekday, 2 weeknight, and 2 weekend calls for landline telephone. Cell phone respondents may be called up to 6 times, with recommendations for 2 weekday, 2 weeknight, and 2 weekend attempts. |
MOVE THESE TO 4100 |
|
|
|
|
4460 |
Landline telephone (cell phone only) |
Assign if cell phone sample number connects to a landline telephone. |
1-15 (8) attempts (landline) 1-8 attempts (cell phone). |
Can be precall assigned. Given final disposition when informed. This disposition should take priority over other possible final dispositions for the cell phone sample. |
4500 |
Non-residence |
Assign if business, group home, government, or other organization. For cell phone, assign if telephone is used exclusively for business purposes. |
1-15 (8) attempts (landline) 1-8 attempts (cell phone) |
Given final disposition when informed. This disposition should take priority over other possible final dispositions. This disposition should be assigned to numbers with a precall status of 5. |
MOVE THESE CALLS TO 4500 |
|
|
|
|
MOVE THESE CALLS TO 4100 |
|
|
|
|
4900 |
Miscellaneous,
|
Assign for null numbers, special data circumstances only. May be assigned if data are believed by state coordinator or data collection supervisor to be falsified or in error. Notify CDC when this code is used. |
1-15 attempts (landline) 1-8 attempts (cell phone) |
May be assigned after one attempt. Assign only with supervisor approval. |
5050 |
Unknown whether eligible |
Respondent hangs up or refuses before establishing eligibility. The state location question is not needed to establish eligibility for cell phone respondents. |
|
Give interim disposition when this occurs. Call back after an interval of at least one day until maximum call attempts are reached. |
5100 |
Appointment |
Respondent asks for an appointment or asked to be called at some other time. Assign if child answers the phone and does not get an adult to come to the phone. Appointments may be formal or informal statements that the respondent is temporarily not able to complete the interview from household members or selected respondent. |
|
Schedule a callback for appropriate time. |
5111 |
Household level refusal (landline telephone only) |
Assign for landline telephone only if refusal after confirmation of reaching household phone line used by adults in correct state but before core BRFSS Q1 in landline telephone. Refusal can be from any member of the household (note: if refusal by selected respondent, use code 2112). Automated messages should not count as refusals. |
|
Give interim disposition when this situation occurs. Call back after an interval of at least one day. May assign final disposition of 2111 if hard refusal. |
5112 |
Selected Respondent refusal: hang up or termination |
Assign if refusal by selected respondent before Core BRFSS Q1 in landline telephone. Automated messages should not count as refusals. Assign if cell phone respondent refuses after number determined to be personal (nonbusiness) phone and respondent confirms living in private residence or college housing. |
|
Give interim disposition. Schedule callback for as long as practical for up to two weeks after initial refusal. |
5120 |
Break off / termination in questionnaire |
Assign after respondent completes through Core BRFSS Q1 with an answer other than “don’t know/not sure” or “refused” but breaks off prior to end of demographic section. |
|
Give interim disposition when this situation occurs. Call back after an interval of at least one day. |
5121 |
Call dropped |
Assign for cell phone respondent if call is dropped. |
|
Give interim disposition when this situation occurs. Call back may occur immediately or rescheduled after an interval of one hour. |
5130 |
No answer |
Assign if number rings normally without answer. |
|
Give interim disposition when this occurs. Call back after an interval of at least one hour until maximum call attempts are reached. |
5140 |
Answering device, unknown whether eligible |
Assign if a mailbox is full or not yet established. Assign if answering device whether or not the message leaves open the possibility that the telephone number is not a residence or that the respondent is not eligible due to age. |
|
Give interim disposition when this occurs. Call back after an interval of at least one hour until maximum call attempts are reached.
|
5150 |
Telecommunication barrier |
Assign if call blocking, call ID requirements or other respondent initiated block device leaves open the possibility of the number reaching an eligible household and/or respondent. Assign if call forwarded to other number and there is some potential for reaching household or actual respondent at later time. |
|
Give interim disposition when this occurs. Call back after an interval of at least one hour until maximum call attempts are reached. |
5200 |
Fax/data/modem |
Assign if number connects to data or fax line without human contact. |
|
States may assign final disposition of 4200 at any attempt, including the first attempt. If states choose to call up to 6 attempts, give interim disposition and schedule callback after an interval of at least one day. |
MOVE THESE TO 5140 |
|
|
|
|
5300 |
Possible nonworking |
Assign if message indicates number might be nonworking. Assign if recorded message indicates number is temporarily out of service. Assign if message indicates telephone number cannot be reached at this time. Assign if recording indicates that the number is for outgoing calls only (such as a hospital line for outgoing calls only). |
|
States may assign final disposition of 4300 at any attempt including the first attempt. If states choose to call up to 6 attempts, give interim disposition and schedule callback after an interval of at least one hour. |
5320 |
Physical or mental impairment |
A household respondent or selected respondent is temporarily unable to be interviewed due to physical or mental impairment. NOTE: If selected respondent has permanent physical or mental impairment that renders him/her unable to complete the interview, assign final disposition of 2320 (physical or mental impairment) as soon as informed. |
|
Give interim disposition when this occurs. Call back after an interval of at least one day until maximum call attempts are reached. |
5330 |
Language barrier |
Assign if a respondent who is not the selected respondent does not speak English or other language for which an interviewer is available. (NOTE: If selected respondent does not speak English or language for which there is an interviewer available, give final disposition of 2330 as soon as informed.) |
|
Give interim disposition when this occurs. Call back after an interval of at least one day until maximum call attempts are reached. |
5400 |
Technological barrier |
Assign if fast busy or circuit busy messages. Assign if ambiguous operator messages.
Assign if number reaches a retrieval or connectivity system (such as Skype or Onstar).
Assign if poor audio quality. Assign if number does not connect. Assign if cell phone respondent is outside calling area. Assign if respondent is unable to receive calls. DO NOT assign if answering device (which permits leaving messages) is reached. |
|
States may assign final disposition of 4400 at any attempt. If states choose to call up to 6 attempts, give interim disposition and schedule callback after an interval of at least one day. |
5550 |
Busy |
Assign if number produces normal busy (not fast busy) signal. |
|
States may assign final disposition of 4400 at any attempt. If states choose to call up to 6 attempts, give interim disposition and schedule callback after an interval of at least one hour. |
5560 |
Unsafe location/ activity for interview |
Assign if respondent indicates he/she unable to continue due to safety concerns. May be assigned to numbers in cell phone or landline phone sample. |
|
Give interim disposition when this occurs. Schedule a callback time or call back after an interval of at least one hour until maximum call attempts are reached. |
5700 |
Supervisor attention |
Assign if special circumstances require supervisor attention |
|
Assign only for special circumstances. |
5900 |
Null attempt |
Assign only with supervisor approval for special data circumstances. |
|
Assign only with supervisor approval for special data circumstances. |
Appendix C:
Understanding Coding for
Technological / Telecommunication Barriers
Introduction
The Ci3 2015 BRFSS survey programming includes four-digit disposition codes. Disposition code changes resulted from the move toward the standards of the American Association of Public Opinion Research (AAPOR), the increased diversity of types of telephones in the sample, and the rapid changes in telephone usage.
This document provides a quick overview of the differences between Technological Barriers and Telecommunication Barriers, and Phone Circuit Messages and Answering Device Messages. It also provides examples of Phone Circuit messages and Answering Device messages with comments on their proper coding. The number and variety of messages that phone companies use are changing rapidly. The lists provided here are not comprehensive, but they are intended to give an overview of coding for commonly heard messages. This list was developed following discussions with data collectors at the 2013 BRFSS conference, and amended after discussions in 2015.
Definitions
of Technological Barriers, Telecommunication Barriers,
Phone
Circuit Messages and Answering Devices
One challenge with BRFSS disposition codes is the differentiation between a Telecommunication Barrier [5150] and a Technological Barrier. [5400]. The differences between these codes are based on whether the respondent initiates the barrier (Telecommunication Barrier) or the barrier is due to something outside of the control of the respondent (Technological Barrier). Technological Barriers may be due to the carrier or problems in the circuits or with the type of telephone. Technological barriers may also be due to a connection to a system that is not used as a phone, but a connectivity system itself, such as Skpe.
Keep in mind that a Technological Barrier will be coded as ineligible while a Telecommunication Barrier is coded as unknown eligibility. Also remember that clear messages for non-working numbers should be coded as final disposition nonworking number (4300) or possible nonworking number (interim code 5300). Personal answering devices should not be coded as a Technological Barrier.
Telecommunication
Barriers vs. Technological Barriers Technological
Barrier (5400 or 4400):
A Technological Barrier is either: c)
a retrieval or connectivity system (such as Skype or Onstar). or Telecommunication
Barrier (5150 or 3150):
A Telecommunication Barrier is a device or service on the end of a
telephone line put by the telephone line owner to block incoming
calls. This type of barrier includes call blocking devices or
requirements for codes prior to connection but does not include
personal answering devices (such as voice mail). Telecommunication
Barriers result from screening by potential respondents NOT by
telephone companies.
Code
a result as a telecommunication barrier only when there is assurance
that the respondent put the block on the phone line. Otherwise,
code the call as a technological barrier.
a) a telephone # that
does not behave like a telephone line but instead acts like some
other device (pager, alarm system, etc.); or
b) a
NON-connecting telephone line that a telephone owner cannot answer
(fast busy, circuit busy, etc.);
c)
a line with an ambiguous phone circuit message.

Interviewers often encounter messages from a phone company, or a phone circuit message. Phone circuit messages are not specific to a potential respondent and DO NOT ALLOW INTERVIEWERS TO LEAVE MESSAGES. Answering devices, on the other hand, do allow for interviewers to leave messages, unless the mailbox is full. Answering devices are set up by respondents or are specific to their telephone numbers. Even if a recorded message is heard on the answering device, it is still specific to that number and should be coded appropriately.
Phone
Circuit Messages vs. Answering Devices Phone
Circuit Messages:
A phone circuit message is
produced by a telephone company. It is not specific to a potential
respondent. Phone circuit messages do not permit interviewers to
leave messages for potential respondents. Phone circuit messages may
result in technological barrier dispositions (5400 or 4400),
nonworking number dispositions (5300 or4300) or other ineligible
dispositions. Answering
Devices: Answering
devices must allow interviewers to leave messages or indicate that a
specific mailbox is full. An answering device is specific to a
potential respondent, even if it is a recorded message. For example,
a recording which indicates that the interviewer has reached a
specific number and allows the interviewer to leave a message is an
answering device, not a phone circuit message. Codes for answering
devices are 5140 and 3140 regardless of whether the number is in the
landline or cell phone sample. .
Code
a result as an answering device only if the interviewer has the
potential to leave a message (or if the mailbox is full).

Examples of Messages and Coding Suggestions
Sometimes it is difficult to tell if a number is non-working or if there is a technological barrier. If the number is identified as purely non-working (you get an operator message that says it’s non-working) then use a non-working disposition code (either final non-working [4300] or possible non-working [5300]). CATI centers should define how strong the message needs to be to decide between final [4300] and possible [5300] non-working. The table below illustrates some common phone circuit messages that have been reported by states in the recent months. We have provided suggested coding for each message. This list is not exhaustive and it is likely that data collectors will continue to hear ambiguous messages in the future. Keep in mind the general rule that technological barriers are outside the control of the respondents, while telecommunication barriers are specifically placed by the respondents to block calls.
Table 1 Common Phone Circuit Messages |
||
Phone Circuit Message |
Comment |
Suggested Coding |
You have reached the (XXX) Telecom voice messaging service. If you have a mailbox on this system and would like to access it now, enter your 10-digit phone number, then press pound. |
This is a number to a voicemail service, not a household. |
4500--Non-residence |
Tritone with and/or without a message |
This message indicates that the number may not be a working number. |
5300--Possible Non-working 4300--Nonworking |
The number you have reached is not in service at this time. |
This message indicates that the number may not be a working number. |
5300--Possible Non-working 4300--Nonworking |
At the subscriber’s request, this phone does not accept incoming calls. |
Although this may appear to be a block, our experience with this message is that it is a hospital or group home where the phone places outgoing calls only. |
5300--Possible Non-working 4300--Nonworking |
Welcome to [cell phone carrier]. The number you have dialed is unassigned. |
This message indicates that the number may not be a working number. |
5300--Possible Non-working 4300--Nonworking |
We’re sorry; your call cannot be completed as dialed. If you feel you have reached this recording in error, please check the area code and the number and try your call again. |
This message indicates that the number may not be a working number. |
5300--Possible Non-working 4300--Nonworking |
We’re sorry. Your call cannot be completed as dialed. Please check the number and dial again or call your operator to help you. |
This message indicates that the number may not be a working number. |
5300--Possible Non-working 4300--Nonworking |
The number you are trying to call is not reachable. |
This message indicates that the number may not be a working number. |
5300--Possible Non-working 4300--Nonworking |
Your call has been connected to a vacant number series. Please check the number and dial again or call an operator to assist you. |
This message indicates that the number may not be a working number. |
5300--Possible Non-working 4300-Nonworking |
The number you dialed is not a working number. Please check the number and dial again. |
This message indicates that the number may not be a working number. |
5300--Possible Non-working 4300--Nonworking |
The number or code you have dialed is incorrect. Please check the number or code and try again. |
This message indicates that the number may not be a working number. |
5300--Possible Non-working 4300--Nonworking |
The mobile customer you have dialed has turned the unit off or is outside its service area. |
Note that this message indicates that the call may not be blocked by the respondent but by the lack of phone coverage; therefore, this message still may be coded as a technological barrier. |
5400--Technological Barrier 4400--Technological Barrier |
The subscriber you have dialed is not available or has traveled outside the coverage area. Please try you call again later. |
Note that this message indicates that the call may not be blocked by the respondent but by the lack of phone coverage. Therefore this message still may be coded as a technological barrier. |
5400--Technological Barrier 4400--Technological Barrier |
The person you are calling cannot accept calls at this time. We’re sorry for any inconvenience this may cause. |
The potential respondent could not answer this call, even if he/she wanted to; therefore, it is a technological barrier. |
5400--Technological Barrier 4400--Technological Barrier |
The mobile number you dialed is unavailable. Please try your call again later. |
The potential respondent could not answer this call, even if he/she wanted to therefore it is a technological barrier. |
5400--Technological Barrier 4400--Technological Barrier |
Welcome to (cell phone carrier). The wireless customer you called is not available at this time. Please try your call again later. |
The potential respondent could not answer this call, even if he/she wanted to; therefore, it is a technological barrier. |
5400--Technological Barrier 4400-Technological Barrier |
The person you are trying to reach is not accepting calls at this time. Please try your call again later. |
The potential respondent could not answer this call, even if he/she wanted to therefore it is a technological barrier. |
5400--Technological Barrier 4400--Technological Barrier |
The subscriber is off line. Please call again later. |
The potential respondent could not answer this call, even if he/she wanted to; therefore, it is a technological barrier. |
5400--Technological Barrier 4400--Technological Barrier |
The person you have called is not available right now. Please try again later. |
The potential respondent could not answer this call, even if he/she wanted to therefore it is a technological barrier. |
5400--Technological Barrier 4400- Technological Barrier |
The party you are calling is currently unavailable. |
The potential respondent could not answer this call, even if he/she wanted to; therefore, it is a technological barrier. |
5400--Technological Barrier 4400--Technological Barrier |
The person you have dialed is not able to receive calls at this time. |
The potential respondent could not answer this call, even if he/she wanted to; therefore, it is a technological barrier. |
5400--Technological Barrier 4400- Technological Barrier |
The (cell phone carrier) number you dialed does not subscribe to voicemail services. |
This appears to be a working number without voicemail set up. |
5130--No Answer 3130--No Answer |
The number you have reached has not yet set up voicemail services. |
This appears to be a working number without voicemail set up. |
5130--No Answer |
The mobile customer you have dialed has turned the unit off. |
Because this is a clear message that the call has been blocked by an action of the respondent, it is a telecommunication barrier. |
5150--Telecommunication Barrier 3150--Telecommunication Barrier |
Please enter your PIN to be connected. |
Because this is a clear message that the call has been blocked by an action of the respondent, it is a telecommunication barrier |
5150--Telecommunication Barrier 3150--Telecommunication Barrier |
An answering device is differentiated from a phone circuit message in that it offers the interviewers the possibility to leave a message. In some cases, the answering device indicates that the number dialed has reached a residence. In other cases, messages from answering devices are less specific or seem to indicate that the answering device is attached to a business. Care should be taken to ensure that coding from answering device messages is accurate. Moreover, messages from cell phone sample answering devices are coded differently in some cases than are messages from landline sample answering devices. As in the past, assigning a disposition code for a message from an answering device before the household selection is complete will cause a prompt to be displayed. This prompt asks if the message includes “home,” “house,” “family,” “residence” or a family name. It is important to answer this question correctly.
The table below explains the coding for the four answering device codes.
Table 2 Assigning Codes for Answering Devices |
||
Message |
Comment |
Code |
|
|
|
A message may/may not indicate that the number is a household in the landline telephone sample. For cell phone sample numbers use this code on all answering devices where you can leave a message. |
Assign if answering device permits the interviewer to leave a message, without indication of whether the number is connected to a household or business. Assign if answering device is reached on the cell phone sample. |
3140--Answering device, unknown whether eligible 5140--Answering device, unknown whether eligible |
The answering device indicates that the mailbox is full without indication of household status in the landline telephone sample number. Use this code for all cell phone answering devices where the mailbox is full. |
Even though the interviewer cannot leave a message on this call, there is still potential for leaving a message on this device. Follow rules for household status on landline telephone devices. |
3140-Answering device, unknown whether eligible 5140- Answering device, unknown whether eligible |
Appendix D: Uploading BRFSS Data Using OneEdits
Using OneEdits 2015
out update to the program
15 years helped in improving editing process

New Features of OneEdits2015
Landline and Cell Phone survey in one software survey in one
Includes a feature that allows ‘Resume Editing’ ‘Resume Editing’
Allows Users to “Hide Errors” Hide Errors
––Help in temporarily suppressing errors (avoid crowding) to focus on other problems on other problems
––Can be reactivated
Global field value replacement field value replacement
––Value of a particular field across the dataset can be replaced in one action
Appropriate error messages error messages
––Allows users to fix problems at their end users to fix problems at their end
Default Folder Structure
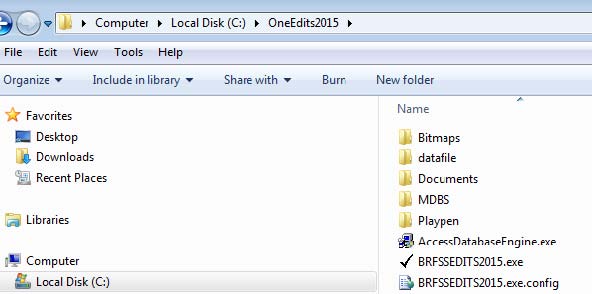
Datafile––Keep original .dattfile
Playpen ––OneEdits keeps duplicate file there and make changes there duplicate file there and make changes there
Select Survey
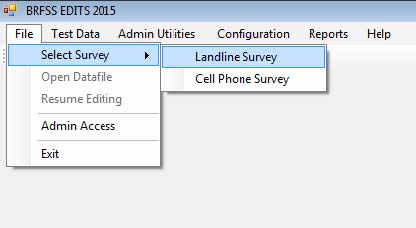
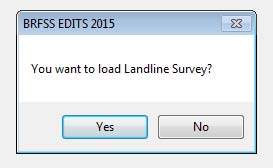
Select data file
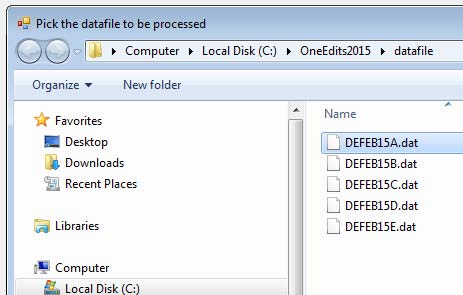
Select file from Datafile folder
Save selected data file….
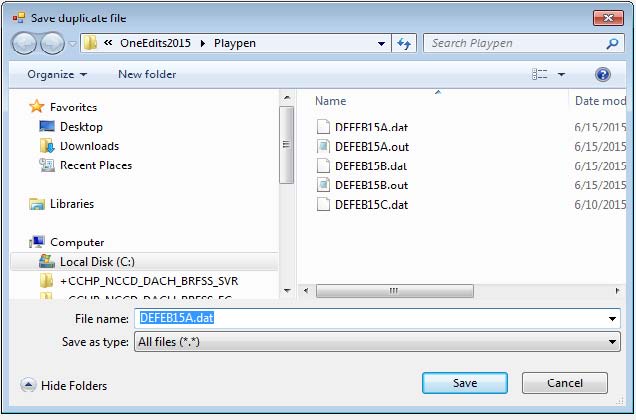 Save
selected file in playpen folder. Keep filename same as original file.
in playpen folder. Keep filename same as original file.
Screening Results ….
Basic screening run results, good place to verify if selected modules have data.ve data.
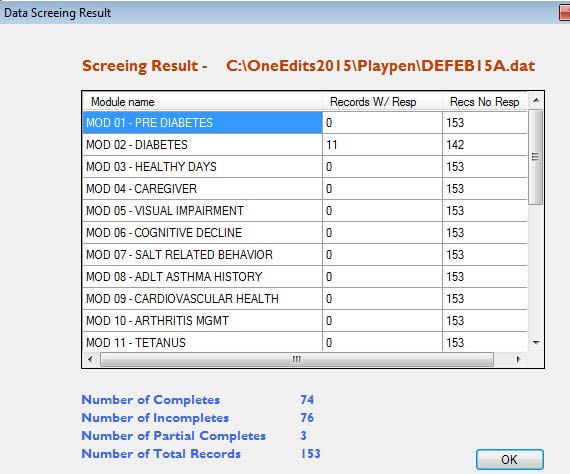
Screening Results ….
Test Dataset T--> Run Edits menu would run edits on selected dataset.> Run Edits menu would run edits on selected dataset.
Good place to review modules being run and see if that matches with what state intended to collect. state intended to collect.

Edits Result ….
Test Dataset --> View Data menu would show edits run results. Data can be modified here in real time. Data can be modified here in real time.

Ignore Errors….
This is where repeating errors can be suppressed temporarily to focus on other errors.
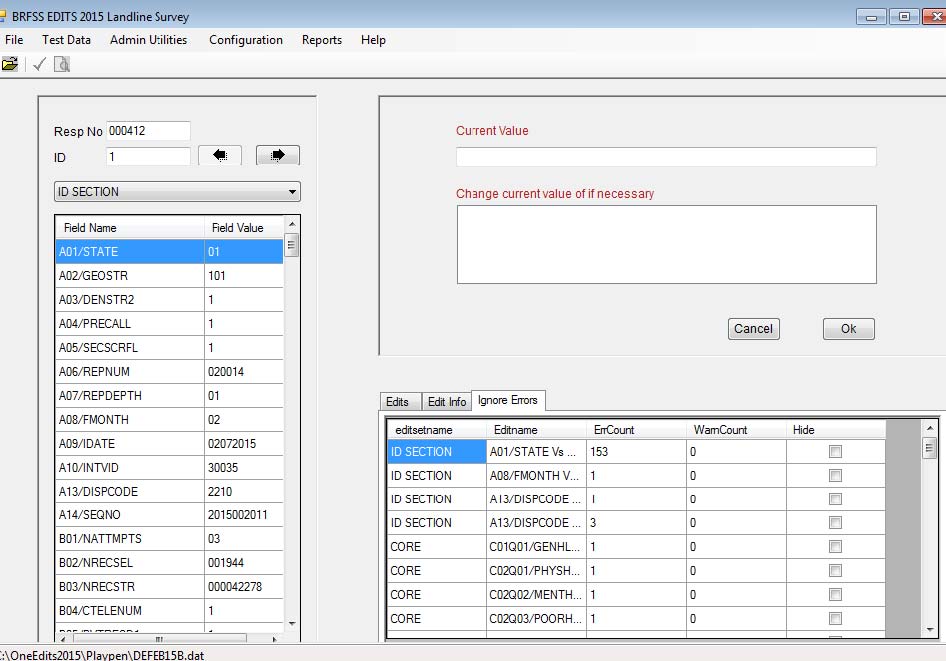
Resume Edits….
Select ‘No’ while quitting application if user
wants to resume editing in future.
File --> Select Survey and File --> Resume Editing would allow > Resume E resumption of editing.
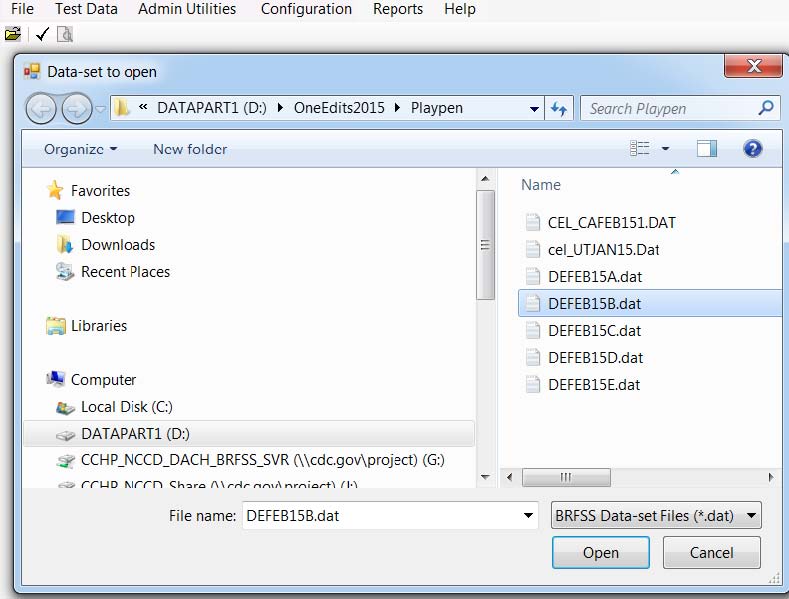
F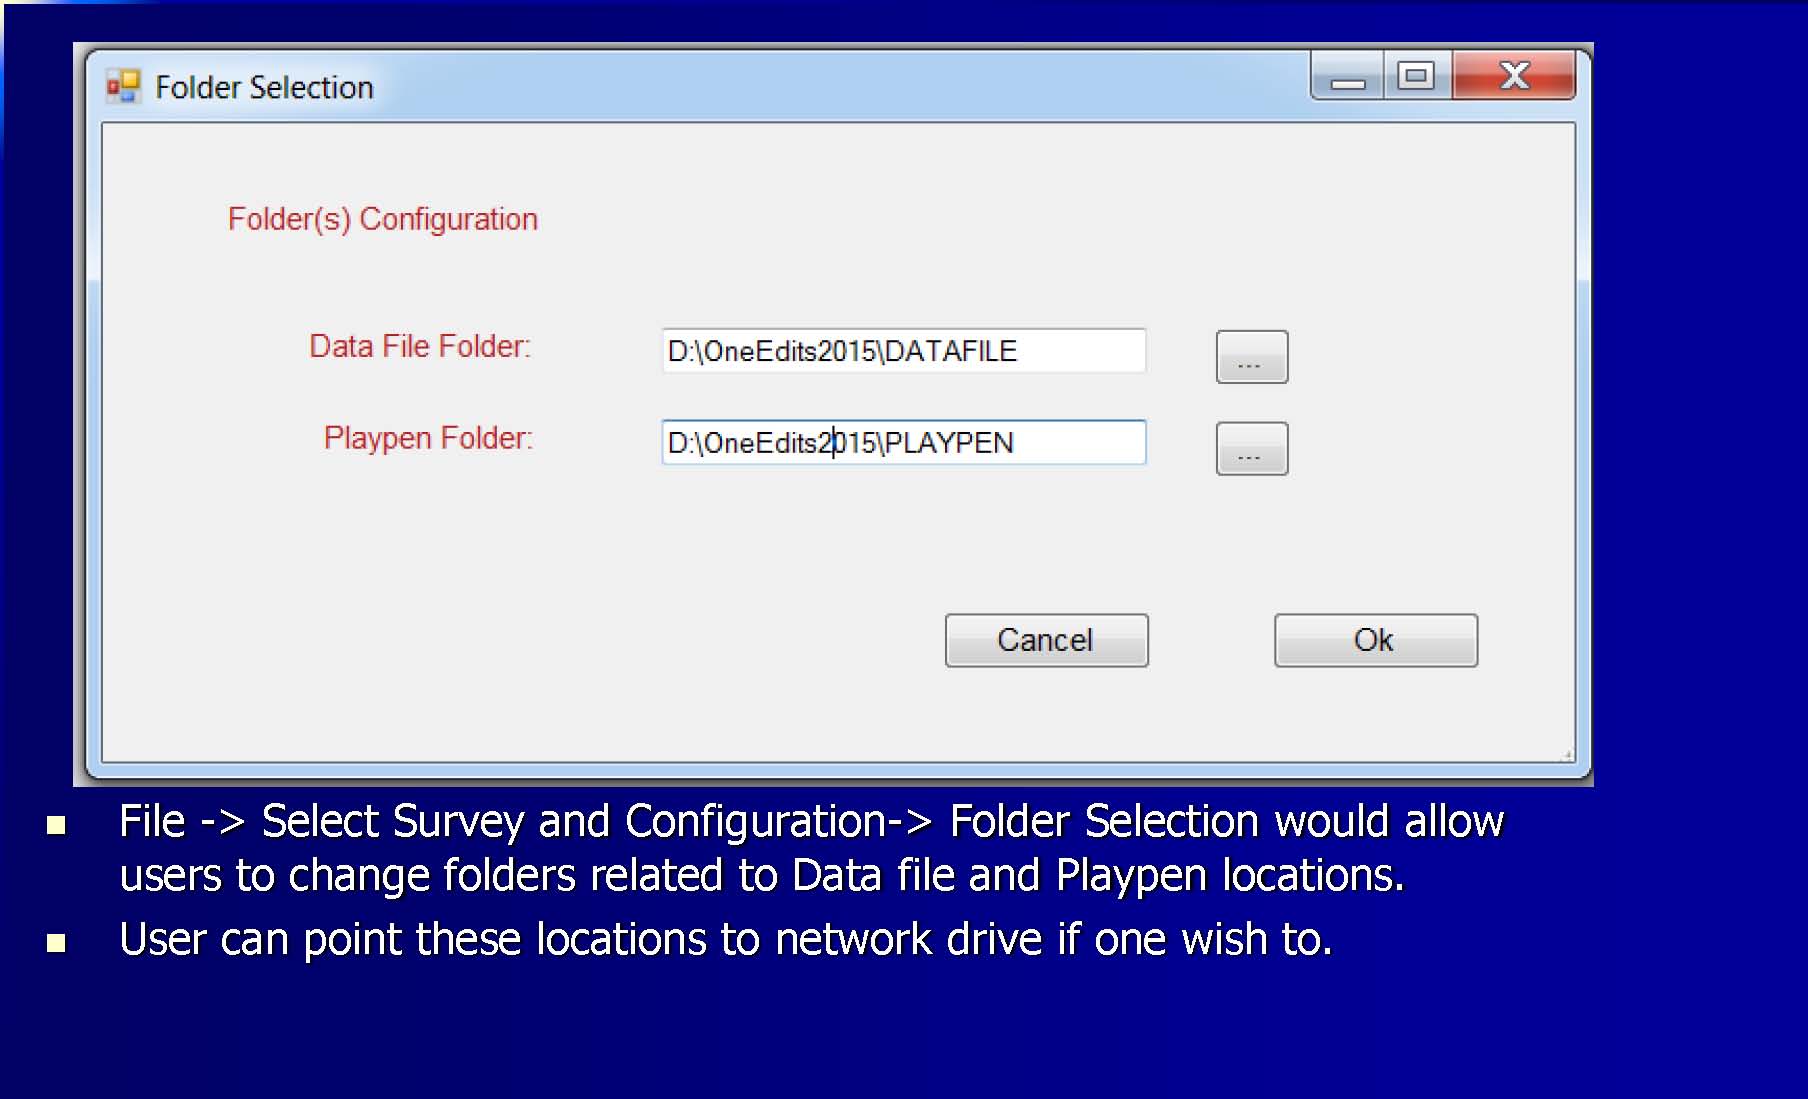 ile
-->
Select Survey and Configuration
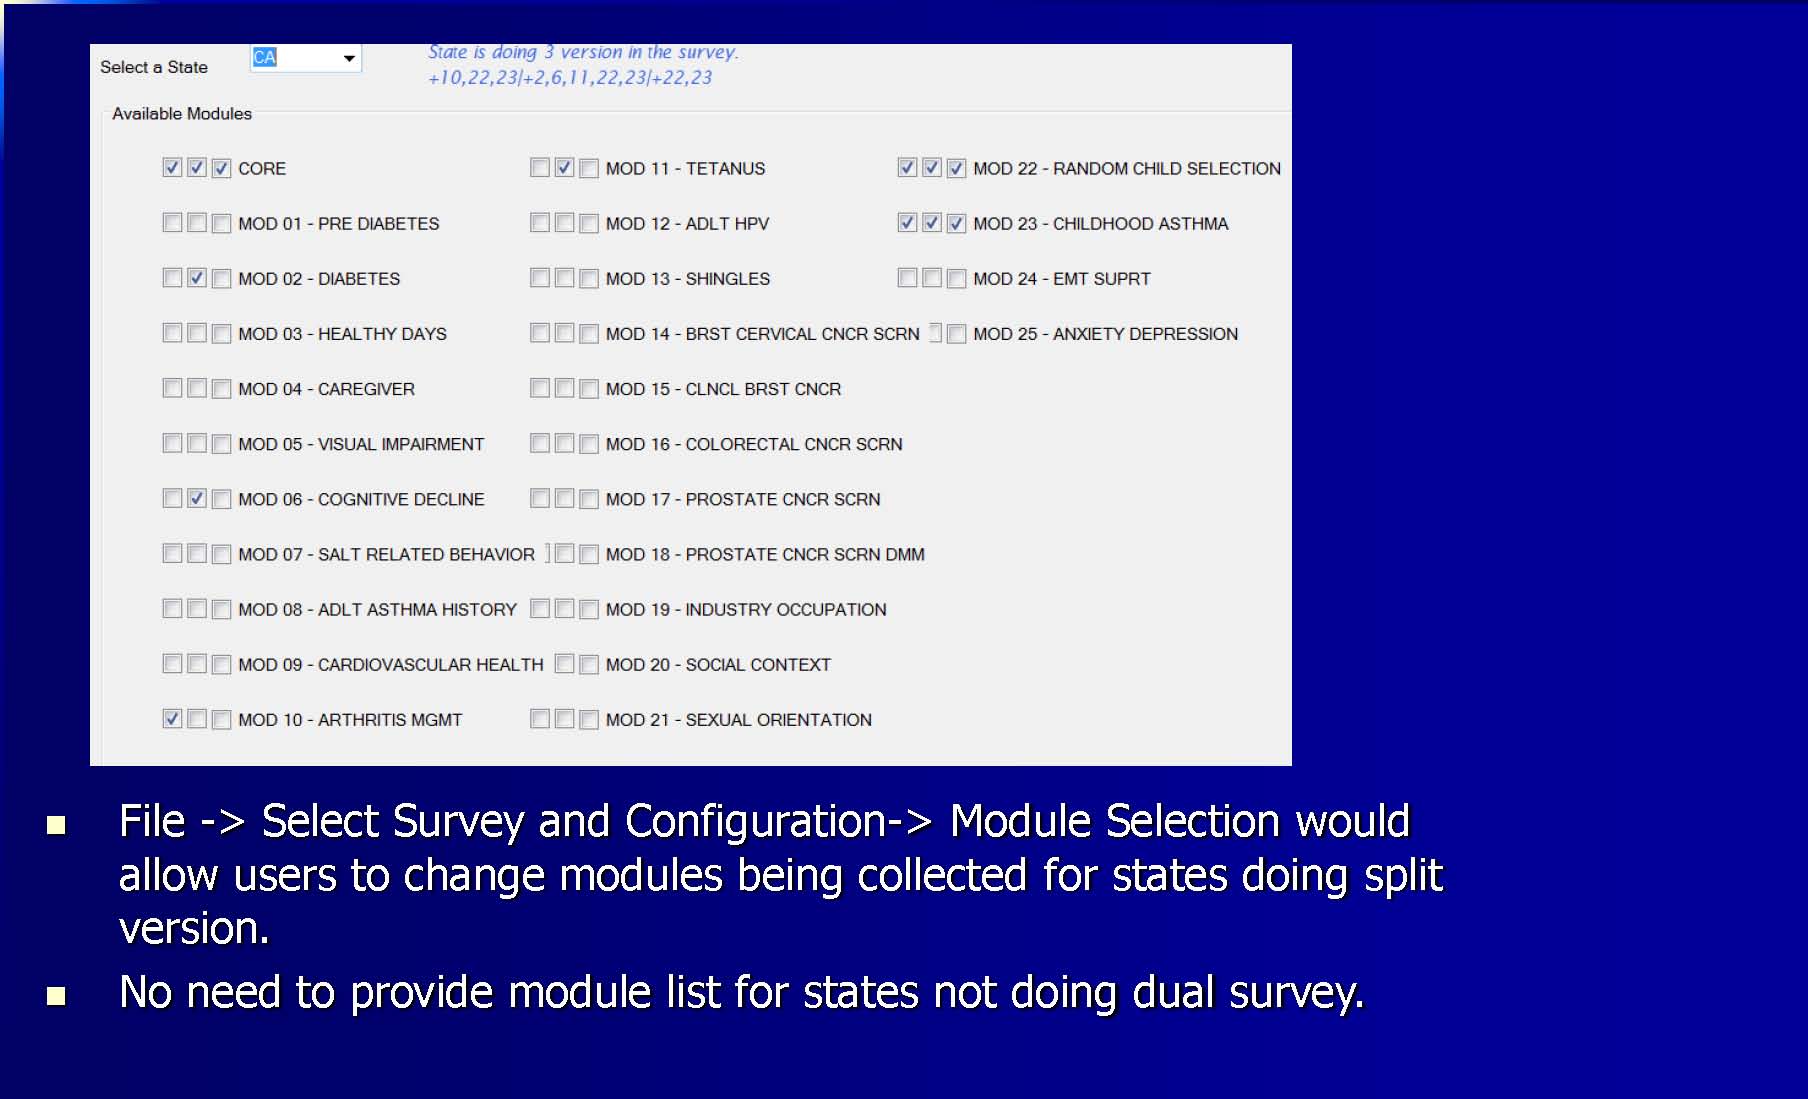 odule
Selection….
F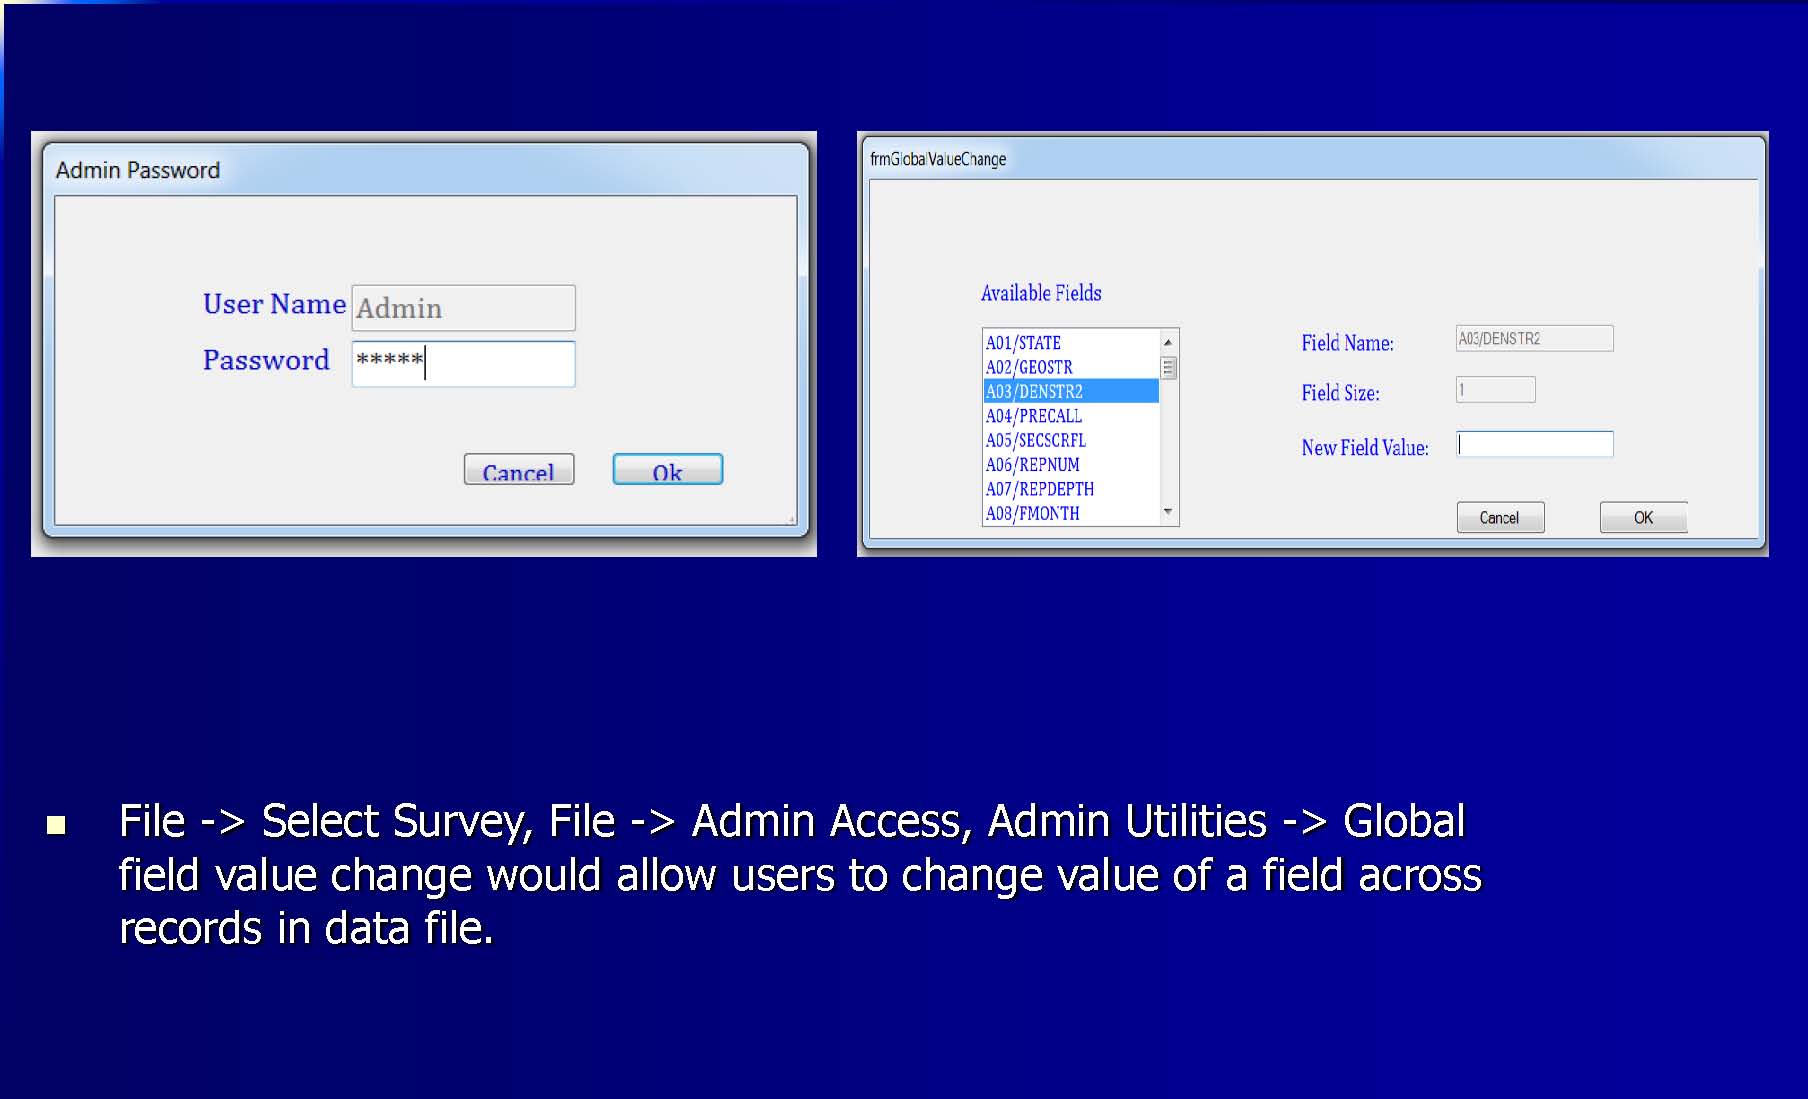 ile
-->
Select Survey, File -->
Admin Access, Admin
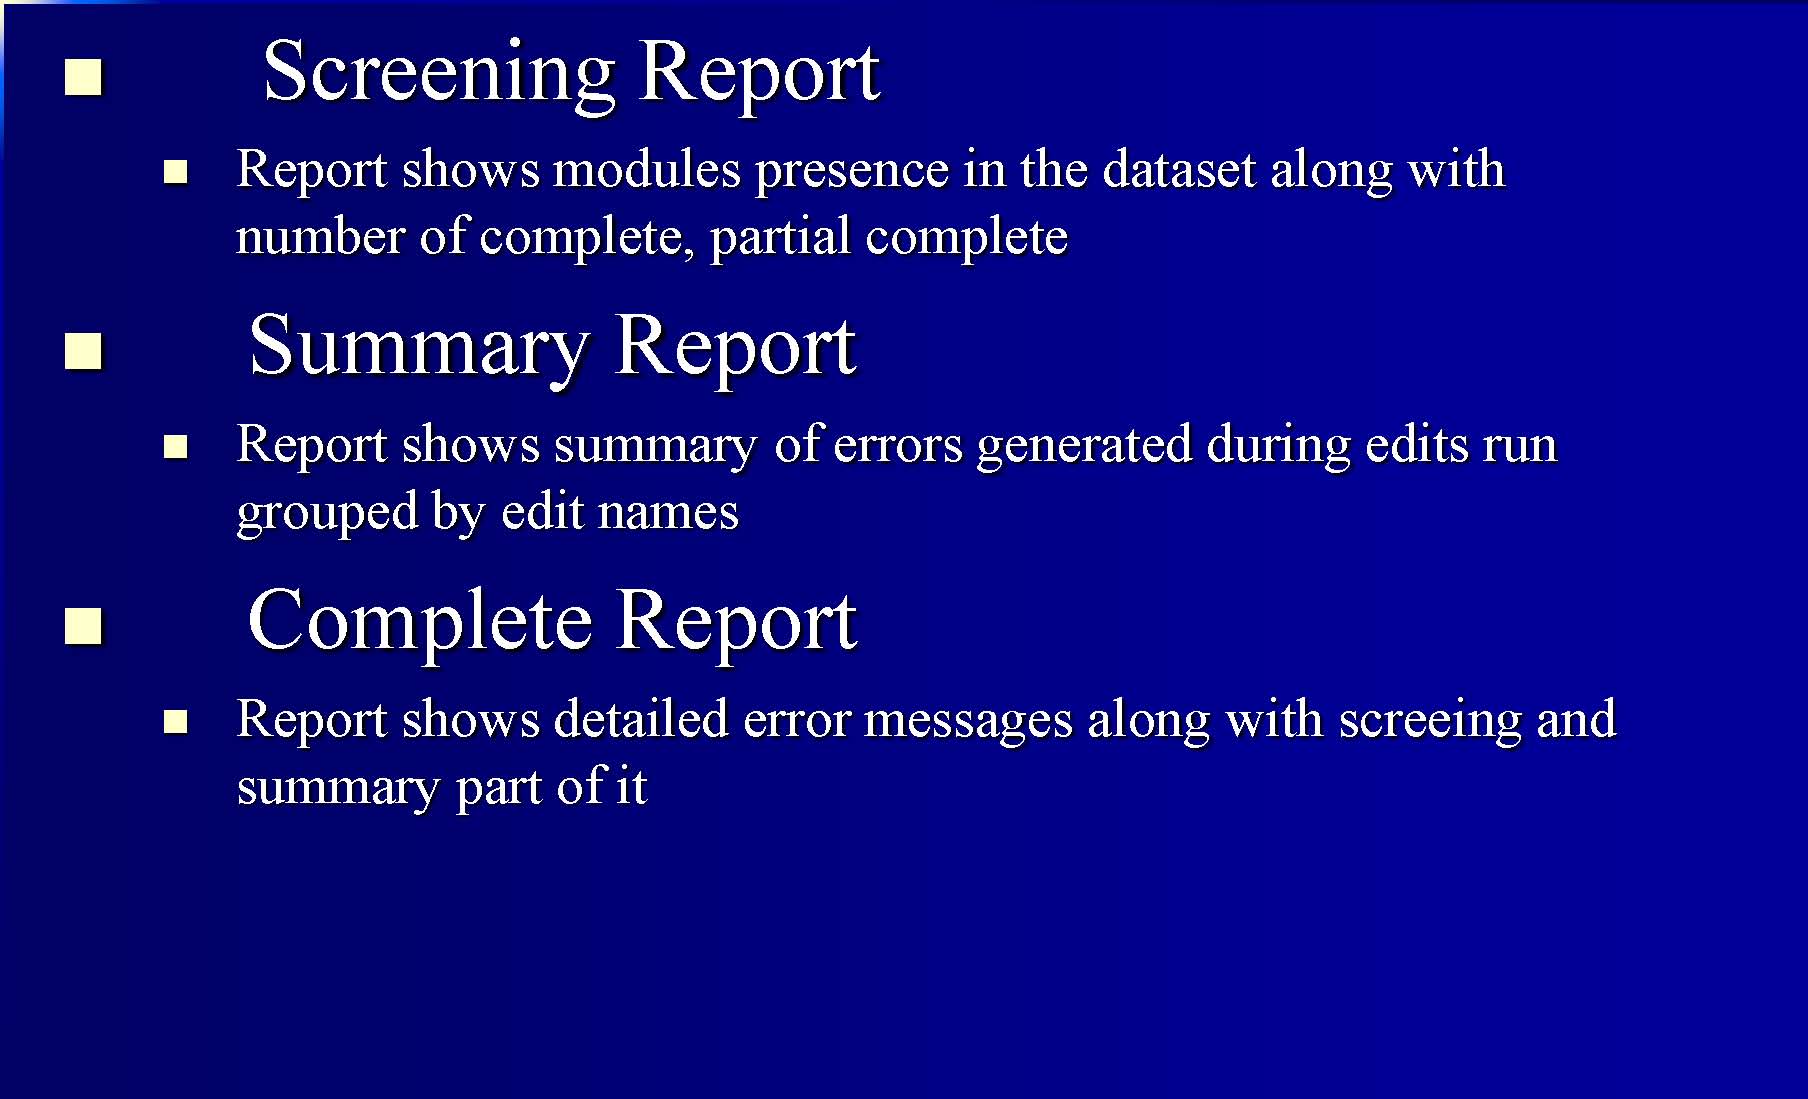 eports
…
Error Messages
This message will show up if selected data file has missing data for any one of the fields mentioned in error message.one of the fields mentioned in error message.

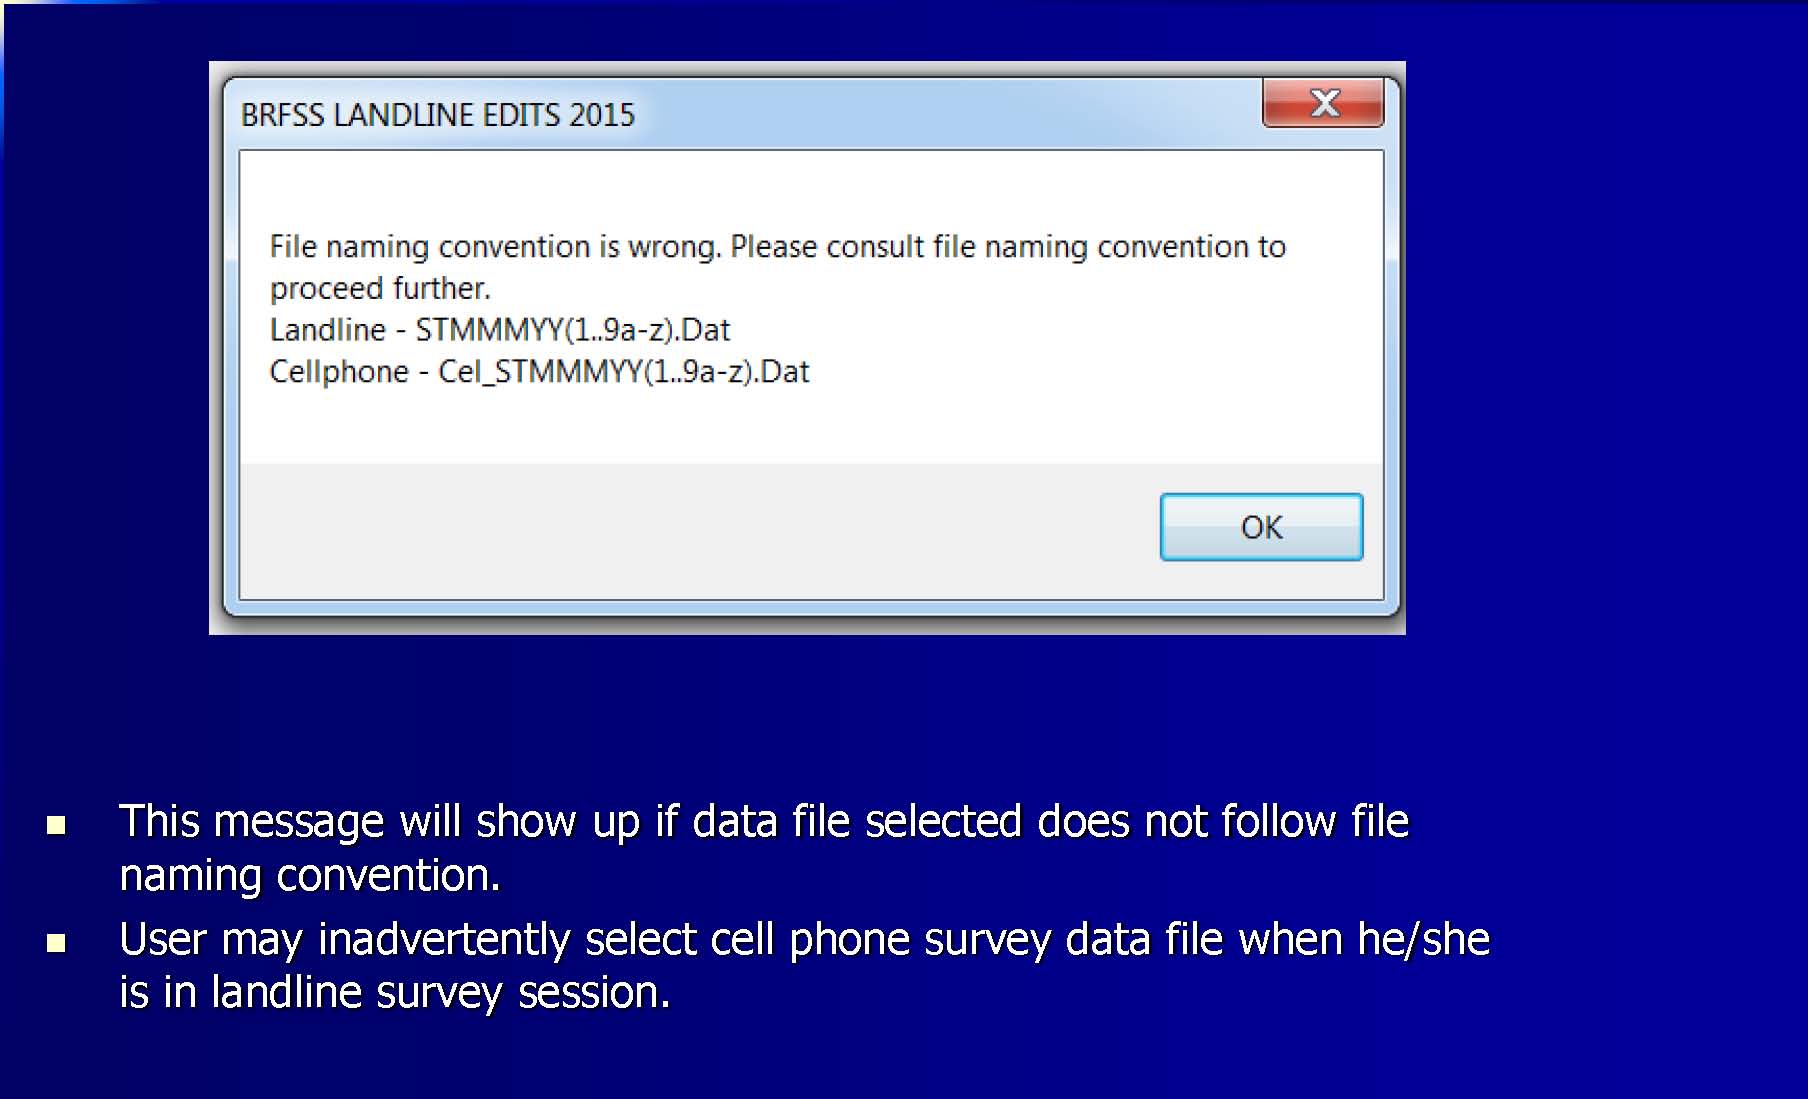

As with any software, there may be unexpected errors.
If you continue to experience problems with OneEdits, please contact Ajay Sharma [email protected] or Bill Garvin [email protected].
Appendix E: BRFSS State Data Submit File Process
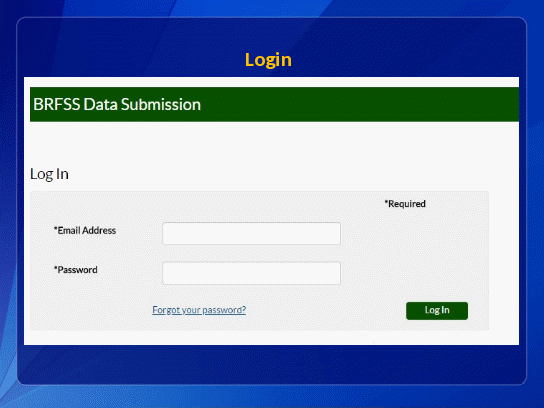
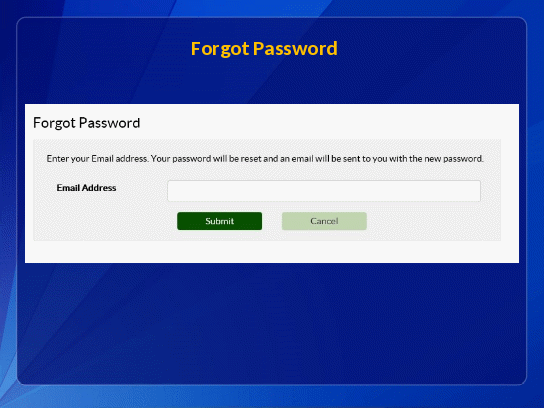
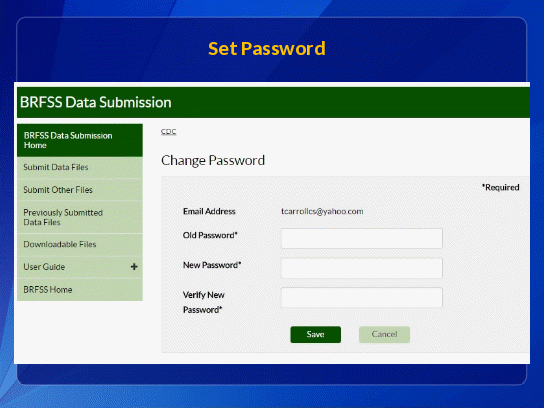
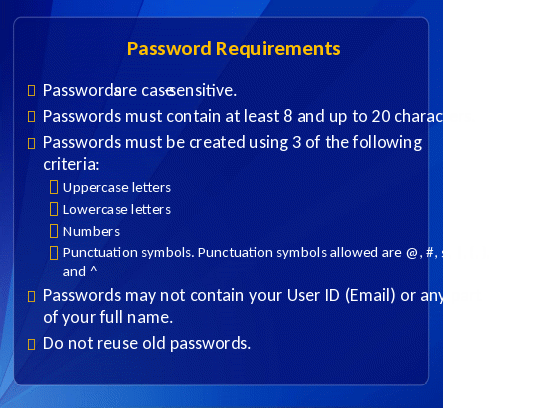
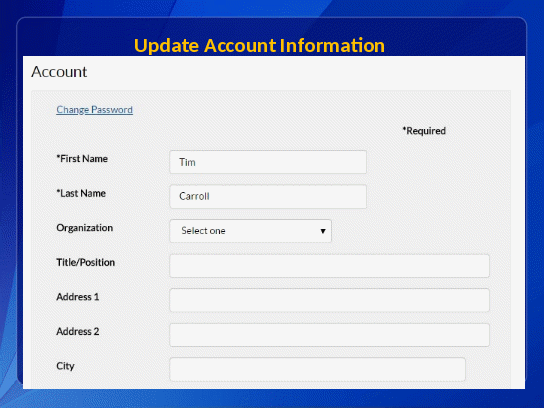
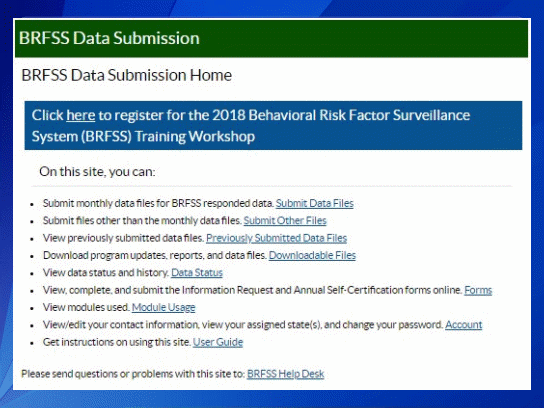
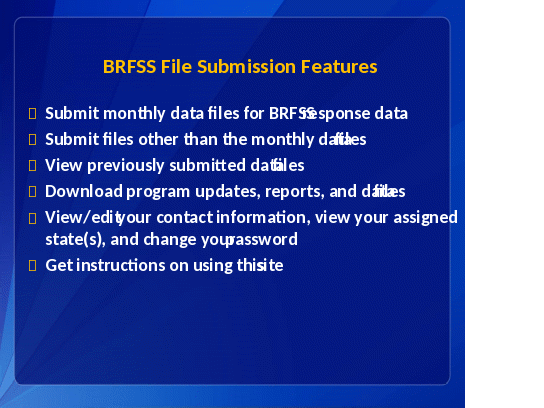
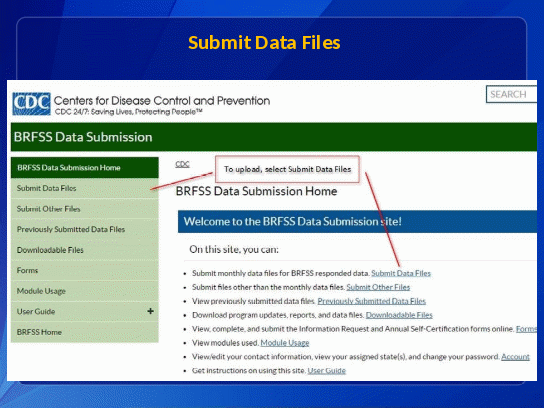
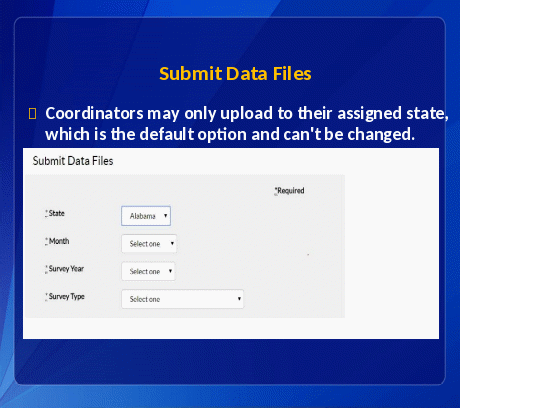
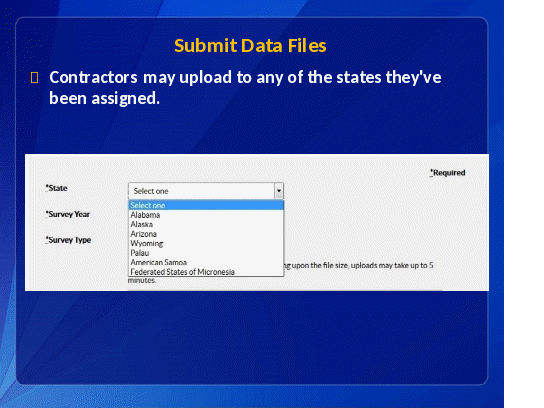
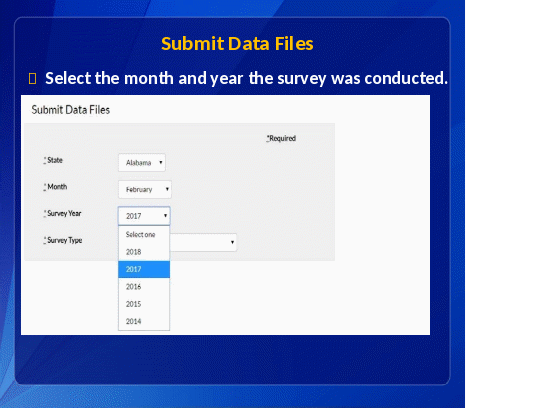
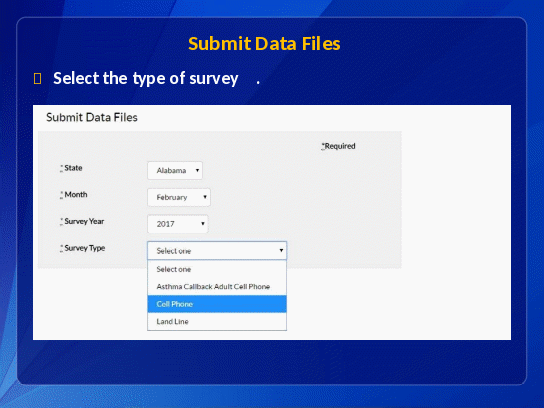
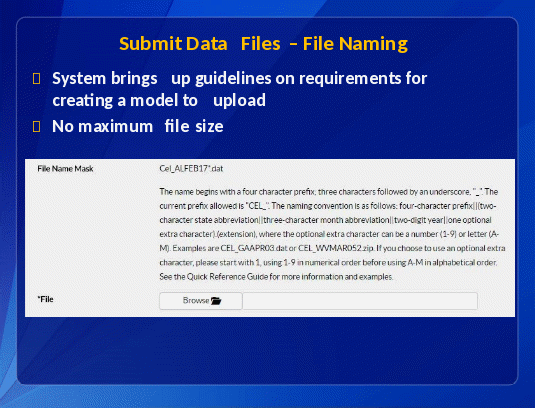
Submit Data Files – File Naming
File names conform to the following convention:
4
 character prefix, consisting of three letters describing the type of
survey, followed by an underscore (see table below)
character prefix, consisting of three letters describing the type of
survey, followed by an underscore (see table below)Two character state abbreviation; i.e. Georgia = GA
Three character abbreviation for the month
Two-digit year
An optional one-digit number or letters, 1-9.
Example:
AAC_GAMAY14.dat
Survey for Asthma Callback Adult Cellphone for Georgia, May, 2014
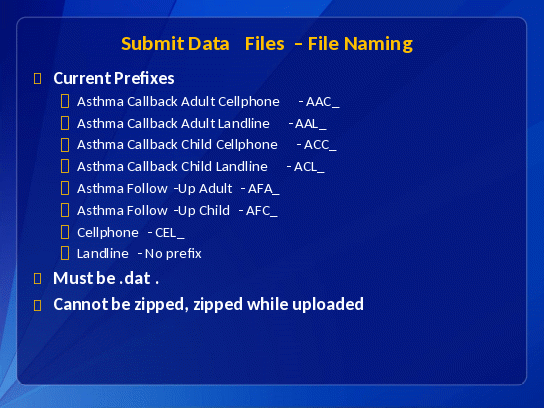
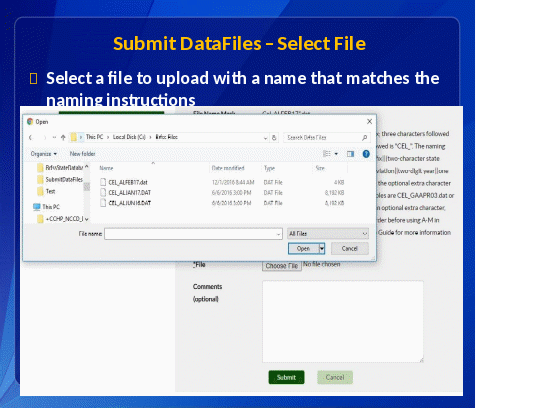
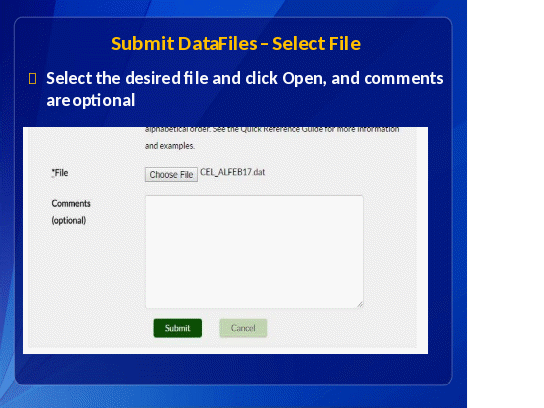
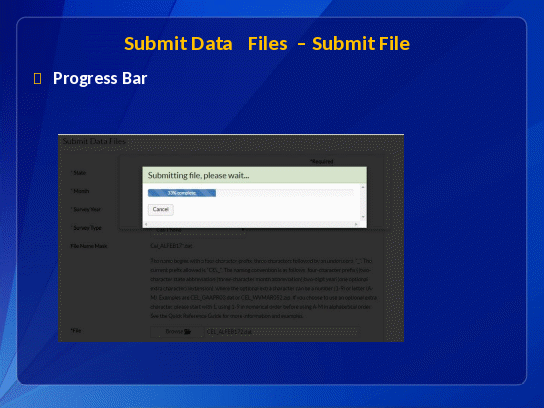
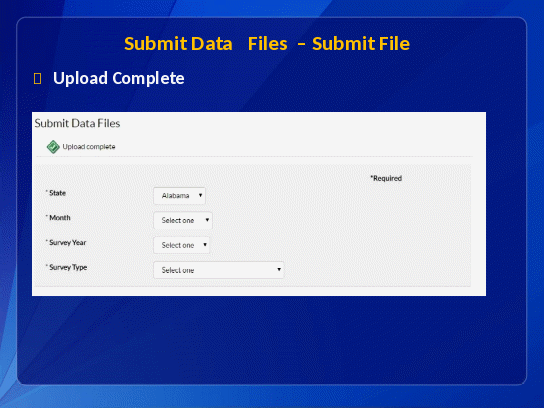
Submit Data Files – Errors
The selected survey does not match the 3 character survey prefix in the file name AAC_GAJUN16.DAT
The prefix before the underscore (AAC_GAJUN16.DAT ) must match the required prefix for the survey type
The selected state does not match the 2 character state in the file name AAC_GAJUN16.DAT.
The state code (AAC_GAJUN16.DAT) must match the state selected
The selected month does not match the 3 character month in the file name AAC_GAJUN16.DAT.
The month code (AAC_GAJUN16.DAT) must match that of the month selected
T
 he
selected year does not match the 2 digit year in the file name
AAC_GAJUN16.DAT.
The year (AAC_GAJUN16.DAT) must match that of the year selected
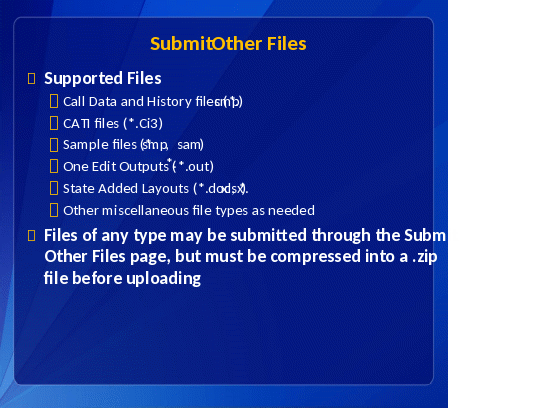
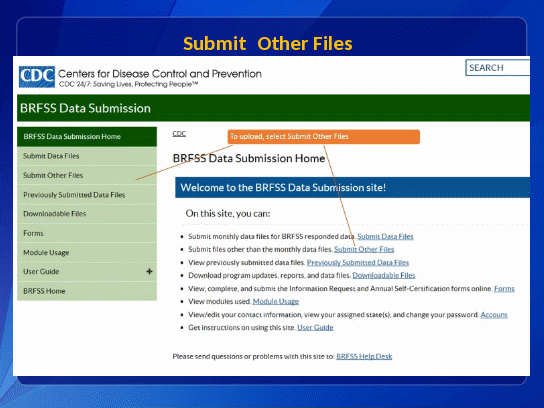
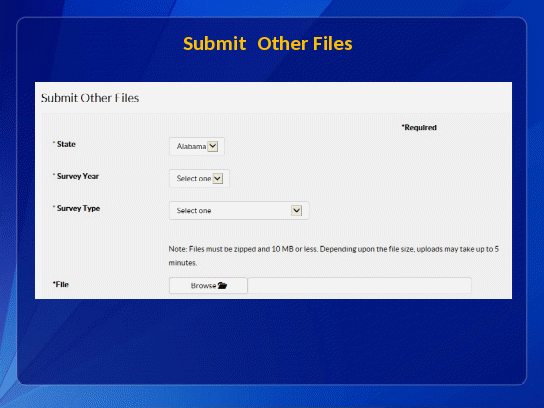
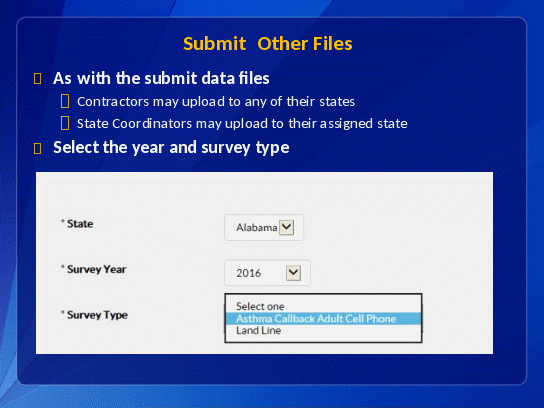
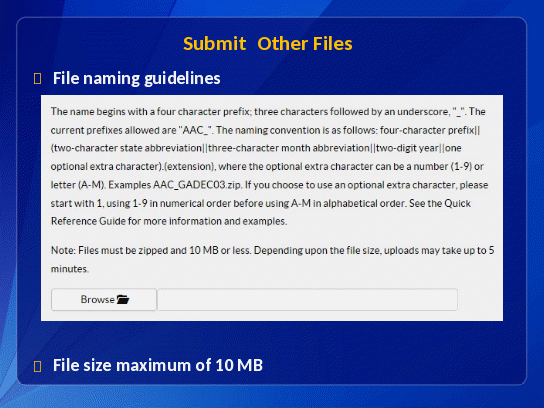
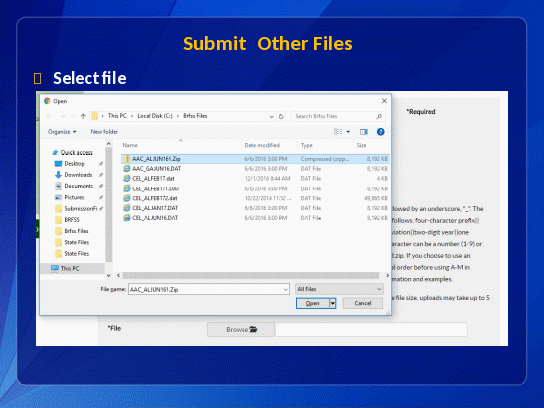
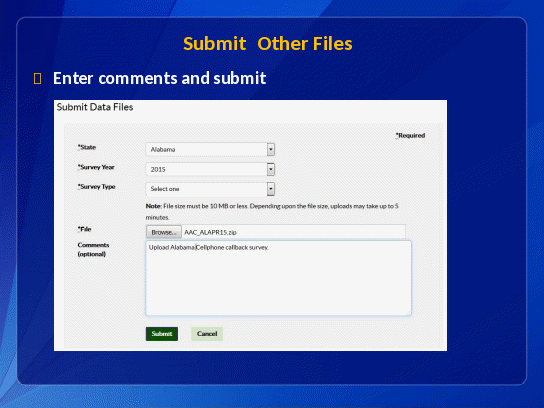
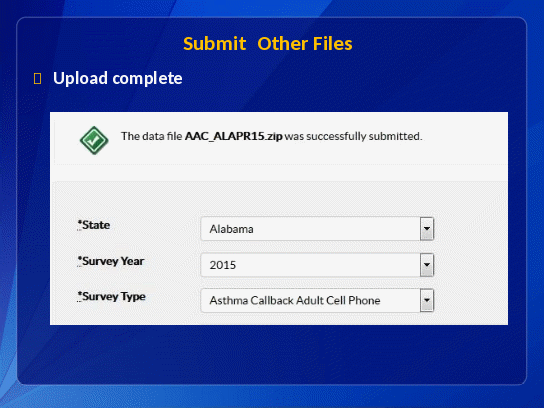
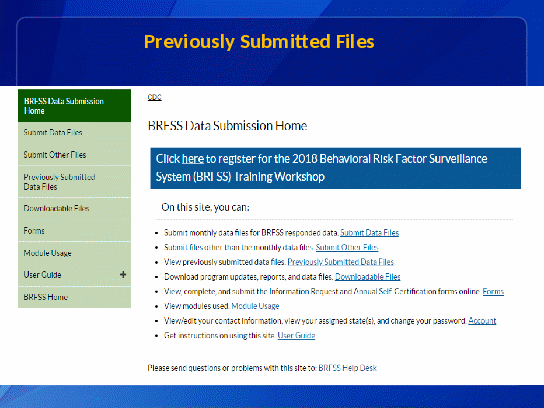
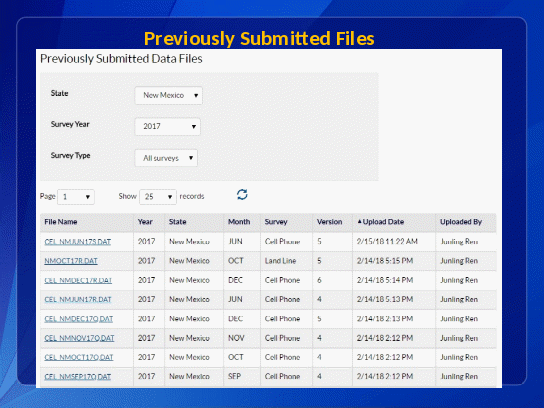
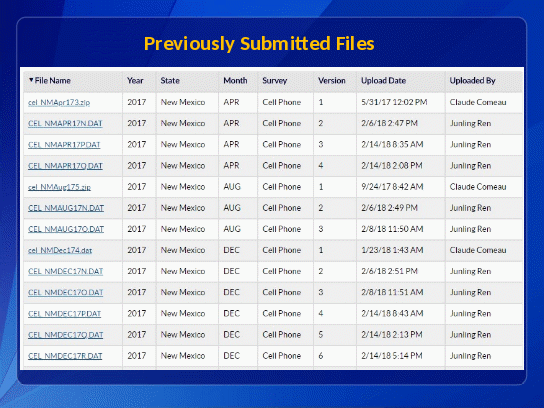
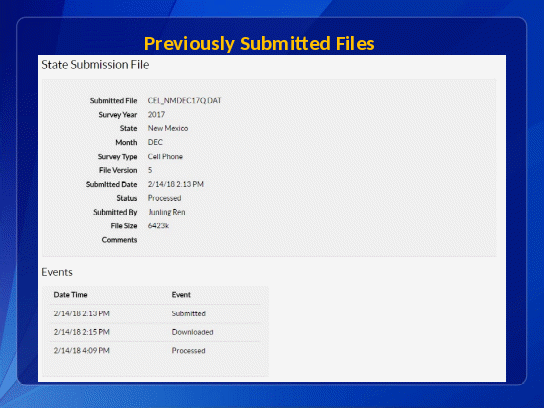
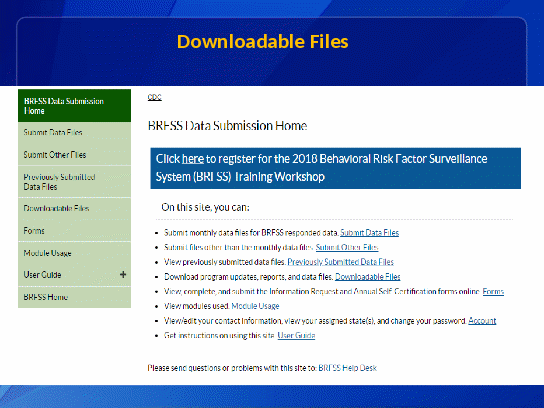
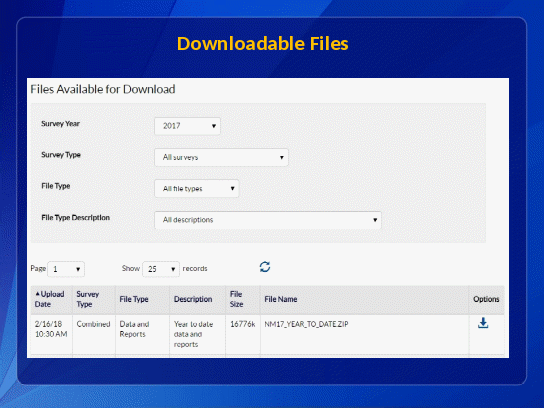
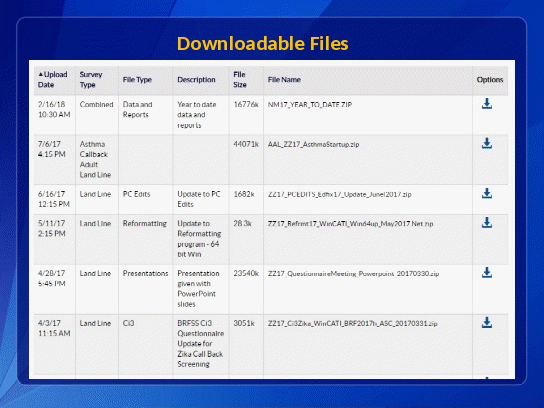
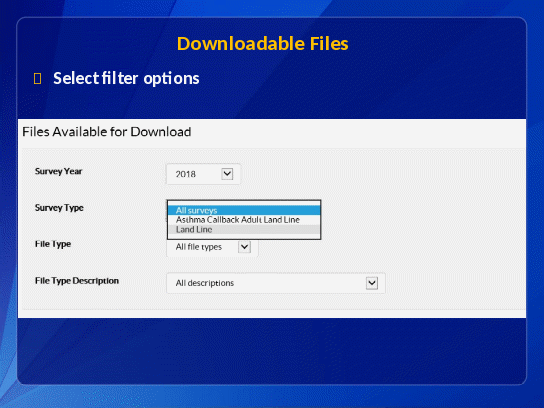
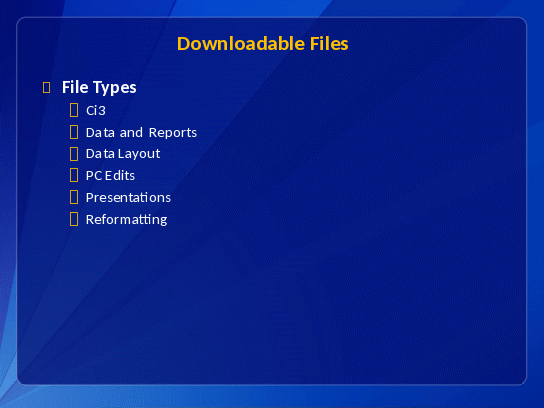
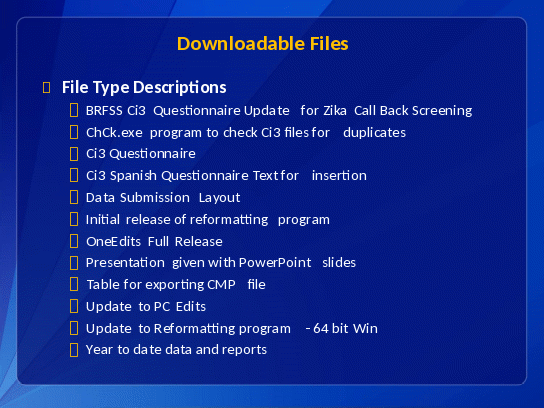
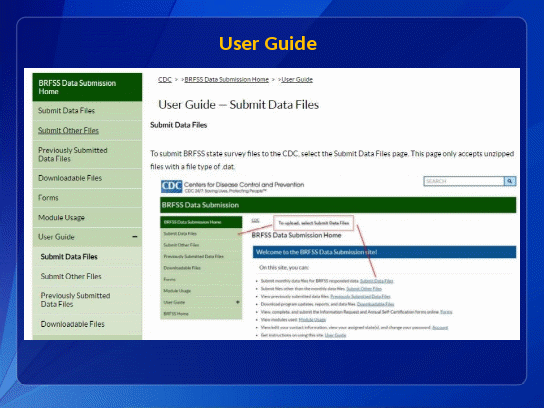
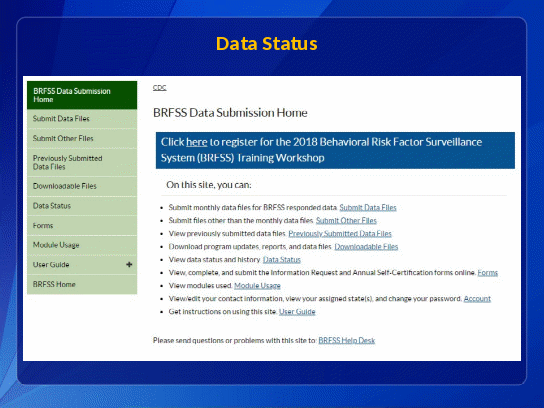
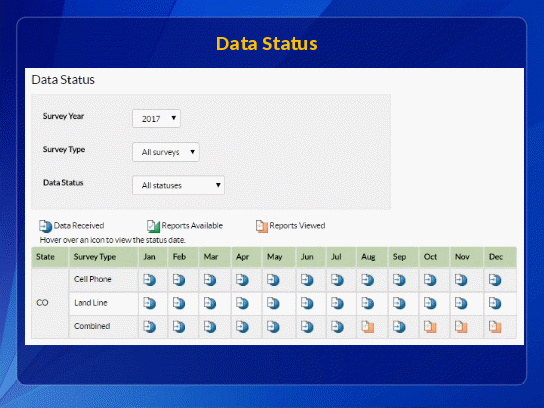
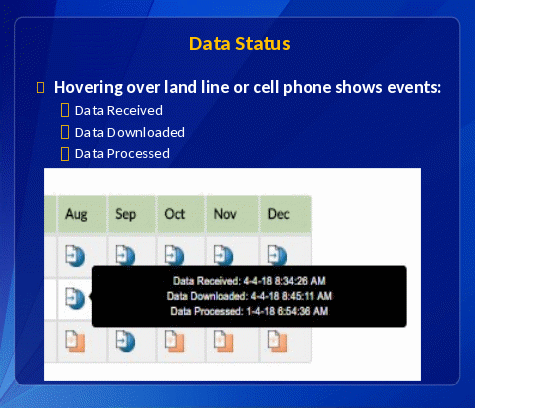
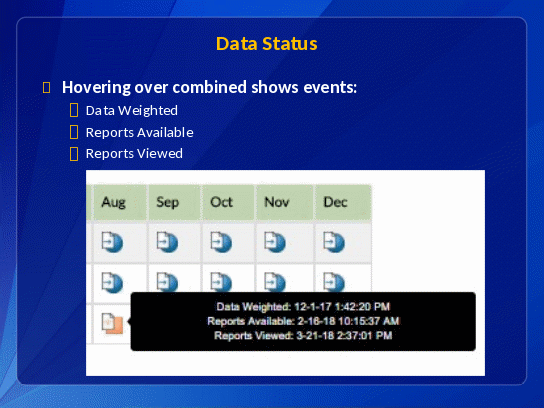
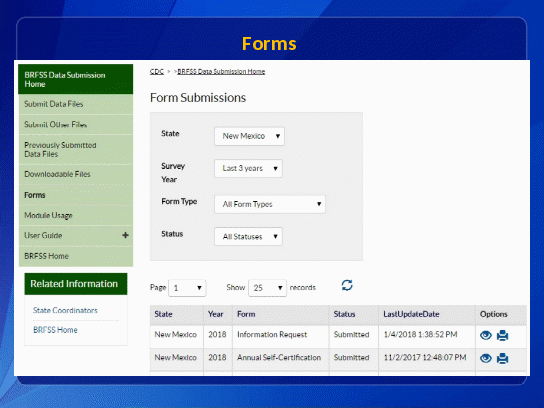
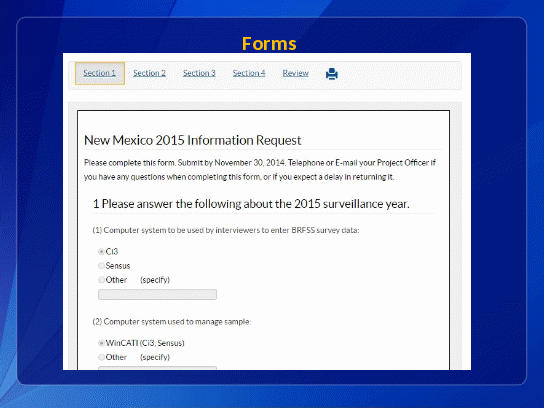
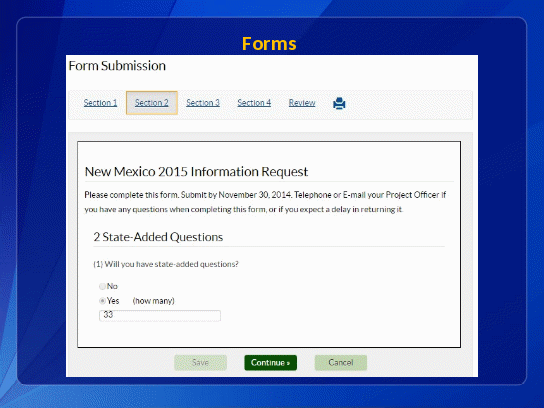
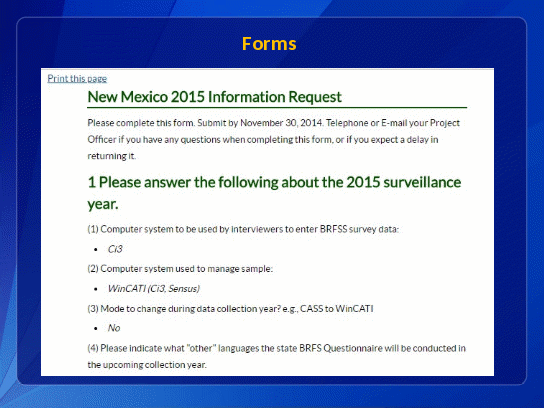
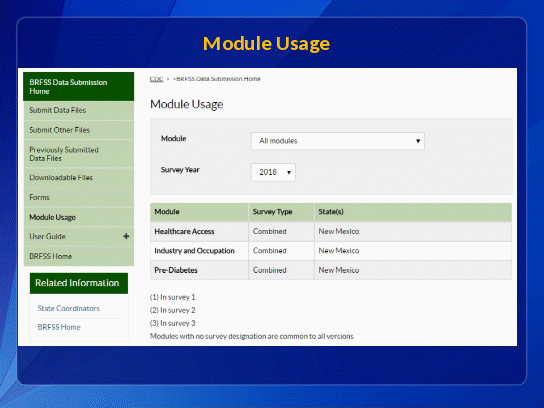
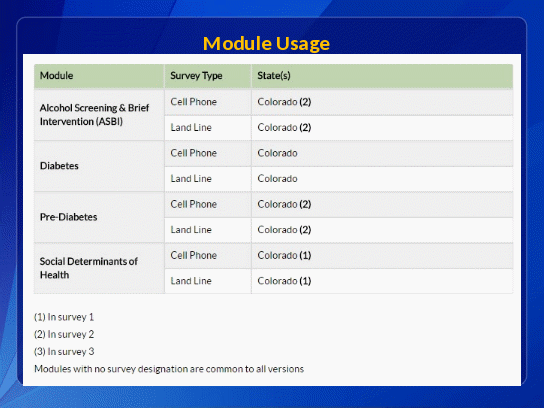
Appendix F: Understanding the YTD Data Quality Reports
2017 State Data Quality Reports
Rick Anderson Senior SAS Programmer
Northrop Grumman
SAMPLE BEHAVIORAL RISK FACTOR SURVEILLANCE SYSTEM, DATA QUALITY REPORT FOR 2017 Definitions of Variables
File Month. |
Each data file submitted to CDC contains the name of a month in the filename. The “January” file month contains the January sample. |
Household Roster Status. |
|
|
|
|
Density Strata (Landline only). |
Categorized as Listed (published dataset) or Not listed one-plus block. |
Disposition Code Eligibility Categories. |
Completed Interviews (COIN) = 1100+1200 |
Eligible (ELIG) = 1100+1200+2111+2112+2120+2220+2320+2330 |
Contacted Eligible (CONELIG) = 1100+1200+2111+2112+2120+2320+2330 |
Known Households (HH) = 1100+1200+2111+2112+2120+2210+2320+2330+3200+3700 |
Terminations and Refusals (TERE) = 2111+2112+2120 |
Ineligible Phone Numbers (INELIG) = All 4000 Disposition Codes |

SAMPLE BEHAVIORAL RISK FACTOR SURVEILLANCE SYSTEM, DATA QUALITY REPORT FOR 2017 |
||
|
2017 Fina |
l Disposition Codes |
Category |
Disposition Codes |
Description |
Completed Interviews |
1100 |
Complete |
|
1200 |
Partial Complete |
Non completed, known eligible |
2111 |
Household level refusal |
|
2112 |
Known respondent refusal |
|
2120 |
Breakoff/termination within questionnaire |
|
2210 |
Respondent never available |
|
2220 |
Household answering device (landline only) |
|
2320 |
Respondent physically or mentally unable to complete interview |
|
2330 |
Language barrier, selected respondent |
Non completed, unknown eligibility |
3100 |
Unknown if housing unit |
|
3130 |
No answer |
|
3140 |
Answering device, unknown if residence or respondent eligible |
|
3150 |
Telecommunication barrier |
|
3200 |
Household, not known if respondent eligible |
|
3330 |
Language barrier (household level) |
|
3322 |
Physical or mental impairment (household level) |
|
3700 |
On never call list |
Ineligible |
4100 |
Out of sample |
|
4200 |
Fax/data/modem |
|
4300 |
Nonworking number/disconnected |
|
4400 |
Special technological circumstances |
|
4430 |
Call forwarding/pager |
|
4450 |
Cell phone (landline only) |
|
4460 |
Landline (cell phone only) |
|
4500 |
Non-residence |
|
4510 |
Group home |
|
4700 |
Household no eligible respondent |
|
4900 |
Miscellaneous, non-eligible |
2017 Year-To-Date Data Quality Report |
Section I: Sample Generation, Release, and Submission |
Table 1. Density Stratum By File Month |
(Landline only) |
|
Density Stratum |
|||||
|
Listed |
Not listed One-Plus Block |
Not Applicable |
|||
File Month |
Number |
Percent |
Number |
Percent |
Number |
Percent |
January |
5,193 |
34.41 |
9,897 |
65.59 |
|
|
February |
5,193 |
34.41 |
9,897 |
65.59 |
|
|
March |
11,646 |
34.54 |
22,074 |
65.46 |
|
|
April |
9,044 |
30.61 |
20,506 |
69.39 |
|
|
May |
9,044 |
30.61 |
20,506 |
69.39 |
|
|
June |
9,044 |
30.61 |
20,506 |
69.39 |
|
|
July |
7,905 |
30.36 |
18,135 |
69.64 |
|
|
August |
7,905 |
30.36 |
18,135 |
69.64 |
|
|
September |
7,905 |
30.36 |
18,135 |
69.64 |
|
|
October |
8,561 |
29.73 |
20,239 |
70.27 |
|
|
November |
9,008 |
29.76 |
21,262 |
70.24 |
|
|
December |
8,561 |
29.73 |
20,239 |
70.27 |
|
|
2017 Year-To-Date Data Quality Report |
Section I: Sample Generation, Release, and Submission |
Table 2A. Number of Records in Replicate by File Month |
(Landline only) |
Replicates with Number of Records => (sent to the CDC) |
||||||
|
Less than 30 |
Equal to 30 |
Greater than 30 |
|||
File Month |
Number |
Percent |
Number |
Percent |
Number |
Percent |
January |
0 |
0.00 |
503 |
100.00 |
0 |
0.00 |
February |
0 |
0.00 |
503 |
100.00 |
0 |
0.00 |
March |
0 |
0.00 |
1124 |
100.00 |
0 |
0.00 |
April |
0 |
0.00 |
985 |
100.00 |
0 |
0.00 |
May |
0 |
0.00 |
985 |
100.00 |
0 |
0.00 |
June |
0 |
0.00 |
985 |
100.00 |
0 |
0.00 |
July |
0 |
0.00 |
868 |
100.00 |
0 |
0.00 |
August |
0 |
0.00 |
868 |
100.00 |
0 |
0.00 |
September |
0 |
0.00 |
868 |
100.00 |
0 |
0.00 |
October |
0 |
0.00 |
960 |
100.00 |
0 |
0.00 |
November |
0 |
0.00 |
1009 |
100.00 |
0 |
0.00 |
December |
0 |
0.00 |
960 |
100.00 |
0 |
0.00 |
2017 Year-To-Date Data Quality Report |
||||||
Section I: Sample Generation, Release, and Submission |
||||||
Table 2B. Number of Records in Replicate by File Month |
||||||
(Cell Phone only) |
||||||
Replicates with Number of Records => (sent to the CDC) |
||||||
|
Less than 30 |
Equal to 30 |
Greater than 30 |
|||
File Month |
Number |
Percent |
Number |
Percent |
Number |
Percent |
January |
0 |
0.00 |
208 |
100.00 |
0 |
0.00 |
February |
0 |
0.00 |
206 |
100.00 |
0 |
0.00 |
March |
0 |
0.00 |
207 |
100.00 |
0 |
0.00 |
April |
0 |
0.00 |
196 |
100.00 |
0 |
0.00 |
May |
0 |
0.00 |
195 |
100.00 |
0 |
0.00 |
June |
0 |
0.00 |
196 |
100.00 |
0 |
0.00 |
July |
0 |
0.00 |
206 |
100.00 |
0 |
0.00 |
August |
0 |
0.00 |
206 |
100.00 |
0 |
0.00 |
September |
0 |
0.00 |
207 |
100.00 |
0 |
0.00 |
October |
0 |
0.00 |
426 |
100.00 |
0 |
0.00 |
November |
0 |
0.00 |
431 |
100.00 |
0 |
0.00 |
December |
0 |
0.00 |
292 |
100.00 |
0 |
0.00 |
![]()
![]()
![]()
![]()
![]()
![]()
![]()
![]()


Interview Month |
File Month |
|||||||||||||||||||||||
January |
February |
March |
April |
May |
June |
July |
August |
September |
October |
November |
December |
|||||||||||||
N |
% |
N |
% |
N |
% |
N |
% |
N |
% |
N |
% |
N |
% |
N |
% |
N |
% |
N |
% |
N |
% |
N |
% |
|
January |
12,468 |
82.6 |
|
|
|
|
|
|
|
|
|
|
|
|
|
|
|
|
|
|
|
|
|
|
February |
2,622 |
17.4 |
14,913 |
98.8 |
4 |
|
|
|
|
|
|
|
|
|
|
|
|
|
|
|
|
|
|
|
March |
|
|
177 |
1.2 |
33,647 |
99.8 |
|
|
|
|
|
|
|
|
|
|
|
|
|
|
|
|
|
|
April |
|
|
|
|
69 |
0.2 |
29,497 |
99.8 |
|
|
|
|
|
|
|
|
|
|
|
|
|
|
|
|
May |
|
|
|
|
|
|
53 |
0.2 |
24,704 |
83.6 |
|
|
|
|
|
|
|
|
|
|
|
|
|
|
June |
|
|
|
|
|
|
|
|
4,846 |
16.4 |
29,532 |
99.9 |
|
|
|
|
|
|
|
|
|
|
|
|
July |
|
|
|
|
|
|
|
|
|
|
18 |
0.1 |
25,204 |
96.8 |
|
|
|
|
|
|
|
|
|
|
August |
|
|
|
|
|
|
|
|
|
|
|
|
836 |
3.2 |
25,200 |
96.8 |
|
|
|
|
|
|
|
|
September |
|
|
|
|
|
|
|
|
|
|
|
|
|
|
840 |
3.2 |
23,269 |
89.4 |
|
|
|
|
|
|
October |
|
|
|
|
|
|
|
|
|
|
|
|
|
|
|
|
2,771 |
10.6 |
27,948 |
97.0 |
|
|
|
|
November |
|
|
|
|
|
|
|
|
|
|
|
|
|
|
|
|
|
|
852 |
3.0 |
30,196 |
99.8 |
|
|
December |
|
|
|
|
|
|
|
|
|
|
|
|
|
|
|
|
|
|
|
|
74 |
0.2 |
28,800 |
100.0 |
Total |
15,090 |
100.0 |
15,090 |
100.0 |
33,720 |
100.0 |
29,550 |
100.0 |
29,550 |
100.0 |
29,550 |
100.0 |
26,040 |
100.0 |
26,040 |
100.0 |
26,040 |
100.0 |
28,800 |
100.0 |
30,270 |
100.0 |
28,800 |
100.0 |
2017 Year-To-Date Data Quality Report |
||||||||||||||||||||||||
Section I: Sample Generation, Release, and Submission |
||||||||||||||||||||||||
Table 3B. Interview Month, By File Month |
||||||||||||||||||||||||
(Cell Phone only) |
||||||||||||||||||||||||
Interview Month |
File Month |
|||||||||||||||||||||||
January |
February |
March |
April |
May |
June |
July |
August |
September |
October |
November |
December |
|||||||||||||
N |
% |
N |
% |
N |
% |
N |
% |
N |
% |
N |
% |
N |
% |
N |
% |
N |
% |
N |
% |
N |
% |
N |
% |
|
January |
3,388 |
54.3 |
|
|
|
|
|
|
|
|
|
|
|
|
|
|
|
|
|
|
|
|
|
|
February |
2,852 |
45.7 |
6,159 |
99.7 |
|
|
|
|
|
|
|
|
|
|
|
|
|
|
|
|
|
|
|
|
March |
|
|
21 |
0.3 |
6,193 |
99.7 |
|
|
|
|
|
|
|
|
|
|
|
|
|
|
|
|
|
|
April |
|
|
|
|
17 |
0.3 |
5,804 |
98.7 |
|
|
|
|
|
|
|
|
|
|
|
|
|
|
|
|
May |
|
|
|
|
|
|
76 |
1.3 |
5,350 |
91.5 |
|
|
|
|
|
|
|
|
|
|
|
|
|
|
June |
|
|
|
|
|
|
|
|
500 |
8.5 |
5,862 |
99.7 |
|
|
|
|
|
|
|
|
|
|
|
|
July |
|
|
|
|
|
|
|
|
|
|
18 |
0.3 |
3,859 |
62.4 |
|
|
|
|
|
|
|
|
|
|
August |
|
|
|
|
|
|
|
|
|
|
|
|
2,321 |
37.6 |
3,410 |
55.2 |
|
|
|
|
|
|
|
|
September |
|
|
|
|
|
|
|
|
|
|
|
|
|
|
2,770 |
44.8 |
3,665 |
59.0 |
|
|
|
|
|
|
October |
|
|
|
|
|
|
|
|
|
|
|
|
|
|
|
|
2,545 |
41.0 |
8,134 |
63.6 |
|
|
|
|
November |
|
|
|
|
|
|
|
|
|
|
|
|
|
|
|
|
|
|
4,646 |
36.4 |
9,450 |
73.1 |
|
|
December |
|
|
|
|
|
|
|
|
|
|
|
|
|
|
|
|
|
|
|
|
3,480 |
26.9 |
8,760 |
100.0 |
Total |
6,240 |
100.0 |
6,180 |
100.0 |
6,210 |
100.0 |
5,880 |
100.0 |
5,850 |
100.0 |
5,880 |
100.0 |
6,180 |
100.0 |
6,180 |
100.0 |
6,210 |
100.0 |
12,780 |
100.0 |
12,930 |
100.0 |
8,760 |
100.0 |
![]()
![]()
![]()
![]()
![]()
![]()
![]()
![]()
![]()
![]()
![]()
![]()
![]()
![]()
![]()
![]()
![]()
![]()
![]()
![]()
![]()
![]()
![]()
![]()
![]()
![]()
![]()
![]()
![]()
![]()
![]()
![]()
![]()
![]()
![]()
![]()
![]()
![]()
![]()
![]()
![]()
![]()
![]()
![]()
![]()
2017 Year-To-Date Data Quality Report |
Section II: Bias |
Table 4A. Discrepancy in Sex Between Population Estimates and Unweighted BRFSS Data, Year-to-Date |
(Base=Completes only; Landline interviews from state/territory residents only) |
Sex |
Unweighted Frequency from BRFSS Data |
Unweighted Percent from BRFSS Data |
Population Frequency |
Population Percent |
Percentage Point Difference Between BRFSS and Population |
Male |
2,212 |
34.24 |
10,248,978 |
49.15 |
-14.91 |
Female |
4,243 |
65.67 |
10,603,536 |
50.85 |
14.82 |
Refused |
6 |
0.09 |
|
|
|
Total |
6,461 |
|
20,852,514 |
|
|
2017 Year-To-Date Data Quality Report |
Section II: Bias |
Table 4B. Discrepancy in Sex Between Population Estimates and Unweighted BRFSS Data, Year-to-Date |
(Base=Completes only; Cell Phone interviews from state/territory residents, including those interviewed by other states/territories) |
Sex |
Unweighted Frequency from BRFSS Data |
Unweighted Percent from BRFSS Data |
Population Frequency |
Population Percent |
Percentage Point Difference Between BRFSS and Population |
Male |
2,278 |
47.94 |
10,248,978 |
49.15 |
-1.21 |
Female |
2,466 |
51.89 |
10,603,536 |
50.85 |
1.04 |
Refused |
8 |
0.17 |
|
|
|
Total |
4,752 |
|
20,852,514 |
|
|
2017 Year-To-Date Data Quality Report |
Section II: Bias |
Table 5A. Discrepancy in Age Between Population Estimates and Unweighted BRFSS Data, Year-to-Date |
(Base=Completes only; Landline interviews from state/territory residents only) |
Age Group |
Unweighted Frequency from BRFSS Data |
Unweighted Percent from BRFSS Data |
Population Frequency |
Population Percent |
Percentage Point Difference Between BRFSS and Population |
Don’t Know Refused |
105 |
|
|
|
|
18-24 |
70 |
1.10 |
2,861,239 |
13.72 |
-12.62 |
25-34 |
173 |
2.72 |
3,990,054 |
19.13 |
-16.41 |
35-44 |
406 |
6.39 |
3,766,590 |
18.06 |
-11.68 |
45-54 |
730 |
11.49 |
3,562,450 |
17.08 |
-5.60 |
55-64 |
1,358 |
21.37 |
3,197,830 |
15.34 |
6.03 |
65-74 |
1,795 |
28.24 |
2,102,318 |
10.08 |
18.16 |
75 + |
1,824 |
28.70 |
1,372,033 |
6.58 |
22.12 |
Total |
6,461 |
|
20,852,514 |
|
|
2017 Year-To-Date Data Quality Report |
|||||
|
|
|
Section II: Bias |
|
|
Table 5B. Discrepancy in Age Between Population Estimates and Unweighted BRFSS Data, Year-to-Date |
|||||
(Base=Completes only; Cell Phone interviews from state/territory residents, including those interviewed by other states/territories) |
|||||
Age Group |
Unweighted Frequency from BRFSS Data |
Unweighted Percent from BRFSS Data |
Population Frequency |
Population Percent |
Percentage Point Difference Between BRFSS and Population |
Don’t Know Refused |
72 |
|
|
|
|
18-24 |
491 |
10.49 |
2,861,239 |
13.72 |
-3.23 |
25-34 |
839 |
17.93 |
3,990,054 |
19.13 |
-1.21 |
35-44 |
854 |
18.25 |
3,766,590 |
18.06 |
0.18 |
45-54 |
782 |
16.71 |
3,562,450 |
17.08 |
-0.37 |
55-64 |
862 |
18.42 |
3,197,830 |
15.34 |
3.08 |
65-74 |
593 |
12.67 |
2,102,318 |
10.08 |
2.59 |
75 + |
259 |
5.53 |
1,372,033 |
6.58 |
-1.05 |
Total |
4,752 |
|
20,852,514 |
|
|
2017 Year-To-Date Data Quality Report |
Section II: Bias |
Table 6A. Discrepancy in Race/Ethnicity Between Population Estimates and Unweighted BRFSS Data, Year-to-Date |
(Base=Completes only; Landline interviews from state/territory residents only) |
Race Group |
Unweighted Frequency from BRFSS Data |
Unweighted Percent from BRFSS Data |
Population Frequency |
Population Percent |
Percentage Point Difference Between BRFSS and Population |
White, Non-Hispanic |
4,337 |
67.13 |
9,719,049 |
46.61 |
20.52 |
Black, Non-Hispanic |
529 |
8.19 |
2,427,850 |
11.64 |
-3.46 |
Asian/Pacific Islander, Non-Hispanic |
93 |
1.44 |
1,002,816 |
4.81 |
-3.37 |
Am Indian/Native American, Non-Hispanic |
59 |
0.91 |
72,046 |
0.35 |
0.57 |
Hispanic |
1,264 |
19.56 |
7,344,003 |
35.22 |
-15.66 |
Undetermined/Multi- Racial |
179 |
2.77 |
286,750 |
1.38 |
1.40 |
Total |
6,461 |
|
20,852,514 |
|
|
2017 Year-To-Date Data Quality Report |
Section II: Bias |
Table 6B. Discrepancy in Race/Ethnicity Between Population Estimates and Unweighted BRFSS Data, Year-to-Date |
(Base=Completes only; Cell Phone interviews from state/territory residents, including those interviewed by other states/territories) |
Race Group |
Unweighted Frequency from BRFSS Data |
Unweighted Percent from BRFSS Data |
Population Frequency |
Population Percent |
Percentage Point Difference Between BRFSS and Population |
White, Non-Hispanic |
2,295 |
48.30 |
9,719,049 |
46.61 |
1.69 |
Black, Non-Hispanic |
350 |
7.37 |
2,427,850 |
11.64 |
-4.28 |
Asian/Pacific Islander, Non-Hispanic |
121 |
2.55 |
1,002,816 |
4.81 |
-2.26 |
Am Indian/Native American, Non-Hispanic |
44 |
0.93 |
72,046 |
0.35 |
0.58 |
Hispanic |
1,800 |
37.88 |
7,344,003 |
35.22 |
2.66 |
Undetermined/Multi- Racial |
142 |
2.99 |
286,750 |
1.38 |
1.61 |
Total |
4,752 |
|
20,852,514 |
|
|
2017 Year-To-Date Data Quality Report |
Section II: Bias |
Table 7A. Geo-Stratum by File Month, Year-to-Date |
Base=Completes only (Landline only) |
|
File Month |
|
|||||||||||||||||||||||||
|
January |
February |
March |
April |
May |
June |
July |
August |
September |
October |
November |
December |
Year-To-Date |
||||||||||||||
Geo- Str |
N |
% |
N |
% |
N |
% |
N |
% |
N |
% |
N |
% |
N |
% |
N |
% |
N |
% |
N |
% |
N |
% |
N |
% |
N |
% |
|
101 |
9 |
2.4 |
8 |
2.3 |
18 |
2.3 |
1 |
0.2 |
1 |
0.2 |
1 |
0.2 |
4 |
0.7 |
1 |
0.2 |
4 |
0.8 |
5 |
1.0 |
7 |
1.3 |
6 |
1.3 |
65 |
1.0 |
|
102 |
12 |
3.1 |
15 |
4.3 |
59 |
7.4 |
33 |
5.5 |
39 |
6.7 |
26 |
4.1 |
23 |
4.0 |
28 |
5.8 |
23 |
4.3 |
68 |
13.0 |
60 |
10.9 |
56 |
12.2 |
442 |
6.8 |
|
103 |
18 |
4.7 |
11 |
3.2 |
63 |
7.9 |
66 |
10.9 |
93 |
16.0 |
96 |
15.3 |
36 |
6.2 |
31 |
6.4 |
28 |
5.3 |
29 |
5.5 |
22 |
4.0 |
20 |
4.4 |
513 |
7.9 |
|
104 |
14 |
3.7 |
9 |
2.6 |
33 |
4.2 |
24 |
4.0 |
15 |
2.6 |
20 |
3.2 |
17 |
2.9 |
19 |
3.9 |
11 |
2.1 |
23 |
4.4 |
22 |
4.0 |
22 |
4.8 |
229 |
3.5 |
|
|
|||||||||||||||||||||||||||
116 |
16 |
4.2 |
9 |
2.6 |
35 |
4.4 |
35 |
5.8 |
37 |
6.3 |
36 |
5.7 |
42 |
7.3 |
31 |
6.4 |
51 |
9.6 |
19 |
3.6 |
32 |
5.8 |
13 |
2.8 |
356 |
5.5 |
|
117 |
12 |
3.1 |
12 |
3.4 |
45 |
5.7 |
40 |
6.6 |
31 |
5.3 |
30 |
4.8 |
30 |
5.2 |
20 |
4.1 |
28 |
5.3 |
38 |
7.3 |
39 |
7.1 |
41 |
9.0 |
366 |
5.7 |
|
118 |
10 |
2.6 |
7 |
2.0 |
8 |
1.0 |
1 |
0.2 |
1 |
0.2 |
1 |
0.2 |
|
|
|
|
|
|
|
|
1 |
0.2 |
2 |
0.4 |
31 |
0.5 |
|
119 |
10 |
2.6 |
6 |
1.7 |
8 |
1.0 |
1 |
0.2 |
1 |
0.2 |
2 |
0.3 |
2 |
0.3 |
1 |
0.2 |
1 |
0.2 |
3 |
0.6 |
1 |
0.2 |
5 |
1.1 |
41 |
0.6 |
|
Total |
381 |
100.0 |
349 |
100.0 |
793 |
100.0 |
603 |
100.0 |
583 |
100.0 |
628 |
100.0 |
578 |
100.0 |
486 |
100.0 |
530 |
100.0 |
524 |
100.0 |
548 |
100.0 |
458 |
100.0 |
6,461 |
100.0 |
|
2017 Year-To-Date Data Quality Report Section II: Bias Table 7B. Geo-Stratum by File Month, Year-to-Date Base=Completes only (Cell phone only) |
||||||||||||||||||||||||||
|
File Month |
|
||||||||||||||||||||||||
|
January |
February |
March |
April |
May |
June |
July |
August |
September |
October |
November |
December |
Year-To- Date |
|||||||||||||
Geo- Str |
N |
% |
N |
% |
N |
% |
N |
% |
N |
% |
N |
% |
N |
% |
N |
% |
N |
% |
N |
% |
N |
% |
N |
% |
N |
% |
201 |
13 |
3.6 |
14 |
3.8 |
9 |
2.5 |
|
|
|
|
|
|
8 |
2.7 |
2 |
0.6 |
4 |
1.1 |
7 |
0.9 |
13 |
2.2 |
1 |
0.3 |
71 |
1.5 |
202 |
17 |
4.7 |
18 |
4.9 |
11 |
3.0 |
8 |
2.5 |
12 |
4.0 |
19 |
6.1 |
14 |
4.8 |
26 |
7.9 |
24 |
6.4 |
21 |
2.8 |
17 |
2.8 |
9 |
2.4 |
196 |
4.1 |
203 |
14 |
3.8 |
11 |
3.0 |
21 |
5.8 |
33 |
10.3 |
34 |
11.3 |
29 |
9.4 |
18 |
6.2 |
14 |
4.3 |
22 |
5.9 |
21 |
2.8 |
10 |
1.7 |
15 |
3.9 |
242 |
5.1 |
204 |
21 |
5.8 |
17 |
4.6 |
12 |
3.3 |
16 |
5.0 |
22 |
7.3 |
19 |
6.1 |
36 |
12.3 |
30 |
9.1 |
22 |
5.9 |
15 |
2.0 |
15 |
2.5 |
7 |
1.8 |
232 |
4.9 |
|
||||||||||||||||||||||||||
216 |
16 |
4.4 |
8 |
2.2 |
18 |
5.0 |
32 |
10.0 |
25 |
8.3 |
30 |
9.7 |
14 |
4.8 |
15 |
4.6 |
23 |
6.2 |
14 |
1.8 |
21 |
3.5 |
11 |
2.9 |
227 |
4.8 |
217 |
13 |
3.6 |
7 |
1.9 |
14 |
3.9 |
3 |
0.9 |
4 |
1.3 |
6 |
1.9 |
1 |
0.3 |
5 |
1.5 |
7 |
1.9 |
8 |
1.1 |
8 |
1.3 |
6 |
1.6 |
82 |
1.7 |
218 |
4 |
1.1 |
8 |
2.2 |
4 |
1.1 |
1 |
0.3 |
3 |
1.0 |
1 |
0.3 |
3 |
1.0 |
6 |
1.8 |
4 |
1.1 |
|
|
1 |
0.2 |
5 |
1.3 |
40 |
0.8 |
219 |
25 |
6.8 |
30 |
8.2 |
35 |
9.7 |
26 |
8.1 |
15 |
5.0 |
32 |
10.3 |
18 |
6.2 |
22 |
6.7 |
28 |
7.5 |
27 |
3.6 |
25 |
4.2 |
19 |
5.0 |
302 |
6.4 |
Total |
365 |
100.0 |
367 |
100.0 |
362 |
100.0 |
321 |
100.0 |
300 |
100.0 |
310 |
100.0 |
292 |
100.0 |
328 |
100.0 |
373 |
100.0 |
757 |
100.0 |
597 |
100.0 |
380 |
100.0 |
4,752 |
100.0 |
Year-To-Date Data Quality Report |
|||||||||||
Section III: Magnitude and Consistency of Effort |
|||||||||||
Table 8A. Date, Day of Week, Number of Interviewers and Final Disposition Code, By File Month |
|||||||||||
(Base= records with one or more attempts; Landline only) |
|||||||||||
File Month |
Date of Final Disposition |
Day of Week |
Number of Interviewers |
Number Completes |
Percent Completed |
Cumulative Percent |
Number Incomplete Eligible Household |
Number Ineligible Household |
Number Non- Working |
Number Other Dispositions |
Number of Final Dispositions |
January |
01/10/2017 |
Tuesday |
2 |
0 |
0.00 |
0.00 |
0 |
0 |
91 |
9 |
100 |
January |
01/11/2017 |
Wednesday |
1 |
1 |
0.01 |
0.01 |
0 |
0 |
116 |
12 |
129 |
January |
01/12/2017 |
Thursday |
4 |
1 |
0.01 |
0.03 |
0 |
0 |
304 |
29 |
334 |
January |
01/13/2017 |
Friday |
6 |
2 |
0.03 |
0.06 |
0 |
0 |
439 |
37 |
478 |
January |
01/14/2017 |
Saturday |
1 |
7 |
0.10 |
0.16 |
1 |
0 |
30 |
3 |
41 |
January |
01/15/2017 |
Sunday |
9 |
2 |
0.03 |
0.19 |
0 |
0 |
444 |
36 |
482 |
January |
01/16/2017 |
Monday |
12 |
17 |
0.24 |
0.43 |
3 |
0 |
156 |
105 |
281 |
|
|||||||||||
January |
02/08/2017 |
Wednesday |
4 |
5 |
0.07 |
5.22 |
11 |
1 |
2 |
25 |
44 |
January |
02/09/2017 |
Thursday |
7 |
11 |
0.16 |
5.38 |
72 |
0 |
14 |
216 |
313 |
January |
02/10/2017 |
Friday |
15 |
5 |
0.07 |
5.45 |
28 |
0 |
3 |
65 |
101 |
January |
02/11/2017 |
Saturday |
5 |
2 |
0.03 |
5.48 |
13 |
0 |
0 |
21 |
36 |
January |
02/12/2017 |
Sunday |
1 |
0 |
0.00 |
5.48 |
4 |
0 |
0 |
2 |
6 |
|
|
|
|
381 |
5.48 |
|
383 |
7 |
2,819 |
3,360 |
6,950 |
2017 Year-To-Date Data Quality Report Section III: Magnitude and Consistency of Effort Table 8B. Date, Day of Week, Number of Interviewers and Final Disposition Code, By File Month (Base= records with one or more attempts; Cell phone only, restricted to state/territory) |
|||||||||||
File Month |
Date of Final Disposition |
Day of Week |
Number of Interviewers |
Number Completes |
Percent Completed |
Cumulative Percent |
Number Incomplete Eligible Respondent |
Number Ineligible Respondent |
Number Non- Working |
Number Other Dispositions |
Number of Final Dispositions |
January |
01/12/2017 |
Thursday |
3 |
4 |
0.09 |
0.09 |
0 |
0 |
9 |
4 |
17 |
January |
01/13/2017 |
Friday |
2 |
2 |
0.04 |
0.13 |
0 |
1 |
10 |
1 |
14 |
January |
01/14/2017 |
Saturday |
1 |
1 |
0.02 |
0.15 |
0 |
1 |
0 |
0 |
2 |
January |
01/15/2017 |
Sunday |
6 |
7 |
0.15 |
0.31 |
0 |
1 |
6 |
0 |
14 |
January |
01/16/2017 |
Monday |
7 |
7 |
0.15 |
0.46 |
4 |
4 |
51 |
24 |
90 |
January |
01/17/2017 |
Tuesday |
7 |
8 |
0.18 |
0.64 |
0 |
1 |
36 |
14 |
59 |
|
|||||||||||
January |
02/07/2017 |
Tuesday |
16 |
9 |
0.20 |
6.46 |
2 |
3 |
8 |
34 |
56 |
January |
02/08/2017 |
Wednesday |
27 |
26 |
0.57 |
7.03 |
23 |
2 |
6 |
670 |
727 |
January |
02/09/2017 |
Thursday |
12 |
22 |
0.49 |
7.52 |
23 |
1 |
4 |
957 |
1,007 |
January |
02/10/2017 |
Friday |
23 |
23 |
0.51 |
8.02 |
11 |
0 |
1 |
505 |
540 |
January |
02/11/2017 |
Saturday |
2 |
1 |
0.02 |
8.05 |
2 |
0 |
0 |
7 |
10 |
|
|
|
|
365 |
8.05 |
|
94 |
70 |
1,065 |
2,942 |
4,536 |
2017 Year-To-Date Data Quality Report Section III: Magnitude and Consistency of Effort Table 9A. Number and Percent of Completes in the First 5, 10, 15, 20, and 25 Days by File Month (Landline only) |
|||||||||||
File Month |
Monthly Interviews Completed |
Number and Percent of Interviews with Final Disposition Codes of 1100 (Complete) and 1200 (Partial Complete) Completed in the First |
|||||||||
File Month |
Monthly Total |
5 days |
% of monthly interviews |
10 days |
% of monthly interviews |
15 days |
% of monthly interviews |
20 days |
% of monthly interviews |
25 days |
% of monthly interviews |
January |
381 |
44 |
11.5 |
71 |
18.6 |
86 |
22.6 |
250 |
65.6 |
318 |
83.5 |
February |
349 |
16 |
4.6 |
181 |
51.9 |
261 |
74.8 |
318 |
91.1 |
339 |
97.1 |
March |
793 |
395 |
49.8 |
590 |
74.4 |
650 |
82.0 |
705 |
88.9 |
737 |
92.9 |
April |
603 |
236 |
39.1 |
327 |
54.2 |
420 |
69.7 |
483 |
80.1 |
519 |
86.1 |
May |
583 |
73 |
12.5 |
217 |
37.2 |
348 |
59.7 |
446 |
76.5 |
530 |
90.9 |
June |
628 |
177 |
28.2 |
395 |
62.9 |
479 |
76.3 |
533 |
84.9 |
577 |
91.9 |
July |
578 |
100 |
17.3 |
337 |
58.3 |
420 |
72.7 |
466 |
80.6 |
524 |
90.7 |
August |
486 |
90 |
18.5 |
278 |
57.2 |
336 |
69.1 |
389 |
80.0 |
450 |
92.6 |
September |
530 |
110 |
20.8 |
263 |
49.6 |
353 |
66.6 |
423 |
79.8 |
483 |
91.1 |
October |
524 |
92 |
17.6 |
282 |
53.8 |
366 |
69.8 |
429 |
81.9 |
481 |
91.8 |
November |
548 |
166 |
30.3 |
335 |
61.1 |
416 |
75.9 |
466 |
85.0 |
486 |
88.7 |
December |
458 |
209 |
45.6 |
305 |
66.6 |
341 |
74.5 |
379 |
82.8 |
410 |
89.5 |
2017 Year-To-Date Data Quality Report |
|||||||||||
Section III: Magnitude and Consistency of Effort |
|||||||||||
Table 9B. Number and Percent of Completes in the First 5, 10, 15, 20, and 25 Days by File Month |
|||||||||||
(Cell phone only, restricted to interviews from state/territory) |
|||||||||||
File Month |
Monthly Interviews Completed |
Number and Percent of Interviews with Final Disposition Codes of 1100 (Complete) and 1200 (Partial Complete) Completed in the First |
|||||||||
File Month |
Monthly Total |
5 days |
% of monthly interviews |
10 days |
% of monthly interviews |
15 days |
% of monthly interviews |
20 days |
% of monthly interviews |
25 days |
% of monthly interviews |
January |
365 |
58 |
15.9 |
145 |
39.7 |
160 |
43.8 |
200 |
54.8 |
290 |
79.5 |
February |
367 |
4 |
1.1 |
33 |
9.0 |
157 |
42.8 |
252 |
68.7 |
312 |
85.0 |
March |
362 |
2 |
0.6 |
88 |
24.3 |
178 |
49.2 |
246 |
68.0 |
293 |
80.9 |
April |
321 |
1 |
0.3 |
85 |
26.5 |
132 |
41.1 |
159 |
49.5 |
222 |
69.2 |
May |
300 |
15 |
5.0 |
69 |
23.0 |
101 |
33.7 |
152 |
50.7 |
204 |
68.0 |
June |
310 |
2 |
0.6 |
65 |
21.0 |
135 |
43.5 |
187 |
60.3 |
240 |
77.4 |
July |
292 |
48 |
16.4 |
92 |
31.5 |
143 |
49.0 |
188 |
64.4 |
235 |
80.5 |
August |
328 |
17 |
5.2 |
54 |
16.5 |
202 |
61.6 |
231 |
70.4 |
283 |
86.3 |
September |
373 |
51 |
13.7 |
117 |
31.4 |
165 |
44.2 |
271 |
72.7 |
331 |
88.7 |
October |
757 |
153 |
20.2 |
180 |
23.8 |
336 |
44.4 |
473 |
62.5 |
613 |
81.0 |
November |
597 |
98 |
16.4 |
121 |
20.3 |
310 |
51.9 |
407 |
68.2 |
472 |
79.1 |
December |
380 |
0 |
0.0 |
93 |
24.5 |
192 |
50.5 |
258 |
67.9 |
293 |
77.1 |
2017 Year-To-Date Data Quality Report Section III: Magnitude and Consistency of Effort Table 10A. Date and Day of Week of Final Disposition Code, By File Month (Base= numbers with one or more attempts; Landline only) |
|||||||||
File Month |
Date of Final Disposition |
Day of Week |
Number of Interviewers |
Number of Dispositions |
Percent Completed |
Cumulative Percent |
Minimum Number of Attempts |
Mean Number of Attempts |
Maximum Number of Attempts |
January |
01/10/2017 |
Tuesday |
2 |
100 |
1.44 |
1.44 |
1 |
1 |
1 |
January |
01/11/2017 |
Wednesday |
1 |
129 |
1.86 |
3.29 |
1 |
1 |
1 |
January |
01/12/2017 |
Thursday |
4 |
334 |
4.81 |
8.10 |
1 |
1 |
3 |
January |
01/13/2017 |
Friday |
6 |
478 |
6.88 |
14.98 |
1 |
1 |
1 |
January |
01/14/2017 |
Saturday |
1 |
41 |
0.59 |
15.57 |
1 |
1 |
1 |
January |
01/15/2017 |
Sunday |
9 |
482 |
6.94 |
22.50 |
1 |
1 |
1 |
|
|||||||||
January |
02/09/2017 |
Thursday |
7 |
313 |
4.50 |
97.94 |
13 |
15 |
16 |
January |
02/10/2017 |
Friday |
15 |
101 |
1.45 |
99.40 |
14 |
15 |
17 |
January |
02/11/2017 |
Saturday |
5 |
36 |
0.52 |
99.91 |
14 |
16 |
17 |
January |
02/12/2017 |
Sunday |
1 |
6 |
0.09 |
100.00 |
17 |
17 |
17 |
|
|
|
405 |
6,950 |
100.00 |
|
|
|
|
2017 Year-To-Date Data Quality Report Section III: Magnitude and Consistency of Effort Table 10B. Date and Day of Week of Final Disposition Code, By File Month (Base= numbers with one or more attempts; Cell phone only, restricted to state/territory) |
|||||||||
File Month |
Date of Final Disposition |
Day of Week |
Number of Interviewers |
Number of Dispositions |
Percent Completed |
Cumulative Percent |
Minimum Number of Attempts |
Mean Number of Attempts |
Maximum Number of Attempts |
January |
01/12/2017 |
Thursday |
3 |
17 |
0.37 |
0.37 |
1 |
1 |
2 |
January |
01/13/2017 |
Friday |
2 |
14 |
0.31 |
0.68 |
1 |
1 |
1 |
January |
01/14/2017 |
Saturday |
1 |
2 |
0.04 |
0.73 |
1 |
1 |
1 |
January |
01/15/2017 |
Sunday |
6 |
14 |
0.31 |
1.04 |
1 |
1 |
1 |
January |
01/16/2017 |
Monday |
7 |
90 |
1.98 |
3.02 |
1 |
2 |
2 |
January |
01/17/2017 |
Tuesday |
7 |
59 |
1.30 |
4.32 |
1 |
2 |
3 |
|
|||||||||
January |
02/08/2017 |
Wednesday |
27 |
727 |
16.03 |
65.67 |
7 |
8 |
10 |
January |
02/09/2017 |
Thursday |
12 |
1,007 |
22.20 |
87.87 |
8 |
8 |
9 |
January |
02/10/2017 |
Friday |
23 |
540 |
11.90 |
99.78 |
8 |
8 |
9 |
January |
02/11/2017 |
Saturday |
2 |
10 |
0.22 |
100.00 |
9 |
9 |
10 |
|
|
|
308 |
4,536 |
100.00 |
|
|
|
|
2017
Year-To-Date Data Quality Report
Section
III: Magnitude and Consistency of Effort
Table
11A. Eligibility and Status by Categories of Disposition Code,
Year-to-Date
(Landline
only)
Number
of listed landline sample: 99009
Number
of unlisted landline sample: 219531
Disposition
Status COIN (Completes and Partial Completes)
TERE
(Break offs, terminations, and refusals)
HH
(Known households)
ELIG
(Eligible)
INELIG
(Ineligible) UNKELIG
(Unknown
eligible)
Frequency
Listed
+
Not
Listed 6,461
2,794
16,186
13,325
249,240
55,975
Percent
Listed + Not Listed
2.03
0.88
5.08
4.18
78.24
17.57
Frequency
Listed 5,874
2,479
14,368
11,896
45,881
41,232
Percent
Listed 5.93
2.50
14.51
12.02
46.34
41.64
Frequency
Not
Listed 587
315
1,818
1,429
203,359
14,743
Percent
Not Listed 0.27
0.14
0.83
0.65
92.63
6.72
 Note:
Categories are not mutally exclusive, total percents can be more than
100%


Disposition Status |
Frequency |
Percent |
COIN (Completes and Partial Completes) |
4,752 |
5.32 |
TERE (Break offs, terminations, and refusals) |
1,355 |
1.52 |
HH (Known households) |
6,338 |
7.10 |
ELIG (Eligible) |
6,334 |
7.09 |
INELIG (Ineligible) |
41,454 |
46.43 |
Total
Note: Categories are not mutually exclus |
108,059
ive, total per |
121.03
cent can be more than 100% |
2017 Year-To-Date Data Quality Report |
||||||||||
Section III: Magnitude and Consistency of Effort |
||||||||||
Table 12A. Eligibility and Status by Categories of Disposition Code, by File Month |
||||||||||
|
|
|
|
|
(Landline only) |
|
|
|
|
|
File Month |
COIN (Completes and Partial Completes) |
TERE (Break offs, terminations, and refusals) |
HH (Known households) |
ELIG (Eligible) |
INELIG (Ineligible) |
|||||
N |
% |
N |
% |
N |
% |
N |
% |
N |
% |
|
January |
381 |
6 |
185 |
7 |
923 |
6 |
764 |
6 |
11,568 |
5 |
February |
349 |
5 |
161 |
6 |
849 |
5 |
694 |
5 |
11,667 |
5 |
March |
793 |
12 |
283 |
10 |
1,849 |
11 |
1,521 |
11 |
26,166 |
10 |
April |
603 |
9 |
238 |
9 |
1,468 |
9 |
1,208 |
9 |
22,927 |
9 |
May |
583 |
9 |
276 |
10 |
1,538 |
10 |
1,278 |
10 |
23,021 |
9 |
June |
628 |
10 |
274 |
10 |
1,478 |
9 |
1,227 |
9 |
23,007 |
9 |
July |
578 |
9 |
239 |
9 |
1,361 |
8 |
1,148 |
9 |
19,985 |
8 |
August |
486 |
8 |
214 |
8 |
1,293 |
8 |
973 |
7 |
21,781 |
9 |
September |
530 |
8 |
244 |
9 |
1,437 |
9 |
1,194 |
9 |
20,176 |
8 |
October |
524 |
8 |
250 |
9 |
1,435 |
9 |
1,178 |
9 |
22,551 |
9 |
November |
548 |
8 |
234 |
8 |
1,359 |
8 |
1,147 |
9 |
23,785 |
10 |
December |
458 |
7 |
196 |
7 |
1,196 |
7 |
993 |
7 |
22,606 |
9 |
2017 Year-To-Date Data Quality Report Section III: Magnitude and Consistency of Effort Table 12B. Eligibility and Status by Categories of Disposition Code, by File Month (Cell phone only, restricted to state/territory, does not include out of state interviews) |
||||||||||
File Month |
COIN (Completes and Partial Completes) |
TERE (Break offs, terminations, and refusals) |
HH (Known households) |
ELIG (Eligible) |
INELIG (Ineligible) |
|||||
N |
% |
N |
% |
N |
% |
N |
% |
N |
% |
|
January |
365 |
8 |
76 |
6 |
459 |
7 |
459 |
7 |
2,947 |
7 |
February |
367 |
8 |
80 |
6 |
466 |
7 |
466 |
7 |
2,938 |
7 |
March |
362 |
8 |
76 |
6 |
456 |
7 |
456 |
7 |
2,908 |
7 |
April |
321 |
7 |
111 |
8 |
451 |
7 |
449 |
7 |
2,696 |
7 |
May |
300 |
6 |
100 |
7 |
413 |
7 |
413 |
7 |
2,681 |
6 |
June |
310 |
7 |
84 |
6 |
410 |
6 |
410 |
6 |
2,732 |
7 |
July |
292 |
6 |
101 |
7 |
405 |
6 |
405 |
6 |
2,957 |
7 |
August |
328 |
7 |
121 |
9 |
467 |
7 |
466 |
7 |
2,735 |
7 |
September |
373 |
8 |
105 |
8 |
486 |
8 |
486 |
8 |
2,795 |
7 |
October |
757 |
16 |
213 |
16 |
1,000 |
16 |
999 |
16 |
5,881 |
14 |
November |
597 |
13 |
165 |
12 |
802 |
13 |
802 |
13 |
6,136 |
15 |
December |
380 |
8 |
123 |
9 |
523 |
8 |
523 |
8 |
4,048 |
10 |
2017 Year-To-Date Data Quality Report |
Section III: Magnitude and Consistency of Effort |
Table 13A. Detailed Disposition Code, Year-to-Date |
(Landline only) |
![]()
![]()
![]()
![]()


Disposition Code-Description |
Frequency |
Percent |
1100 - Complete |
5,715 |
1.8 |
1200 - Partial complete |
746 |
0.2 |
2111 - Household level refusal |
982 |
0.3 |
2112 - Known respondent refusal |
1,100 |
0.3 |
2120 - Breakoff/termination within questionnaire |
712 |
0.2 |
2210 - Respondent never available |
1,200 |
0.4 |
2220 - Household answering device(landline only) |
2,352 |
0.7 |
2320 - Respondent physically or mentally unable to complete interview |
483 |
0.2 |
2330 - Language barrier, selected respondent |
35 |
0.0 |
3100 - Unknown if housing unit |
14,491 |
4.5 |
3130 - No answer |
16,076 |
5.0 |
3140 - Answering device, unknown if residence or respondent available |
19,804 |
6.2 |
3150 - Telecommunication barrier |
1,954 |
0.6 |
3200 - Household, not known if respondent eligible |
2,861 |
0.9 |
3322 - Physical or mental impairment(household level) |
619 |
0.2 |
3330 - Language barrier(household level) |
170 |
0.1 |
4100 - Out of sample |
118 |
0.0 |
4200 - Fax/data/modem |
6,335 |
2.0 |
4300 - Nonworking number/disconnected |
197,950 |
62.1 |
4400 - Technological barrier |
17,306 |
5.4 |
4430 - Call forwarding/pager |
50 |
0.0 |
4450 - Cell phone (landline only) |
3,612 |
1.1 |
4500 - Non-residence |
22,161 |
7.0 |
4510 - Group home |
65 |
0.0 |
4700 - Household no eligible respondent |
18 |
0.0 |
4900 - Miscellaneous, non-eligible |
1,625 |
0.5 |
All disposition codes |
318,540 |
100.0 |
-
2017 Year-To-Date Data Quality Report
Section III: Magnitude and Consistency of Effort
Table 13B. Detailed Disposition Code, Year-to-Date
(Cell phone only, restricted to state/territory, does not include out of state interviews)
Disposition Code-Description
Frequency
Percent
1100 - Complete
3,873
4.3
1200 - Partial complete
879
1.0
2112 - Known respondent refusal
588
0.7
2120 - Breakoff/termination within questionnaire
767
0.9
2210 - Respondent never available
189
0.2
2320 - Respondent physically or mentally unable to complete interview
21
0.0
2330 - Language barrier, selected respondent
17
0.0
3100 - Unknown if housing unit
23,052
25.8
3130 - No answer
540
0.6
3140 - Answering device, unknown if residence or respondent available
16,760
18.8
3150 - Telecommunication barrier
563
0.6
3200 - Household, not known if respondent eligible
3
0.0
3322 - Physical or mental impairment(household level)
191
0.2
3330 - Language barrier(household level)
382
0.4
3700 - On never call list
1
0.0
4100 - Out of sample
67
0.1
4200 - Fax/data/modem
18
0.0
4300 - Nonworking number/disconnected
29,701
33.3
4400 - Technological barrier
8,837
9.9
4430 - Call forwarding/pager
8
0.0
4460 - Landline (cell phone only)
341
0.4
4500 - Non-residence
1,628
1.8
4510 - Group home
25
0.0
4700 - Household no eligible respondent
808
0.9
4900 - Miscellaneous, non-eligible
21
0.0
All disposition codes
89,280
100.0
![]()
![]()
![]()
![]()
![]()
![]()
![]()
![]()


2017 Year-To-Date Data Quality Report Section III: Magnitude and Consistency of Effort Table 14A. Detailed Disposition Code, by File Month (Landline only) |
|||||||||||||||||||||||||
|
File Month |
||||||||||||||||||||||||
Disposition |
January |
February |
March |
April |
May |
June |
July |
August |
September |
October |
November |
December |
|||||||||||||
Code |
Description |
N |
% |
N |
% |
N |
% |
N |
% |
N |
% |
N |
% |
N |
% |
N |
% |
N |
% |
N |
% |
N |
% |
N |
% |
1100 |
Complete |
336 |
2.2 |
314 |
2.1 |
703 |
2.1 |
539 |
1.8 |
512 |
1.7 |
559 |
1.9 |
520 |
2.0 |
429 |
1.6 |
461 |
1.8 |
459 |
1.6 |
476 |
1.6 |
407 |
1.4 |
1200 |
Partial complete |
45 |
0.3 |
35 |
0.2 |
90 |
0.3 |
64 |
0.2 |
71 |
0.2 |
69 |
0.2 |
58 |
0.2 |
57 |
0.2 |
69 |
0.3 |
65 |
0.2 |
72 |
0.2 |
51 |
0.2 |
2111 |
Household level refusal |
55 |
0.4 |
44 |
0.3 |
120 |
0.4 |
97 |
0.3 |
99 |
0.3 |
107 |
0.4 |
86 |
0.3 |
65 |
0.2 |
79 |
0.3 |
83 |
0.3 |
77 |
0.3 |
70 |
0.2 |
2112 |
Known respondent refusal |
82 |
0.5 |
75 |
0.5 |
103 |
0.3 |
81 |
0.3 |
111 |
0.4 |
97 |
0.3 |
90 |
0.3 |
84 |
0.3 |
102 |
0.4 |
103 |
0.4 |
103 |
0.3 |
69 |
0.2 |
|
|||||||||||||||||||||||||
4450 |
Cell phone (landline only) |
151 |
1.0 |
194 |
1.3 |
438 |
1.3 |
364 |
1.2 |
324 |
1.1 |
326 |
1.1 |
299 |
1.1 |
268 |
1.0 |
287 |
1.1 |
343 |
1.2 |
321 |
1.1 |
297 |
1.0 |
4500 |
Non-residence |
985 |
6.5 |
967 |
6.4 |
2,195 |
6.5 |
2,120 |
7.2 |
2,097 |
7.1 |
1,973 |
6.7 |
1,878 |
7.2 |
1,909 |
7.3 |
1,897 |
7.3 |
2,154 |
7.5 |
2,077 |
6.9 |
1,909 |
6.6 |
4510 |
Group home |
1 |
0.0 |
2 |
0.0 |
11 |
0.0 |
8 |
0.0 |
3 |
0.0 |
6 |
0.0 |
5 |
0.0 |
3 |
0.0 |
6 |
0.0 |
4 |
0.0 |
10 |
0.0 |
6 |
0.0 |
4700 |
Household no eligible respondent |
1 |
0.0 |
|
|
1 |
0.0 |
2 |
0.0 |
1 |
0.0 |
3 |
0.0 |
2 |
0.0 |
1 |
0.0 |
1 |
0.0 |
|
|
3 |
0.0 |
3 |
0.0 |
4900 |
Miscellaneous, non-eligible |
|
|
|
|
|
|
|
|
|
|
|
|
|
|
1,615 |
6.2 |
8 |
0.0 |
2 |
0.0 |
|
|
|
|
|
|
15,090 |
100.0 |
15,090 |
100.0 |
33,720 |
100.0 |
29,550 |
100.0 |
29,550 |
100.0 |
29,550 |
100.0 |
26,040 |
100.0 |
26,040 |
100.0 |
26,040 |
100.0 |
28,800 |
100.0 |
30,270 |
100.0 |
28,800 |
100.0 |
2017 Year-To-Date Data Quality Report Section III: Magnitude and Consistency of Effort Table 14B. Detailed Disposition Code, by File Month (Cell phone only, restricted to state/territory, does not include out of state interviews) |
|||||||||||||||||||||||||
|
File Month |
||||||||||||||||||||||||
Disposition |
January |
February |
March |
April |
May |
June |
July |
August |
September |
October |
November |
December |
|||||||||||||
Code |
Description |
N |
% |
N |
% |
N |
% |
N |
% |
N |
% |
N |
% |
N |
% |
N |
% |
N |
% |
N |
% |
N |
% |
N |
% |
1100 |
Complete |
288 |
4.6 |
307 |
5.0 |
310 |
5.0 |
260 |
4.4 |
252 |
4.3 |
253 |
4.3 |
246 |
4.0 |
272 |
4.4 |
305 |
4.9 |
591 |
4.6 |
486 |
3.8 |
303 |
3.5 |
1200 |
Partial complete |
77 |
1.2 |
60 |
1.0 |
52 |
0.8 |
61 |
1.0 |
48 |
0.8 |
57 |
1.0 |
46 |
0.7 |
56 |
0.9 |
68 |
1.1 |
166 |
1.3 |
111 |
0.9 |
77 |
0.9 |
2112 |
Known respondent refusal |
34 |
0.5 |
33 |
0.5 |
28 |
0.5 |
42 |
0.7 |
55 |
0.9 |
27 |
0.5 |
49 |
0.8 |
52 |
0.8 |
45 |
0.7 |
100 |
0.8 |
71 |
0.5 |
52 |
0.6 |
|
|||||||||||||||||||||||||
4460 |
Landline (cell phone only) |
20 |
0.3 |
15 |
0.2 |
19 |
0.3 |
27 |
0.5 |
37 |
0.6 |
39 |
0.7 |
29 |
0.5 |
23 |
0.4 |
33 |
0.5 |
39 |
0.3 |
36 |
0.3 |
24 |
0.3 |
4500 |
Non-residence |
105 |
1.7 |
87 |
1.4 |
126 |
2.0 |
126 |
2.1 |
89 |
1.5 |
107 |
1.8 |
147 |
2.4 |
109 |
1.8 |
135 |
2.2 |
232 |
1.8 |
211 |
1.6 |
154 |
1.8 |
4510 |
Group home |
2 |
0.0 |
1 |
0.0 |
1 |
0.0 |
2 |
0.0 |
1 |
0.0 |
3 |
0.1 |
2 |
0.0 |
1 |
0.0 |
3 |
0.0 |
7 |
0.1 |
2 |
0.0 |
|
|
4700 |
Household no eligible respondent |
46 |
0.7 |
60 |
1.0 |
47 |
0.8 |
44 |
0.7 |
45 |
0.8 |
54 |
0.9 |
71 |
1.1 |
53 |
0.9 |
51 |
0.8 |
133 |
1.0 |
144 |
1.1 |
60 |
0.7 |
4900 |
Miscellaneous, non-eligible |
|
|
|
|
|
|
|
|
|
|
|
|
|
|
7 |
0.1 |
8 |
0.1 |
5 |
0.0 |
1 |
0.0 |
|
|
|
|
6,240 |
100.0 |
6,180 |
100.0 |
6,210 |
100.0 |
5,880 |
100.0 |
5,850 |
100.0 |
5,880 |
100.0 |
6,180 |
100.0 |
6,180 |
100.0 |
6,210 |
100.0 |
12,780 |
100.0 |
12,930 |
100.0 |
8,760 |
100.0 |
2017 Year-To-Date Data Quality Report Section IV: Proper Assignment of Disposition Codes Table 15A. Number of Attempts, by File Month (Landline only) |
||||||||||||||||||||||||||
Attempts |
File Month |
Year-to-Date |
||||||||||||||||||||||||
January |
February |
March |
April |
May |
June |
July |
August |
September |
October |
November |
December |
|||||||||||||||
N |
% |
N |
% |
N |
% |
N |
% |
N |
% |
N |
% |
N |
% |
N |
% |
N |
% |
N |
% |
N |
% |
N |
% |
N |
% |
|
1 |
2,084 |
30.0 |
2,140 |
31.3 |
2,880 |
22.3 |
2,236 |
19.4 |
1,872 |
16.2 |
2,531 |
22.1 |
3,457 |
30.6 |
3,226 |
28.8 |
3,281 |
28.0 |
1,279 |
13.2 |
1,262 |
13.5 |
1,041 |
12.0 |
27,289 |
22.1 |
2 |
984 |
14.2 |
946 |
13.8 |
1,643 |
12.7 |
1,435 |
12.4 |
1,536 |
13.3 |
1,546 |
13.5 |
1,299 |
11.5 |
1,418 |
12.7 |
1,767 |
15.1 |
1,468 |
15.1 |
1,073 |
11.5 |
1,077 |
12.4 |
16,192 |
13.1 |
3 |
419 |
6.0 |
369 |
5.4 |
787 |
6.1 |
698 |
6.0 |
1,283 |
11.1 |
808 |
7.0 |
612 |
5.4 |
641 |
5.7 |
788 |
6.7 |
776 |
8.0 |
642 |
6.9 |
561 |
6.5 |
8,384 |
6.8 |
4 |
199 |
2.9 |
235 |
3.4 |
504 |
3.9 |
392 |
3.4 |
477 |
4.1 |
413 |
3.6 |
320 |
2.8 |
341 |
3.0 |
422 |
3.6 |
341 |
3.5 |
348 |
3.7 |
314 |
3.6 |
4,306 |
3.5 |
5 |
147 |
2.1 |
144 |
2.1 |
358 |
2.8 |
314 |
2.7 |
359 |
3.1 |
263 |
2.3 |
229 |
2.0 |
325 |
2.9 |
285 |
2.4 |
262 |
2.7 |
233 |
2.5 |
251 |
2.9 |
3,170 |
2.6 |
6 |
288 |
4.1 |
256 |
3.7 |
602 |
4.7 |
817 |
7.1 |
631 |
5.5 |
632 |
5.5 |
483 |
4.3 |
498 |
4.4 |
412 |
3.5 |
411 |
4.2 |
460 |
4.9 |
391 |
4.5 |
5,881 |
4.8 |
7 |
85 |
1.2 |
118 |
1.7 |
223 |
1.7 |
250 |
2.2 |
220 |
1.9 |
176 |
1.5 |
189 |
1.7 |
479 |
4.3 |
180 |
1.5 |
179 |
1.8 |
160 |
1.7 |
165 |
1.9 |
2,424 |
2.0 |
8 |
101 |
1.5 |
100 |
1.5 |
185 |
1.4 |
173 |
1.5 |
173 |
1.5 |
163 |
1.4 |
143 |
1.3 |
1,658 |
14.8 |
129 |
1.1 |
165 |
1.7 |
120 |
1.3 |
4,206 |
48.5 |
7,316 |
5.9 |
9 |
88 |
1.3 |
59 |
0.9 |
163 |
1.3 |
182 |
1.6 |
156 |
1.4 |
133 |
1.2 |
164 |
1.5 |
96 |
0.9 |
139 |
1.2 |
99 |
1.0 |
133 |
1.4 |
310 |
3.6 |
1,722 |
1.4 |
10 |
890 |
12.8 |
909 |
13.3 |
1,935 |
15.0 |
1,498 |
13.0 |
1,620 |
14.1 |
1,729 |
15.1 |
1,549 |
13.7 |
853 |
7.6 |
1,517 |
12.9 |
1,639 |
16.9 |
3,971 |
42.4 |
362 |
4.2 |
18,472 |
15.0 |
11 |
51 |
0.7 |
50 |
0.7 |
101 |
0.8 |
98 |
0.8 |
93 |
0.8 |
75 |
0.7 |
83 |
0.7 |
50 |
0.4 |
81 |
0.7 |
80 |
0.8 |
69 |
0.7 |
|
|
831 |
0.7 |
12 |
1,099 |
15.8 |
1,010 |
14.8 |
2,380 |
18.4 |
2,487 |
21.5 |
2,149 |
18.6 |
1,980 |
17.3 |
1,940 |
17.2 |
1,127 |
10.1 |
1,902 |
16.2 |
2,138 |
22.0 |
828 |
8.8 |
|
|
19,040 |
15.5 |
13 |
43 |
0.6 |
32 |
0.5 |
80 |
0.6 |
70 |
0.6 |
79 |
0.7 |
83 |
0.7 |
42 |
0.4 |
36 |
0.3 |
77 |
0.7 |
56 |
0.6 |
40 |
0.4 |
|
|
638 |
0.5 |
14 |
30 |
0.4 |
20 |
0.3 |
64 |
0.5 |
65 |
0.6 |
51 |
0.4 |
64 |
0.6 |
46 |
0.4 |
23 |
0.2 |
55 |
0.5 |
78 |
0.8 |
9 |
0.1 |
|
|
505 |
0.4 |
15+ |
442 |
6.4 |
454 |
6.6 |
1,003 |
7.8 |
831 |
7.2 |
829 |
7.2 |
872 |
7.6 |
751 |
6.6 |
425 |
3.8 |
691 |
5.9 |
730 |
7.5 |
9 |
0.1 |
|
|
7,037 |
5.7 |
Total |
6,950 |
100.0 |
6,842 |
100.0 |
12,908 |
100.0 |
11,546 |
100.0 |
11,528 |
100.0 |
11,468 |
100.0 |
11,307 |
100.0 |
11,196 |
100.0 |
11,726 |
100.0 |
9,701 |
100.0 |
9,357 |
100.0 |
8,678 |
100.0 |
123,207 |
100.0 |
![]()
![]()
![]()
![]()
![]()
![]()
![]()
![]()
![]()
![]()
![]()
![]()
![]()
![]()
![]()
![]()
![]()
![]()
![]()
![]()
![]()
![]()
![]()

2017 Year-To-Date Data Quality Report |
Section IV: Proper Assignment of Disposition Codes |
Table 15B. Number of Attempts, by File Month |
(Cell phone only, restricted to state/territory, does not include out of state interviews) |
![]()
![]()
![]()
![]()


Attempts |
File Month |
Year-to-Date |
||||||||||||||||||||||||
January |
February |
March |
April |
May |
June |
July |
August |
September |
October |
November |
December |
|||||||||||||||
N |
% |
N |
% |
N |
% |
N |
% |
N |
% |
N |
% |
N |
% |
N |
% |
N |
% |
N |
% |
N |
% |
N |
% |
N |
% |
|
1 |
293 |
6.5 |
304 |
7.2 |
449 |
9.9 |
345 |
7.9 |
268 |
6.3 |
322 |
7.5 |
437 |
9.5 |
513 |
10.3 |
383 |
8.0 |
636 |
6.5 |
707 |
7.4 |
380 |
6.0 |
5,037 |
7.6 |
2 |
686 |
15.1 |
500 |
11.9 |
656 |
14.5 |
666 |
15.2 |
589 |
13.9 |
594 |
13.8 |
671 |
14.6 |
787 |
15.8 |
841 |
17.6 |
1,735 |
17.7 |
1,671 |
17.5 |
1,052 |
16.7 |
10,448 |
15.8 |
3 |
523 |
11.5 |
420 |
10.0 |
453 |
10.0 |
472 |
10.8 |
463 |
10.9 |
494 |
11.5 |
494 |
10.7 |
525 |
10.5 |
527 |
11.0 |
1,174 |
12.0 |
1,088 |
11.4 |
614 |
9.7 |
7,247 |
10.9 |
4 |
251 |
5.5 |
280 |
6.7 |
259 |
5.7 |
267 |
6.1 |
250 |
5.9 |
250 |
5.8 |
213 |
4.6 |
292 |
5.9 |
288 |
6.0 |
526 |
5.4 |
542 |
5.7 |
317 |
5.0 |
3,735 |
5.6 |
5 |
232 |
5.1 |
192 |
4.6 |
194 |
4.3 |
198 |
4.5 |
183 |
4.3 |
177 |
4.1 |
179 |
3.9 |
211 |
4.2 |
208 |
4.3 |
424 |
4.3 |
515 |
5.4 |
309 |
4.9 |
3,022 |
4.6 |
6 |
197 |
4.3 |
197 |
4.7 |
199 |
4.4 |
196 |
4.5 |
197 |
4.7 |
176 |
4.1 |
184 |
4.0 |
223 |
4.5 |
226 |
4.7 |
439 |
4.5 |
4,730 |
49.5 |
3,091 |
48.9 |
10,055 |
15.2 |
7 |
112 |
2.5 |
111 |
2.6 |
145 |
3.2 |
153 |
3.5 |
126 |
3.0 |
121 |
2.8 |
119 |
2.6 |
138 |
2.8 |
105 |
2.2 |
241 |
2.5 |
266 |
2.8 |
544 |
8.6 |
2,181 |
3.3 |
8 |
2,171 |
47.9 |
2,101 |
50.0 |
1,793 |
39.7 |
2,059 |
46.9 |
2,078 |
49.1 |
1,070 |
24.9 |
2,237 |
48.5 |
2,246 |
45.1 |
1,986 |
41.5 |
4,437 |
45.4 |
39 |
0.4 |
9 |
0.1 |
22,226 |
33.6 |
9 |
69 |
1.5 |
92 |
2.2 |
352 |
7.8 |
31 |
0.7 |
71 |
1.7 |
65 |
1.5 |
68 |
1.5 |
46 |
0.9 |
76 |
1.6 |
136 |
1.4 |
1 |
0.0 |
|
|
1,007 |
1.5 |
10 |
2 |
0.0 |
6 |
0.1 |
13 |
0.3 |
1 |
0.0 |
7 |
0.2 |
993 |
23.1 |
5 |
0.1 |
2 |
0.0 |
146 |
3.0 |
23 |
0.2 |
|
|
|
|
1,198 |
1.8 |
11 |
|
|
|
|
4 |
0.1 |
|
|
1 |
0.0 |
22 |
0.5 |
1 |
0.0 |
|
|
5 |
0.1 |
5 |
0.1 |
|
|
|
|
38 |
0.1 |
12 |
|
|
|
|
1 |
0.0 |
|
|
|
|
7 |
0.2 |
|
|
|
|
|
|
1 |
0.0 |
|
|
|
|
9 |
0.0 |
Total |
4,536 |
100.0 |
4,203 |
100.0 |
4,518 |
100.0 |
4,388 |
100.0 |
4,233 |
100.0 |
4,291 |
100.0 |
4,608 |
100.0 |
4,983 |
100.0 |
4,791 |
100.0 |
9,777 |
100.0 |
9,559 |
100.0 |
6,316 |
100.0 |
66,203 |
100.0 |
2017 Year-To-Date Data Quality Report |
|||||
Section V: Unit Nonresponse |
|||||
Table 16A. Cumulative Outcome Rates, Year-to-Date by File Month |
|||||
(Landline only) |
|||||
File Month |
Resolution rate |
Interview completion rate |
Cooperation ratea |
Refusal rateb |
AAPOR response ratec |
January |
81.7% |
67.3% |
57.6% |
19.8% |
40.8% |
February |
81.8% |
67.8% |
57.8% |
19.4% |
41.0% |
March |
82.0% |
70.8% |
59.7% |
17.3% |
41.9% |
April |
81.9% |
71.0% |
59.4% |
17.0% |
41.6% |
May |
82.0% |
70.3% |
59.1% |
17.1% |
40.6% |
June |
82.0% |
70.2% |
59.4% |
17.4% |
40.9% |
July |
81.9% |
70.3% |
59.4% |
17.3% |
40.9% |
August |
82.6% |
70.2% |
59.2% |
17.5% |
41.2% |
September |
82.5% |
70.0% |
59.2% |
17.4% |
40.7% |
October |
82.5% |
69.8% |
59.0% |
17.4% |
40.2% |
November |
82.5% |
69.8% |
59.0% |
17.4% |
40.1% |
December |
82.4% |
69.8% |
58.9% |
17.3% |
40.0% |
aAAPOR Cooperation rate, version 2 formula, does not include disposition code 2220 bAAPOR Refusal rate, version 4 formula cAAPOR Response rate, version 4 formula |
|||||
2017 Year-To-Date Data Quality Report |
|||||
Section V: Unit Nonresponse |
|||||
Table 16B. Cumulative Outcome Rates, Year-to-Date by File Month |
|||||
(Cell phone only, restricted to state/territory, does not include out of state interviews) |
|||||
File Month |
Resolution rate |
Interview completion rate |
Cooperation ratea |
Refusal rateb |
AAPOR response ratec |
January |
54.6% |
82.8% |
79.5% |
9.0% |
43.4% |
February |
54.8% |
82.4% |
79.1% |
9.2% |
43.4% |
March |
54.6% |
82.5% |
79.2% |
9.2% |
43.3% |
April |
54.3% |
80.5% |
77.3% |
10.2% |
42.0% |
May |
54.1% |
79.5% |
76.5% |
10.7% |
41.3% |
June |
54.0% |
79.3% |
76.3% |
10.7% |
41.2% |
July |
54.0% |
78.7% |
75.8% |
11.1% |
40.9% |
August |
53.7% |
77.9% |
75.1% |
11.4% |
40.3% |
September |
53.6% |
77.9% |
75.3% |
11.4% |
40.4% |
October |
53.7% |
78.0% |
75.4% |
11.4% |
40.5% |
November |
53.7% |
78.0% |
75.2% |
11.4% |
40.4% |
December |
53.5% |
77.8% |
75.0% |
11.5% |
40.2% |
aAAPOR Cooperation rate, version 2 formula, does not include disposition code 2220 bAAPOR Refusal rate, version 4 formula cAAPOR Response rate, version 4 formula |
|||||
2017 Year-To-Date Data Quality Report |
Section VI: Item Nonresponse |
Table 17A. Income (77 and 99 collapsed), Year-to-Date |
Base=Completes only (Landline only) |
![]()
![]()
![]()
![]()
![]()
![]()
![]()
Income Levels |
Male |
Female |
Total |
|||
Frequency |
Percent |
Frequency |
Percent |
Frequency |
Percent |
|
LT 10K |
88 |
4.0 |
266 |
6.3 |
354 |
5.5 |
10-15K |
82 |
3.7 |
258 |
6.1 |
340 |
5.3 |
15-20K |
140 |
6.4 |
313 |
7.4 |
453 |
7.1 |
20-25K |
148 |
6.7 |
365 |
8.6 |
513 |
8.0 |
25-35K |
187 |
8.5 |
433 |
10.3 |
620 |
9.7 |
35-50K |
279 |
12.7 |
497 |
11.8 |
776 |
12.1 |
50-75K |
306 |
13.9 |
490 |
11.6 |
796 |
12.4 |
75+K |
717 |
32.6 |
867 |
20.5 |
1,584 |
24.7 |
Unknown/Refused |
253 |
11.5 |
733 |
17.4 |
986 |
15.4 |
Total |
2,200 |
100.0 |
4,222 |
100.0 |
6,422 |
100.0 |
2017 Year-To-Date Data Quality Report |
Section VI: Item Nonresponse |
Table 17B. Income (77 and 99 collapsed), Year-to-Date |
Base=Completes only (Cell phone only, restricted to state/territory, does not include out of state interviews) |
![]()
![]()
![]()
![]()
![]()
![]()
![]()
Income Levels |
Male |
Female |
Total |
|||
Frequency |
Percent |
Frequency |
Percent |
Frequency |
Percent |
|
LT 10K |
110 |
4.9 |
194 |
8.0 |
304 |
6.5 |
10-15K |
108 |
4.8 |
171 |
7.0 |
279 |
5.9 |
15-20K |
173 |
7.6 |
228 |
9.3 |
401 |
8.5 |
20-25K |
202 |
8.9 |
247 |
10.1 |
449 |
9.5 |
25-35K |
188 |
8.3 |
253 |
10.4 |
441 |
9.4 |
35-50K |
256 |
11.3 |
231 |
9.5 |
487 |
10.4 |
50-75K |
279 |
12.3 |
250 |
10.2 |
529 |
11.3 |
75+K |
721 |
31.9 |
532 |
21.8 |
1,253 |
26.6 |
Unknown/Refused |
225 |
9.9 |
334 |
13.7 |
559 |
11.9 |
Total |
2,262 |
100.0 |
2,440 |
100.0 |
4,702 |
100.0 |
2017 Year-To-Date Data Quality Report |
Section VII: Household Rosters, Number of Adults, and Number of Phones |
Table 18. Household Roster Status, by File month, |
Base=Records with Partial or Complete Household Rosters (Landline only) |
File Month |
Partial |
Inconsistent |
Consistent |
Total |
||||
N |
% |
N |
% |
N |
% |
N |
% |
|
January |
|
0.0 |
|
0.0 |
381 |
100.0 |
381 |
100.0 |
February |
|
0.0 |
|
0.0 |
349 |
100.0 |
349 |
100.0 |
March |
|
0.0 |
|
0.0 |
793 |
100.0 |
793 |
100.0 |
April |
|
0.0 |
|
0.0 |
603 |
100.0 |
603 |
100.0 |
May |
|
0.0 |
|
0.0 |
583 |
100.0 |
583 |
100.0 |
June |
|
0.0 |
|
0.0 |
628 |
100.0 |
628 |
100.0 |
July |
|
0.0 |
|
0.0 |
578 |
100.0 |
578 |
100.0 |
August |
|
0.0 |
|
0.0 |
486 |
100.0 |
486 |
100.0 |
September |
|
0.0 |
|
0.0 |
530 |
100.0 |
530 |
100.0 |
October |
|
0.0 |
|
0.0 |
524 |
100.0 |
524 |
100.0 |
November |
|
0.0 |
|
0.0 |
548 |
100.0 |
548 |
100.0 |
December |
|
0.0 |
|
0.0 |
458 |
100.0 |
458 |
100.0 |
Total |
|
0.0 |
|
0.0 |
6,461 |
100.0 |
6,461 |
100.0 |
2017 Year-To-Date Data Quality Report Section VII: Household Rosters, Number of Adults, and Number of Phones Table 19. Number of Adults by File Month and Year-to-Date Base=Completes only (Landline only) |
||||||||||||||||||||
File Month |
Adults in HH |
|||||||||||||||||||
1 |
2 |
3 |
4 |
5 |
6 |
7 |
8 |
17 |
23 |
|||||||||||
N |
% |
N |
% |
N |
% |
N |
% |
N |
% |
N |
% |
N |
% |
N |
% |
N |
% |
N |
% |
|
January |
149 |
5.9 |
180 |
5.9 |
42 |
6.6 |
8 |
4.0 |
2 |
5.7 |
|
|
|
|
|
|
|
|
|
|
February |
130 |
5.2 |
187 |
6.1 |
18 |
2.8 |
10 |
5.0 |
3 |
8.6 |
1 |
6.3 |
|
|
|
|
|
|
|
|
March |
295 |
11.7 |
384 |
12.5 |
79 |
12.5 |
28 |
14.0 |
5 |
14.3 |
2 |
12.5 |
|
|
|
|
|
|
|
|
April |
226 |
9.0 |
289 |
9.4 |
62 |
9.8 |
18 |
9.0 |
5 |
14.3 |
2 |
12.5 |
|
|
|
|
1 |
100.0 |
|
|
May |
247 |
9.8 |
261 |
8.5 |
55 |
8.7 |
18 |
9.0 |
1 |
2.9 |
1 |
6.3 |
|
|
|
|
|
|
|
|
June |
244 |
9.7 |
285 |
9.3 |
75 |
11.8 |
16 |
8.0 |
6 |
17.1 |
2 |
12.5 |
|
|
|
|
|
|
|
|
July |
221 |
8.8 |
279 |
9.1 |
51 |
8.1 |
24 |
12.0 |
1 |
2.9 |
2 |
12.5 |
|
|
|
|
|
|
|
|
August |
187 |
7.4 |
230 |
7.5 |
51 |
8.1 |
13 |
6.5 |
2 |
5.7 |
2 |
12.5 |
|
|
|
|
|
|
1 |
100.0 |
September |
213 |
8.5 |
237 |
7.7 |
53 |
8.4 |
20 |
10.0 |
3 |
8.6 |
3 |
18.8 |
|
|
1 |
100.0 |
|
|
|
|
October |
194 |
7.7 |
265 |
8.7 |
55 |
8.7 |
8 |
4.0 |
2 |
5.7 |
|
|
|
|
|
|
|
|
|
|
November |
219 |
8.7 |
257 |
8.4 |
48 |
7.6 |
18 |
9.0 |
4 |
11.4 |
1 |
6.3 |
1 |
100.0 |
|
|
|
|
|
|
December |
187 |
7.4 |
207 |
6.8 |
44 |
7.0 |
19 |
9.5 |
1 |
2.9 |
|
|
|
|
|
|
|
|
|
|
Year-to-Date |
2,512 |
100.0 |
3,061 |
100.0 |
633 |
100.0 |
200 |
100.0 |
35 |
100.0 |
16 |
100.0 |
1 |
100.0 |
1 |
100.0 |
1 |
100.0 |
1 |
100.0 |
2017 Year-To-Date Data Quality Report Section VII: Household Rosters, Number of Adults, and Number of Phones Table 20. Number of Phones by File Month and Year-to-Date Base=Completes only (Landline only) |
||||||||||||
File Month |
Phones in HH |
|||||||||||
1 |
2 |
3 |
4 |
5 |
6 |
|||||||
N |
% |
N |
% |
N |
% |
N |
% |
N |
% |
N |
% |
|
January |
366 |
5.9 |
7 |
5.0 |
3 |
8.1 |
1 |
14.3 |
1 |
50.0 |
|
|
February |
335 |
5.4 |
12 |
8.5 |
1 |
2.7 |
1 |
14.3 |
|
|
|
|
March |
764 |
12.2 |
15 |
10.6 |
10 |
27.0 |
1 |
14.3 |
|
|
|
|
April |
586 |
9.4 |
7 |
5.0 |
4 |
10.8 |
2 |
28.6 |
|
|
|
|
May |
562 |
9.0 |
13 |
9.2 |
2 |
5.4 |
|
|
|
|
|
|
June |
610 |
9.8 |
11 |
7.8 |
3 |
8.1 |
2 |
28.6 |
1 |
50.0 |
|
|
July |
555 |
8.9 |
16 |
11.3 |
3 |
8.1 |
|
|
|
|
|
|
August |
472 |
7.6 |
9 |
6.4 |
1 |
2.7 |
|
|
|
|
|
|
September |
508 |
8.1 |
14 |
9.9 |
4 |
10.8 |
|
|
|
|
1 |
100.0 |
October |
509 |
8.2 |
12 |
8.5 |
3 |
8.1 |
|
|
|
|
|
|
November |
529 |
8.5 |
16 |
11.3 |
2 |
5.4 |
|
|
|
|
|
|
December |
444 |
7.1 |
9 |
6.4 |
1 |
2.7 |
|
|
|
|
|
|
Year-to-Date |
6,240 |
100.0 |
141 |
100.0 |
37 |
100.0 |
7 |
100.0 |
2 |
100.0 |
1 |
100.0 |
Appendix G: Crisis Protocol
Step 1: Recognize that a respondent is possibly distressed.
Signs that a respondent is possibly in crisis:
Hesitancy to answer a question or questions;
Refusal to answer questions or to continue the interviewing process;
Lowering of the volume or tone of his/her voice;
Responding in an agitated manner by raising his/her voice or using inappropriate language;
Crying;
Indications of tremors, a quavering in the respondent's voice;
Disorganization, dissociation, or non-responsiveness to questions asked.
Step 2: Assess the level of distress that a respondent is apparently experiencing.
Below is a table that provides the some guidance to you as to what indicators you might become aware of on the telephone indicating that a person is in distress or approaching a crisis.
Level of Distress |
Signs or Indicators of Distress |
Level 1 : Minimal |
Change in voice tone or volume. Changes in focus. Hesitancy to answer questions.
|
Level 2: In-Need of Referral |
Level 1 signs plus any of the following: Displays an unwillingness or hesitancy to continue. Sobbing, weeping, and/or crying on the telephone. Displays other obvious signs of agitation. |
Level 3: Immediate Help |
Includes a combination or all of the signs for Level 1 and/or Level 2 plus the following: Respondent openly states the intention to hurt her/himself. Respondent openly states his/her intention to hurt other people. Respondent openly asks for help. |
Step 3: Respond appropriately to the situation.
Based on your assessment of the level of distress it is imperative that you react appropriately and with sensitivity.
Distress Level |
Interviewer Actions |
Supervisor Actions |
Project Management Actions |
Level 1 |
Assess where you are in the questionnaire and ask respondent if it is ok to continue: “Is it ok to continue?“ Depending on how s/he answers and where you are in the questionnaire you may do the following:
|
If needed: Come over to the interviewer and be prepared to help out by connecting or doing a hot transfer to the hotline.
Supervisor is alerted for all interviews that terminate or result in a hang-up after the offer of a break. Supervisor will get the masterid for the case and will inform the project managers about the situation – date, time, and a detailed description of the interaction between the interviewer and the respondent, including the survey question at which it occurred.
|
Project Managers review the case and possibly follow-up with the supervisor and interviewer for more information. Project Management decides if any follow-up calls are made to the hang-ups or terminated interviews |
Level 2 |
Raise your hand and get a supervisor’s attention while you affirm what you hear: “I can hear that this interview is upsetting you. Would you like some help? I can provide you a phone number or connect you to someone who can help you. If the respondent says YES – refer to the hotline number in your special screen the appropriate referral (hotline number listed below) based on what the respondent seems to be upset about.
If
the respondent says NO, or if they say “yes” to you
providing the phone number, but they don’t want you to
connect them to the hotline/phone number now ask if s/he would
like to continue the interview now or later
|
Come over to the interviewer and be prepared to help out by connecting or doing a hot transfer to the hotline. File an adverse event report with project management staff informing them that a referral was given, the masterid, the interviewer id, date, time, details of the interaction, if QA was listening, where it occurred in the interview, and if the appropriate protocols were followed.
|
Project Management reviews and files the adverse event report. This type of report is kept by project management but not forwarded to the IRB. Project Management decides if any follow-up calls are made to the hang-ups or terminated interviews.
|
Level 3 |
Raise your hand and get a supervisor’s attention.
If a respondent is exhibiting level 3 crisis signs, or reporting that they want to hurt themselves: Affirm what you hear: “I can tell that this interview is upsetting you.” “I can provide you a phone number of or connect you to someone who can help you now” “I would like to stay on the line with you while my colleague calls X? OK?” Keep the person informed about what is happening, do what the respondent says.
“This interview can be very stressful, and I think we should stop for now, but sometimes talking to someone can be helpful. I Can provide you a number or connect you to someone who may be able to help you now. Would you like me to give you the number, or connect you?” If the respondent says YES, provide referral telephone numbers or connect (with supervisor help) before getting off the call. If the person just asks to stop at any point, suspend with a terminal disposition 169 “respondent ends interview due to distress”, or if s/he hangs up, disposition 169 “respondent ends interview due to distress, with a note. Always record masterid and get supervisor help. If a respondent reports that they want to hurt someone else:
Raise
your hand and get a supervisors attention. “Do you have a plan on how to do this?” “Do you have the means or ability to carry out your plan?” “Are you thinking of doing this now?” If respondent says yes to 3 of the above, risk of harm is HIGH.
Attempt
to keep respondent on phone if possible.
|
Come over to the interviewer and be prepared to help out by connecting/doing a hot transfer to the hotline. Signal for QA to get on the line too and take notes. Make the necessary calls/hot transfers (SEE DETAIL BELOW FOR CALLS WHEN A RESPONDENTS REPORTS WANTING TO HURT SOMEONE ELSE) If the respondent terminates the call before someone can be contacted for her, or before we can obtain her locations– call supervisor to find out whether additional calls can or should be made immediately. File an adverse event report with project management staff informing them that a referral was given, the masterid, the interviewer id, date, time, details of the interaction, if QA was listening, where it occurred in the interview, and if the appropriate protocols were followed. The form needs to be filed on that shift. If a level 3 situation is encountered call center and project management need to be called. Additional NOTE: IF A RESPONDENT REPORTS THEY WANT TO HURT SOMEONE ELSE. DO ALL OF THE ABOVE AS WELL AS THE FOLLOWING: Help in the evaluation of risk, confirm if the respondent provides 1-3 YES’s and instruct the interviewer as to what to do – Make the necessary calls to local emergency services/local 911 services, based on respondent phone number. Explain to emergency services who you are, why you are calling and that you would like a house call to ensure that the household is safe.
Follow Level 3 protocol for call center management notification immediately; file and adverse event report form that shift. |
Project Management reviews and files the adverse event report. Project Management debriefs with the interviewer, supervisor and QA who filed the report as soon as possible. IRB may advise about the need to change or revise protocols as a result of the event, or the appropriate follow-up to the event. Project Management implements and follows-up as directed. Project Management informs the call center staff about the outcomes of the event to the extent that they are able to and it is legally possible. If there is to be a follow-up call to the respondent, Project Management will direct the call center as to how the callback is to be made (e.g., using an interviewer with special training.)
|
Step 4: Document the case—Adverse Event Report Form
When a Level 2 or Level 3 situation is encountered it is necessary to document the case immediately while the event is fresh in your mind. There is an Adverse Event Form included in the training materials in Appendix 2 and available on the network and ISite for you to use for this purpose. More detail and information is better than less. This needs to be filled out on the shift in which it occurs and immediately sent electronically to project management and the hard copy sent to the Project Director,Carol Pierannuzi.
The Adverse Event Report Form needs to include at a minimum the masterid, time, date, details of the event – which should include the survey question at which the event occurred – so someone else can understand why it was assessed as a level 2 or 3, and the names and signatures of the call center staff who observed the event.
It is paramount that once you think you are in a level 2 or level 3 situation that you get someone else to be listening to the call – get the floor supervisor over, get QA on the line, get the interviewer next to you too until a supervisor comes over. Everyone and anyone who listens to all of part of the interaction needs to fill out the Adverse Event Form.
Dealing with a difficult or crisis situation on the telephone can be emotionally draining and take a toll on you. After the call is over and you have documented, take a break. And when you go home at the end of your shift – take care of yourself even more. Refer to the training manual section on self-care for more information.
Situations Involving Other Individuals
If at any time during the telephone interview you believe that someone is listening in – perhaps you hear a telephone picked-up or you hear someone breathing other than the respondent, you should stop asking questions and ask if s/he would still like to continue the interview and do what s/he says – continue, suspend and schedule a callback, suspend with providing his/her information to call in, or terminate. Leave a message as to what occurred in the interviewer notes field of the CATI program.
If you hear someone, anyone, enter the location where the respondent is participating in the interview – you should ask her/him if s/he wants to continue at another time– continue, suspend and schedule a callback, suspend with providing her information to call in, or terminate. Leave a message as to what occurred in the interviewer notes field of the CATI program.
In either of the above cases, if the situation is too complex to be adequately described in the message field, alert a supervisor (make sure you give your supervisor the masterid), who will document the situation in an email that will be sent to Project Management.
Suicide Prevention Network Helpline:
1) National Suicide Prevention Helpline: 1-800-273-TALK (8255)
Trained crisis workers are available to talk 24 hours a day, 7 days a week. Your confidential and toll-free call goes to the nearest crisis center in the Lifeline national network. These centers provide crisis counseling to individuals who are suicidal or experiencing emotional distress. Mental health referrals are also provided.

Friday, November 2, 2018
| File Type | application/vnd.openxmlformats-officedocument.wordprocessingml.document |
| Author | CDC User |
| File Modified | 0000-00-00 |
| File Created | 2021-01-15 |
© 2026 OMB.report | Privacy Policy