Form 1 Draft Manual
HIV Quality Measures Performance Measure Module (HIVQM Module)
Draft Manual_reviewed
HIV Quality Measures Performance Measure Module (HIVQM Module)
OMB: 0906-0022
Ryan White HIV/AIDS Program
HIV Quality Measures (HIVQM)
Module
Instruction Manual 2018

Date: June 5, 2019
Version: 2
Public Burden Statement: An agency may not conduct or sponsor, and a person is not required to respond to, a collection of information unless it displays a currently valid OMB control number. The OMB control number for this project is 0906-0022. Public reporting burden for this collection of information is estimated to average 1 hour per response, including the time for reviewing instructions, searching existing data sources, and completing and reviewing the collection of information. Send comments regarding this burden estimate or any other aspect of this collection of information, including suggestions for reducing this burden, to HRSA Reports Clearance Officer, 5600 Fishers Lane, Room 14N39, Rockville, Maryland, 20857
HIV/AIDS Bureau
Division of Policy and Data
Health Resources and Services Administration
U.S. Department of Health and Human Services
5600 Fishers Lane, Room 9N164
Rockville, MD 20857
Table of Contents
The HIV Quality Measure Module 2
What are the components of the HIVQM Module? 3
Which clients can be included in the HIVQM Module? 3
Who enters data in the HIVQM Module? 3
How do you access the HIVQM Module? 3
How are the HIVQM Module data submitted to HAB? 4
Instructions for Completing the HIVQM Module 5
Step One: Access the most recent RSR deliverable. 5
Step Two: Access the HIVQM Module 6
Access prior reports during the March submission period NEW! 6
Step Three: Completing the Provider Information Page 7
Step Four: Entering Performance Measures Data 9
Uploading Performance Measures Data NEW! 9
Manually Entering Performance Measures Data 11
Step Five: Generate HIVQM Reports 13
Comparison trend report NEW! 15
Program Parts Comparison Report NEW! 15
Background
The Ryan White HIV/AIDS Treatment Extension Act of 2009 (Public Law 111-87, October 30, 2009) provides the federal HIV programs in the Public Health Service Act under Title XXVI, flexibility to respond effectively to the changing epidemic. It emphasizes providing life-saving and life-extending services for people living with HIV (PLWH) across the country and providing resources to targeted areas with the greatest need.
All Program Parts of the Ryan White HIV/AIDS Program (RWHAP) specify the Health Resources and Services Administration’s (HRSA’s) responsibilities in the allocation and administration of grant funds, as well as the evaluation of programs for the population served, and the improvement of the quality of care. The provision of accurate records of the recipients receiving RWHAP funding, the services provided, and the clients served continue to be critical to the implementation of the statute and thus are necessary for HRSA to fulfill its responsibilities.
The RWHAP statute authorizes the use of grant funds to improve the quality, availability, and organization of HIV health care and support services. Specifically, recipients are required to establish a clinical quality management program (CQM) to:
assess the extent to which HIV services are consistent with the most recent Public Health Service guidelines (otherwise known as the HHS guidelines) for the treatment of HIV disease and related opportunistic infections; and
develop strategies for ensuring that such services are consistent with the guidelines for improvement in the access to, and quality of HIV services.
Since 2007, the HIV/AIDS Bureau (HAB) has released performance measures for recipients to use as guidance for their CQM program; however, recipients are not required to use the HAB developed measures nor are they required to submit performance measure data. Recipients do report on some clinical data elements through the required Ryan White HIV/AIDS Program Services Report (RSR) on an annual basis; however, these data give HAB only a snapshot of the quality of HIV services provided by recipients.
In 2013, HAB introduced new HIV performance measures, located at: https://hab.hrsa.gov/clinical-quality-management/performance-measure-portfolio with the goals of:
Identifying core performance measures that are most critical to the care and treatment of PLWH;
Combining measures to address PLWH of all ages;
Aligning measures with U.S. Department of Health and Human Services priorities, guidelines, and initiatives;
Promoting relevant performance measures used in other federal programs;
Archiving performance measures; and
Monitoring progress toward achieving the goals identified in the National HIV/AIDS Strategy.
The HIV Quality Measure Module
HAB developed the HIV Quality Measures (HIVQM) Module, a tool within the existing RSR portal, to allow recipients to voluntarily enter aggregate data on the HAB performance measures. This tool offers recipients and their subrecipients an easy-to-use and structured platform to continually monitor their performance in serving clients, particularly in providing access to care and quality HIV services. Recipients and subrecipients may find the tool helpful as they set goals for performance measures and quality improvement projects. Finally, the HIVQM Module allows recipients to obtain reports that compare providers regionally and nationally against other providers. HRSA expects the HIVQM Module will better support CQM, performance measurement, service delivery, and client monitoring at both the recipient and client levels, enhancing the submitted data’s quality and utility.
Recipients and service providers who participate in a Centers for Medicare and Medicaid Incentive program, such as the Medicare and Medicaid Electronic Health Records Incentive Program and the Physician Quality Reporting System, may also find the HIVQM Module helpful because data submitted qualify and comply with these programs’ requirements.
What’s new?
HRSA HAB has added new features to improve the HIVQM Module, including the following.

Note that the reports will only represent data of organizations that submitted data into the HIVQM Module.
The HIVQM Reports will now generate three different types of reports:
The Summary Report, which was available last year, will now also include state-level data in addition to regional and national data.
The Comparison Trend Report is a new report that will allow recipients to compare their performance data at the organizational, state, regional, and national level over a 5-year period.
Program Parts Comparison Report is another report that will allow recipients to compare performance measures data by Ryan White Part.
See Step Five: Generate HIVQM Reports for more instructions on how to view these new reports.
Recipients will be able to upload performance measures data from a CSV file.
See Uploading Performance Measures Data NEW! for more instructions on how to upload CSV files.
Recipients will be able to access prior reports during the March submission period to enter and update data. In March 2019, recipients can to go back to these previous reporting periods:
January 1, 2018–December 31, 2018
October 1, 2017–September 30, 2018
July 1, 2017– June 30, 2018
April 1, 2017–March 31, 2018
See Access prior reports during the March submission period NEW! for more instructions on how to access prior reports.
What are the components of the HIVQM Module?
The HIVQM Module comprises three (3) parts:
The Provider Information page consists of four (4) prepopulated data points about the provider (generated from the latest RSR).
The Performance Measures section is where recipients can choose and enter aggregate data on up to 44 clinical measures under these nine (9) main categories:
Core
All Ages
Adolescent and Adult
Children
HIV-Exposed Children
Medical Case Management
Oral Health
ADAP
Systems-Level
For more detailed information on these clinical measures, visit the HAB webpage at: https://hab.hrsa.gov/clinical-quality-management/performance-measure-portfolio.
The HIVQM Reports are where recipients can generate reports based on their own data as well as compare their data to other recipients and/or subrecipients that have entered data into the Module. The comparison reports do not include the identity of the other recipients or subrecipients.
Which clients can be included in the HIVQM Module?
All clients who receive HIV services, regardless of funding source, can be included in the HIVQM Module.
Who enters data in the HIVQM Module?
The use of the HIVQM Module is voluntary, but it is strongly encouraged. The HIVQM Module is available for each recipient and subrecipient who provide HIV care services and can enter their own data. Recipients can complete the data entry in the Module for any of their subrecipients.
How do you access the HIVQM Module?
Access the Module through the existing RSR web system (you must be able to access your RSR with a login and password). To learn how to access the Module from the RSR Report webpage, see page 5.
When can you enter data?
The Module is available to recipients and subrecipients four (4) times a year—March, June, September, and December—to submit performance measure data for a specified 12-month period. These reporting periods are outlined in the table below.
HIVQM Module Opens |
HIVQM Module Closes |
Reporting Period |
March 1, 2019* |
March 31, 2019 |
January 1, 2018–December 31, 2018 |
June 1, 2019 |
June 30, 2019 |
April 1, 2018–March 31, 2019 |
September 1, 2019 |
September 30, 2019 |
July 1, 2018–June 30, 2019 |
December 1, 2019 |
December 31, 2019 |
October 1, 2018–September 30, 2019 |
* Recipients and subrecipients are able to access prior reporting periods to update and/or enter data.
How are the HIVQM Module data submitted to HAB?
Once you have entered and saved data in the Provider Information and the Performance Measures sections, you have submitted your data. HAB will have access to the data at the conclusion of each submission period.
Instructions for Completing the HIVQM Module
Each recipient and its subrecipients have access to the HIVQM Module. Those that receive funding from multiple parts only need to access the Module once to enter data. For example: If an agency receives Part A and C funding, it will only need to enter data once per submission period. The Part A and C grant recipients of record will have access to those data.
![]() Enter data for all clients who receive
HIV services, regardless of funding source.
Enter data for all clients who receive
HIV services, regardless of funding source.
Step One: Access the most recent RSR deliverable.
There are two ways that you can access the most recent RSR deliverable, depending on whether you are a recipient-provider or a service-provider:
Recipient-Providers only: Log in to the EHBs at https://grants.hrsa.gov/webexternal and navigate to the RSR Performance Report webpage.
Click the “Grants” tab on the top-left side of the screen. From there, a list of affiliated grants will appear.
Click the “Grants folder” link for a grant you receive RWHAP funds.
Click the “Performance Reports” link under the “Submission” heading, and click “Start” or “Edit.”
Service-Providers only: Log in to the RSR web system at: https://performance.hrsa.gov/hab/regloginapp/admin/login.aspx?application=rsrApp and navigate to the RSR Performance Report webpage.
I |
Step Two: Access the HIVQM Module
Once in the RSR Recipient Report Inbox, click the “HIVQM Inbox” link under the “Performance Measures” heading on the Navigation panel on the left side of the screen. See Figure 1 for a screenshot of the RSR Grantee Report Inbox.
Figure 1. RSR Grantee Report Inbox

In the HIVQM Report Inbox, find the provider name you want to enter data for and click the envelope icon on the right under the “Action” column. See Figure 2 for a screenshot of the HIVQM Inbox. This will take you to the first section of the HIVQM Module, the Provider Information page.
Figure 2. HIVQM Inbox

Access prior reports during the March submission period NEW!
Once a year, during the March submission period, recipients and subrecipients will be able to enter and update data for the previous four reporting periods. These reporting periods will be listed in the HIVQM Report Inbox. See Figure 2a for a screenshot of the HIVQM Inbox during March Reporting Period. To enter and update data for a reporting period, click the envelope icon on the right under the “Action” column. Note that for reporting periods with no previous data, the comment under the “Status” column will display “Not Started,” but you will still be able to enter data by clicking the envelope icon.
Figure 2a. HIVQM Inbox during March Reporting Period

Step Three: Completing the Provider Information Page
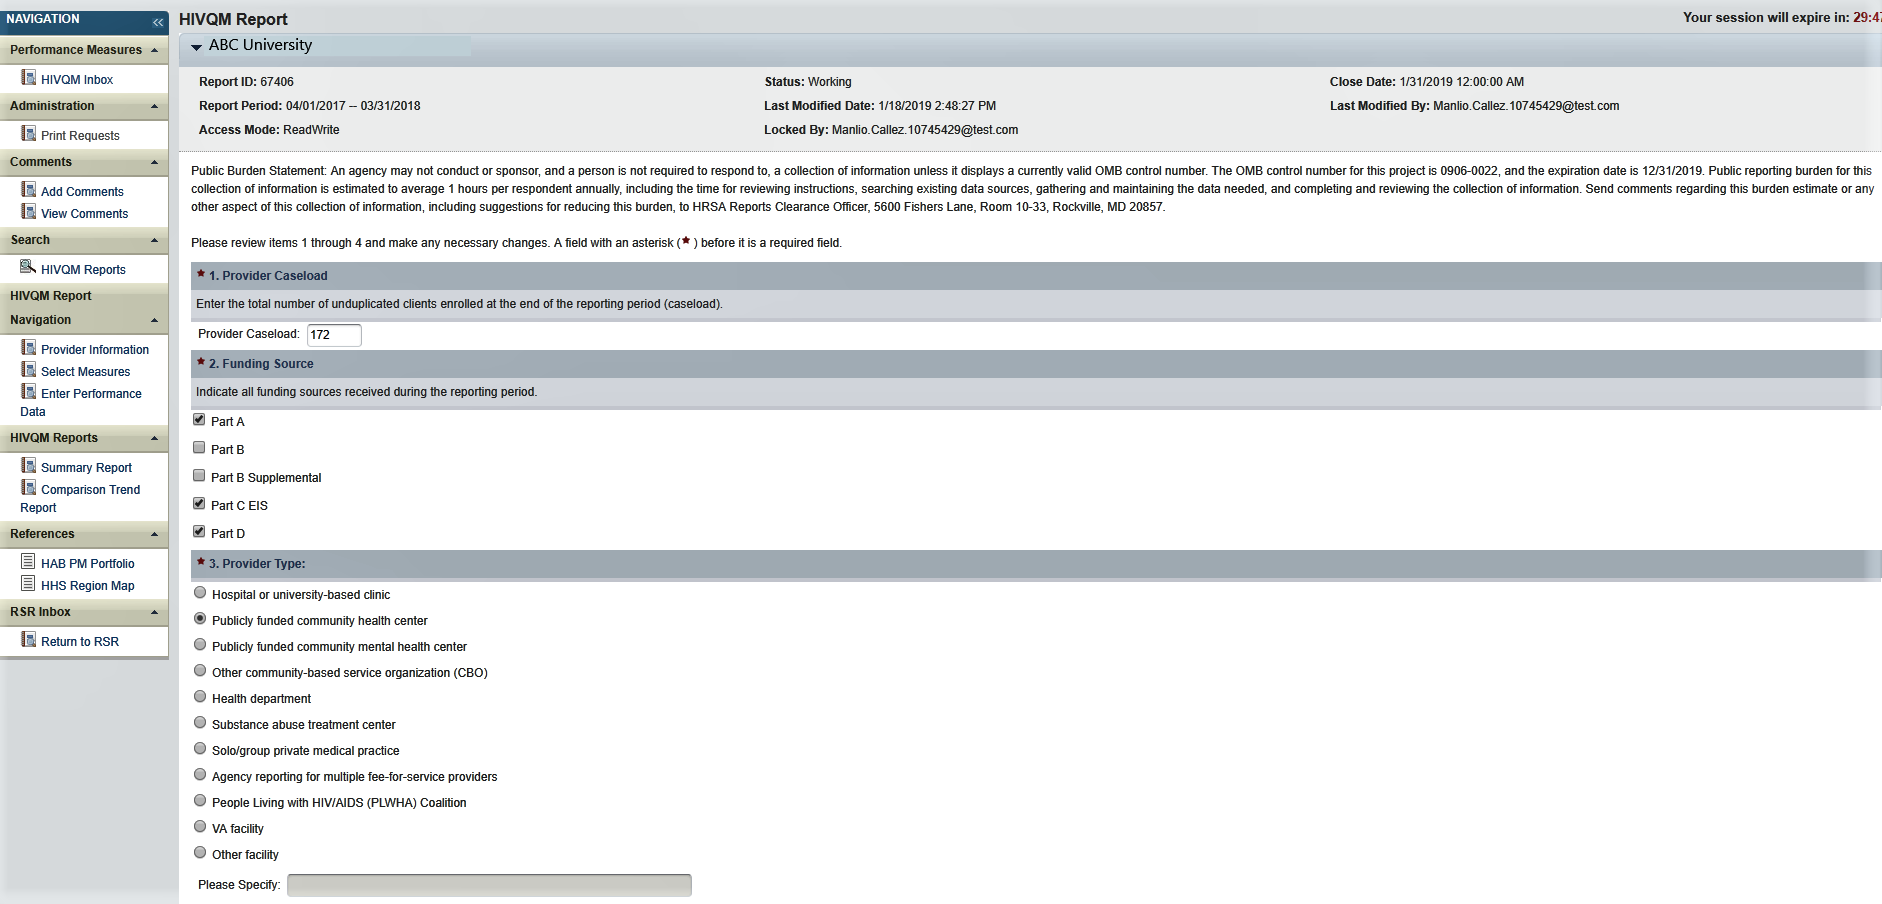
The Provider Information page will be prepopulated with data from your last RSR and consists of four (4) items. Check the information already captured on the page and update any incorrect data. Below are the items and option responses. See Figures 3a–b for screenshots of the Provider Information page.
Provider Caseload: Total number of unduplicated clients enrolled at the end of the reporting period. Enter a number up to seven (7) characters; it must be greater than zero.
Funding Source: Indicate all your agency’s funding sources received during the HIVQM reporting period by clicking the corresponding checkboxes. You must select at least one funding source, and you can select more than one if applicable to your agency.
Part A
Part B
Part B Supplement
Part C EIS
Part D
Provider Type: Indicate the agency type that best describes your agency by clicking the appropriate radio button. If you choose Other facility, please specify a description. You must indicate at least one provider type.
Hospital or university-based clinic
Publicly funded community health center
Publicly funded community mental health center
Other community-based service organization (CBO)
Health department
Substance abuse treatment center
Solo/group private medical practice
Agency reporting for multiple fee-for-service providers
People Living with HIV/AIDS (PLWH) Coalition
VA facility
Other facility (Please specify)
Figure 3a. HIVQM: Provider Information Page
Data Collection: This item consists of three (a–c) entries regarding your data collection system(s). You must enter data for 4a and 4b. You must enter data for 4c only if you selected Other in 4b.
Does your organization use a computerized data collection system? Click the appropriate radio button.
Yes, all electronic
Yes, part paper and part electronic
No
Unknown
What is the name of your current data collection system(s)? Indicate all systems that your agency uses by clicking the corresponding checkboxes.
AIRES
Allscripts
AVIGA
CAREWare
Casewatch Millenium
Cerner
eClinicalWorks
eCOMPAS
EHS CareRevolution
Epic
ETO Software
FutureBridge
GE/Centricity
Sage/Vitera
NextGen
Provide Enterprise
SCOUT
Other
Unknown
If you selected Other in 4b, enter in the text field any data collection system(s) used to run performance measures that are not listed in 4b. Use a semicolon to separate multiple items.
Figure 3b. HIVQM: Provider Information Page
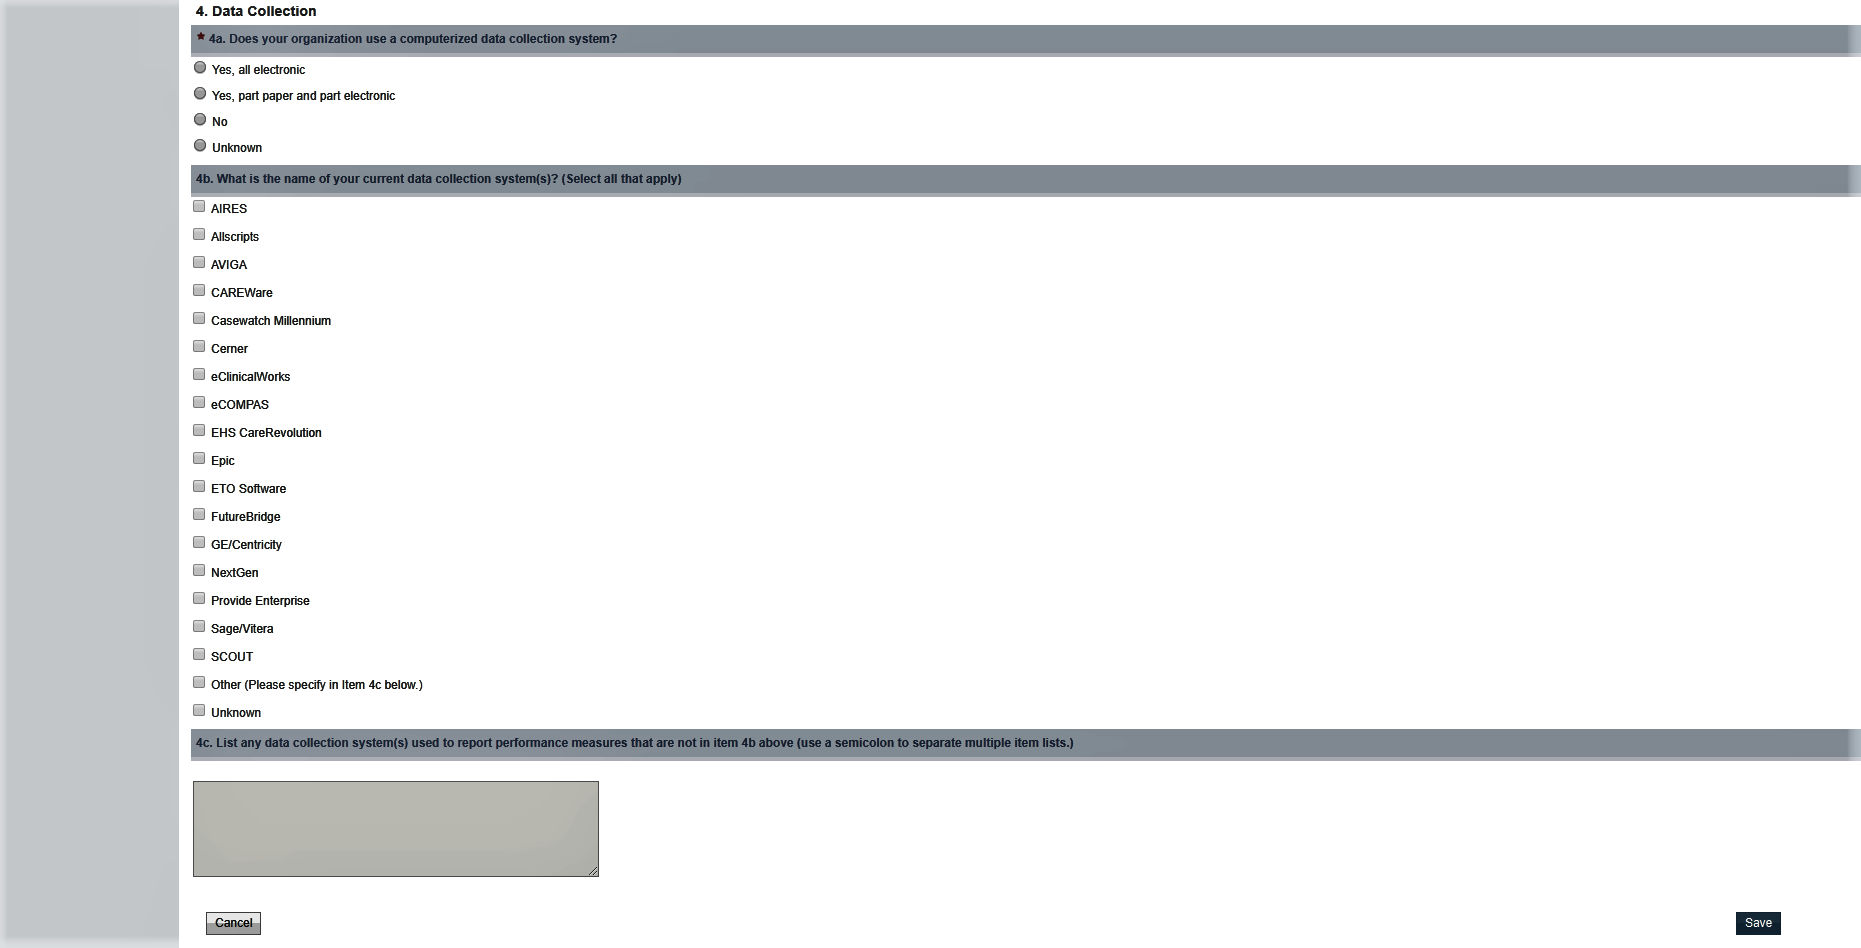
Once you have completed the Provider Information page, save your data by clicking “Save” on the bottom right of the screen. If you did not enter data for all items, you will receive an error message to return to the item with missing data and correct it. You will not be able to save your data until you have addressed all error messages.
Step Four: Entering Performance Measures Data
Recipients and subrecipients can now enter performance measures data in two ways: via data upload from a CVS file into the EHB or manually entering the data into the EHB performance measures pages. Below you will find instructions for both ways.
Uploading Performance Measures Data NEW!
Instructions on how to create a CSV
file can be found in Appendix A.
A list of valildations can be found in
Appendix B.
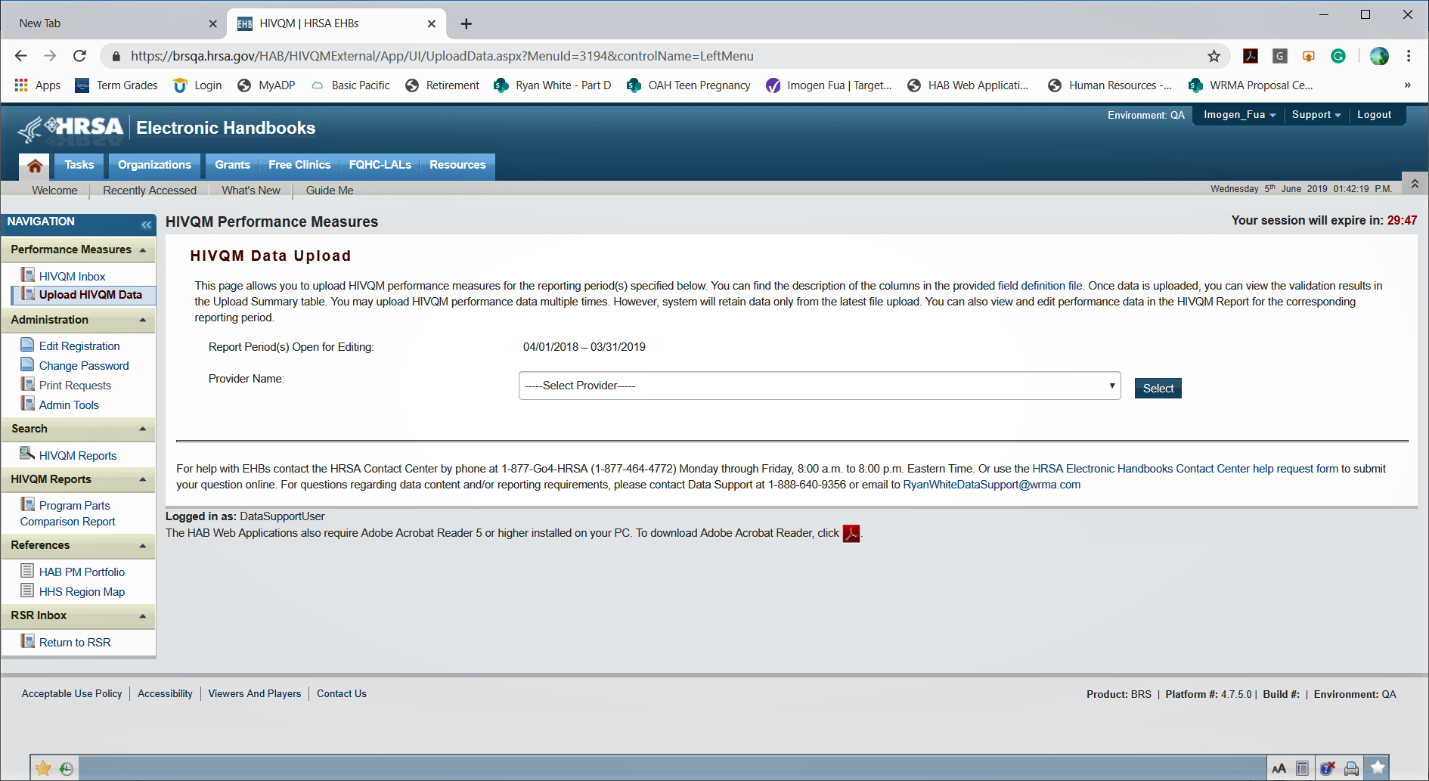
Figure 4a HIVQM Data Upload Page and Provider Selection
Some alerts are also errors that you must correct before successfully uploading your file (or passing the validation process?). To view your list of validations, click on the link, “Validation Result” in the Upload Summary table and an Excel document will appear that can also be downloaded to your computer.
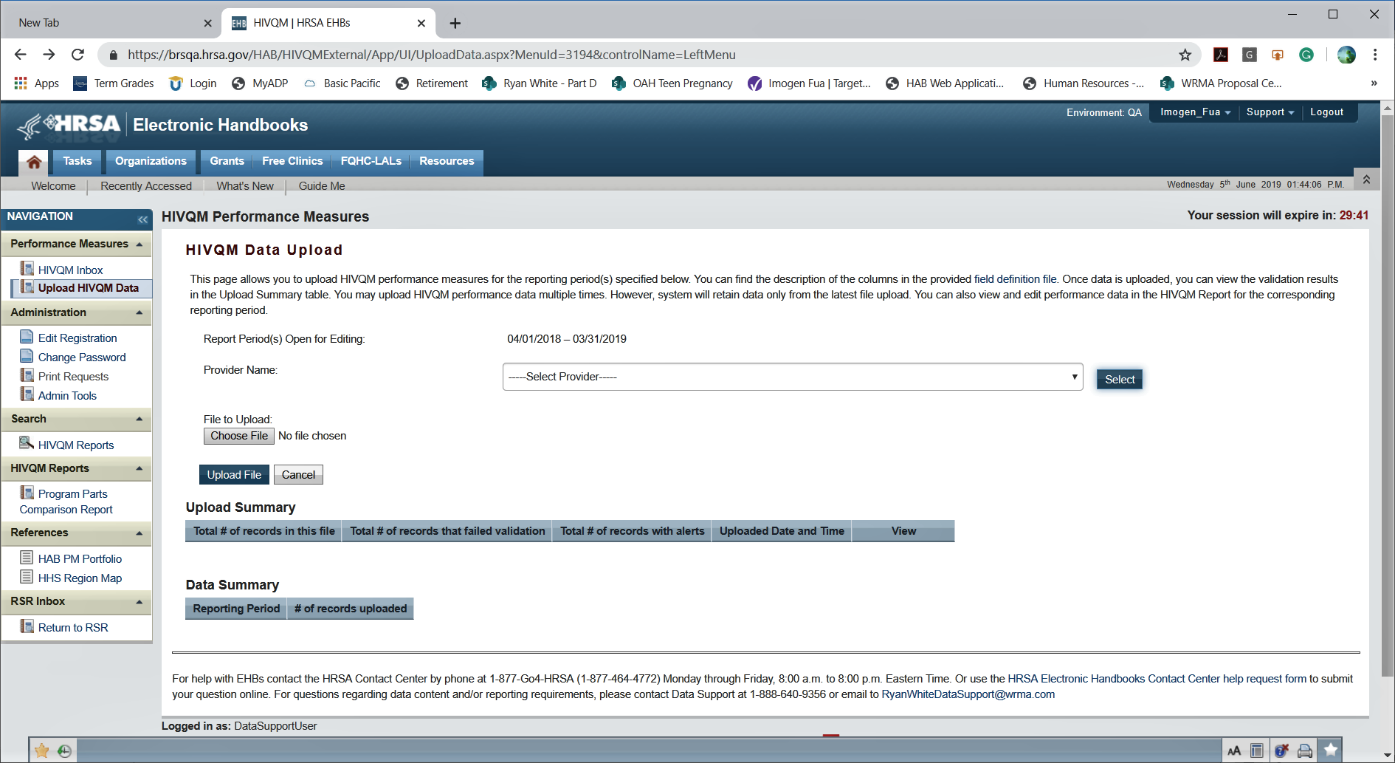
Figure 4b Uploading Your File
T![]() he
Data Summary table located below the Upload Summary table contains
information on the reporting period and the number of records
uploaded. This information can especially be helpful if you have
multiple file uploads.
he
Data Summary table located below the Upload Summary table contains
information on the reporting period and the number of records
uploaded. This information can especially be helpful if you have
multiple file uploads.
After you have checked the alerts and fixed the errors in your file, you can begin the upload process again by clicking on the “Choose File” button to search for the CSV file on your computer and then clicking the “Upload File” button. When your file has passed the validation process, you will see at the top of the page, “The file is processed successfully.”
![]() You
will still see the alerts that asks you to check your data even
though you have successfully uploaded your file (or passed the
validation process?) and are ready to generate reports.
You
will still see the alerts that asks you to check your data even
though you have successfully uploaded your file (or passed the
validation process?) and are ready to generate reports.
Manually Entering Performance Measures Data
Recipients and subrecipients can also manually enter data into the HIVQM Module. First you must select the performance measures that you want to enter. To select performance measures, click the “Select Measures” link under the “HIVQM Report Navigation” heading in Navigation pane on the left side of the screen. See Figure 5 for a screenshot on selecting performance measures.
Figure 5. HIVQM: Performance Measure Selection Page
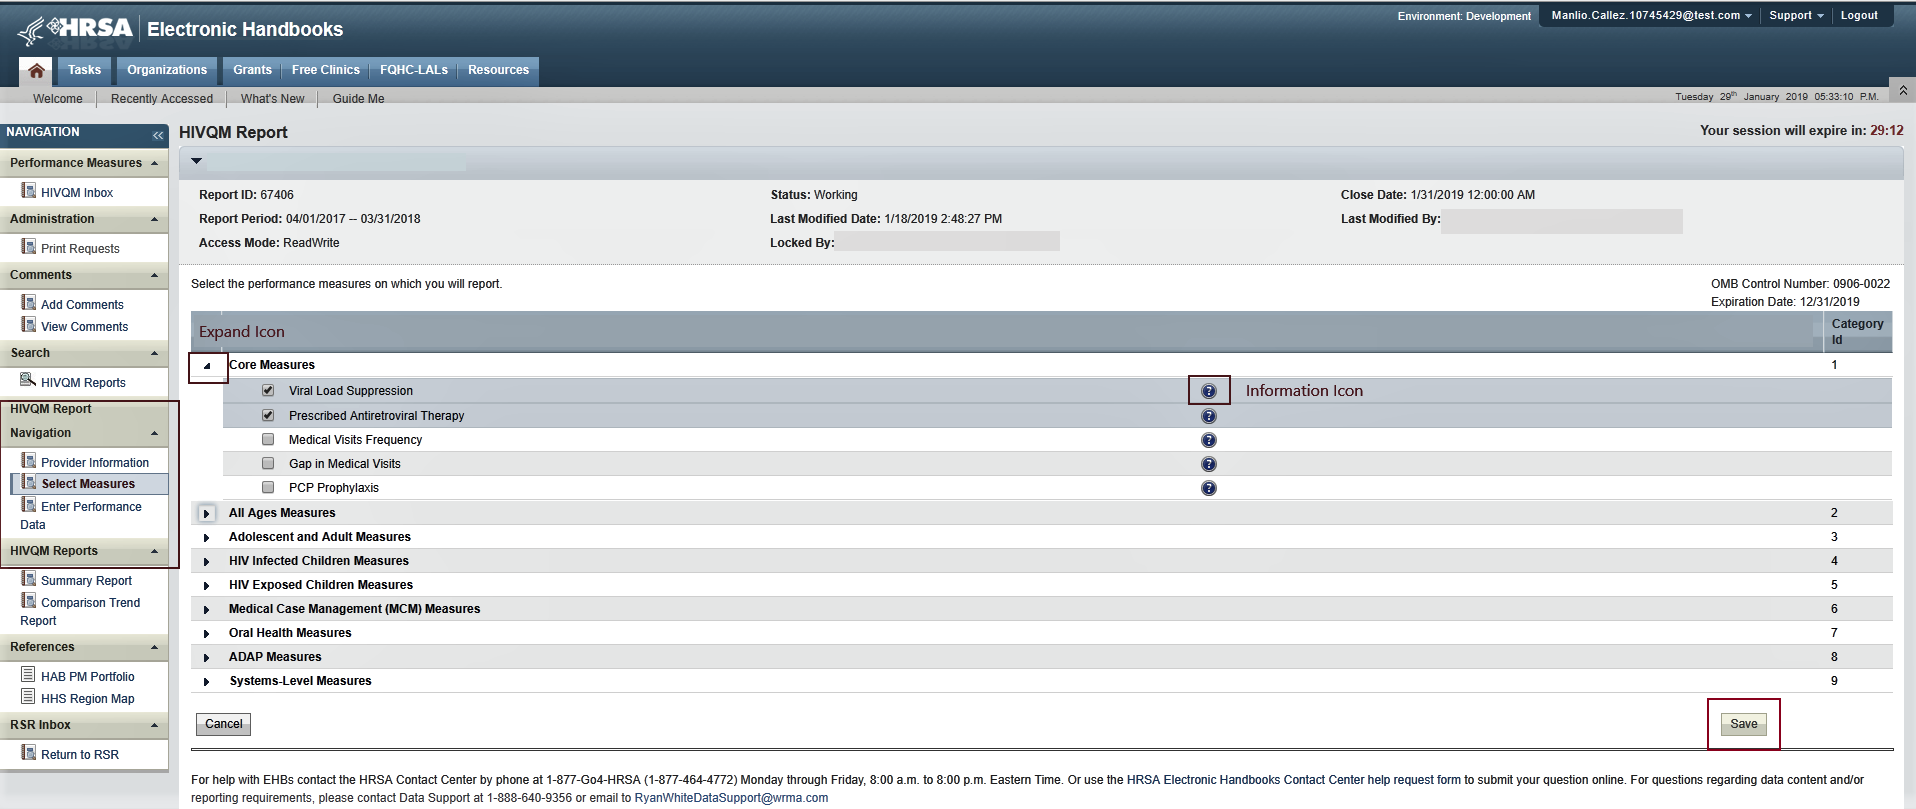
To see the performance measures under each main category, click the expand icon on the left to expand your selections. Then click the checkbox for the performance measures you will be entering data for. If you want more information about the performance measure, click the information icon to the right, and a pop-up window will display additional information. Once you have selected all the performance measures your agency wants to submit data on, click “Save” in the lower right corner of the screen.
After saving your performance measures, you are ready to enter your data. On the left side of the screen, under the Navigation pane, click the “Enter Performance Data” link, and the screen will refresh to the Data Entry page containing a table of all the performance measures that you selected. See Figure 6 for a screenshot on entering performance measures.
Figure 6. HIVQM: Performance Measure Data Entry Page
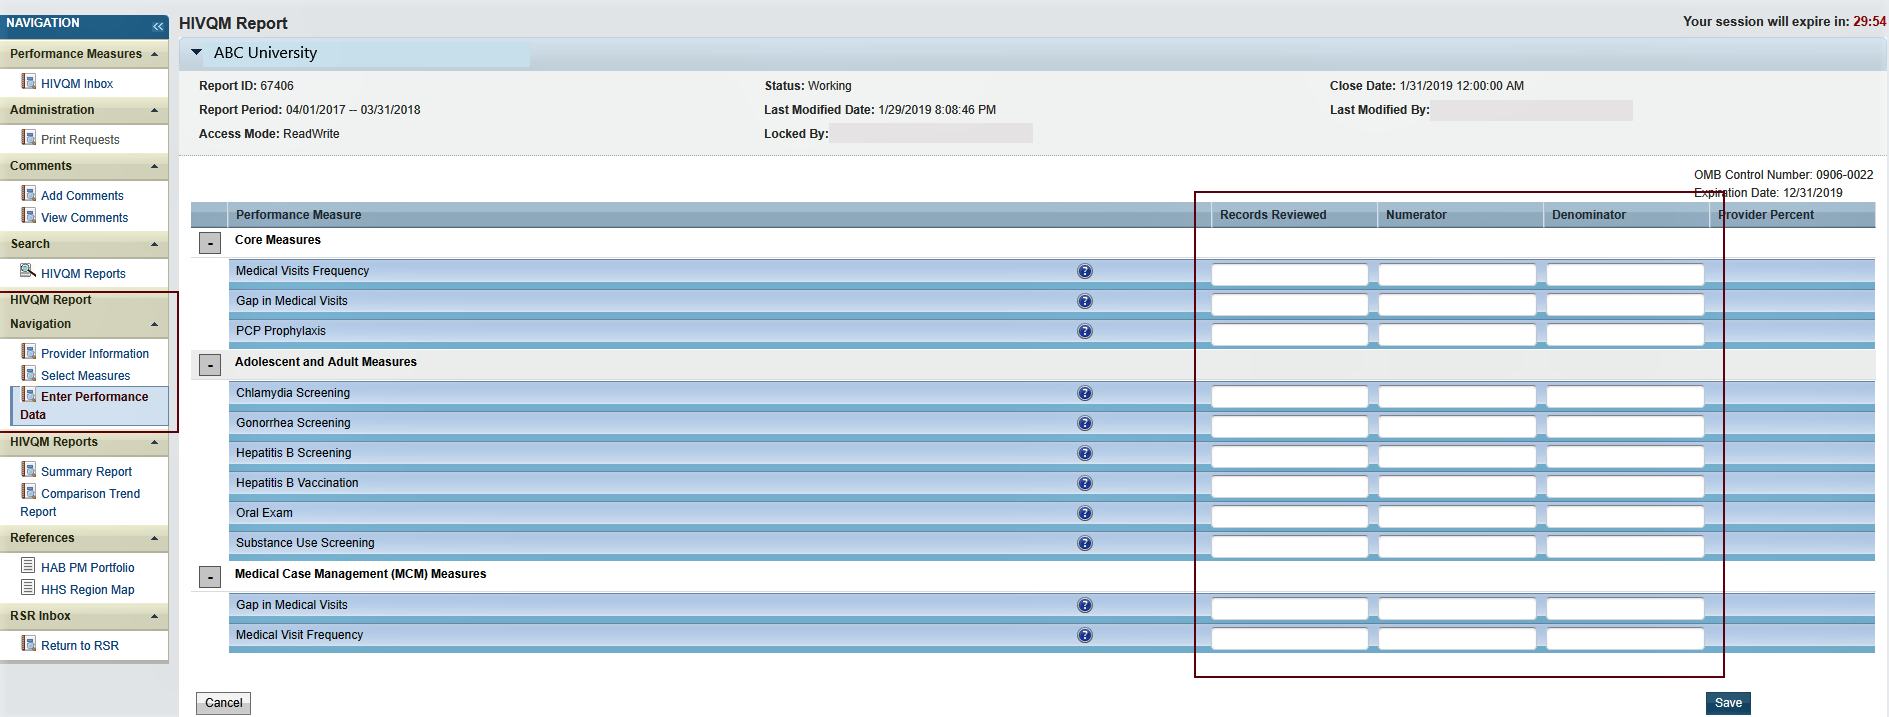
Complete the table by entering your data in the three columns to the right for Records Reviewed, Numerator, and Denominator.
Records reviewed is the number of records that were assessed for the performance measure under review.
Denominator includes clients who should receive the care or service under review.
Numerator includes those clients who should and did receive the care or service under review.
For more program-related guidance on these numbers, click the information icon to the right of the Performance Measure, and a pop-up window will display additional information.
Try these tips to avoid receiving error messages when entering your data.
For Records Reviewed, you must enter a number less than or equal to your caseload number entered in the Provider Information page.
The Records Reviewed number must be greater than or equal to the Denominator.
The Numerator must be less than or equal to the Denominator.
If your Numerator is less than 20 percent of the Denominator, you will receive an alert to make sure this number is correct. Correct the Numerator or ignore the alert if the Numerator is correct.
Once you have entered all your data, save your data by clicking “Save” on the lower right corner of the screen. If you have entered invalid data (valid data is described above) in any of the columns, you will receive an error message. Go back to your data entries and correct the errors. You will not be able to save your data until you have addressed all error messages.
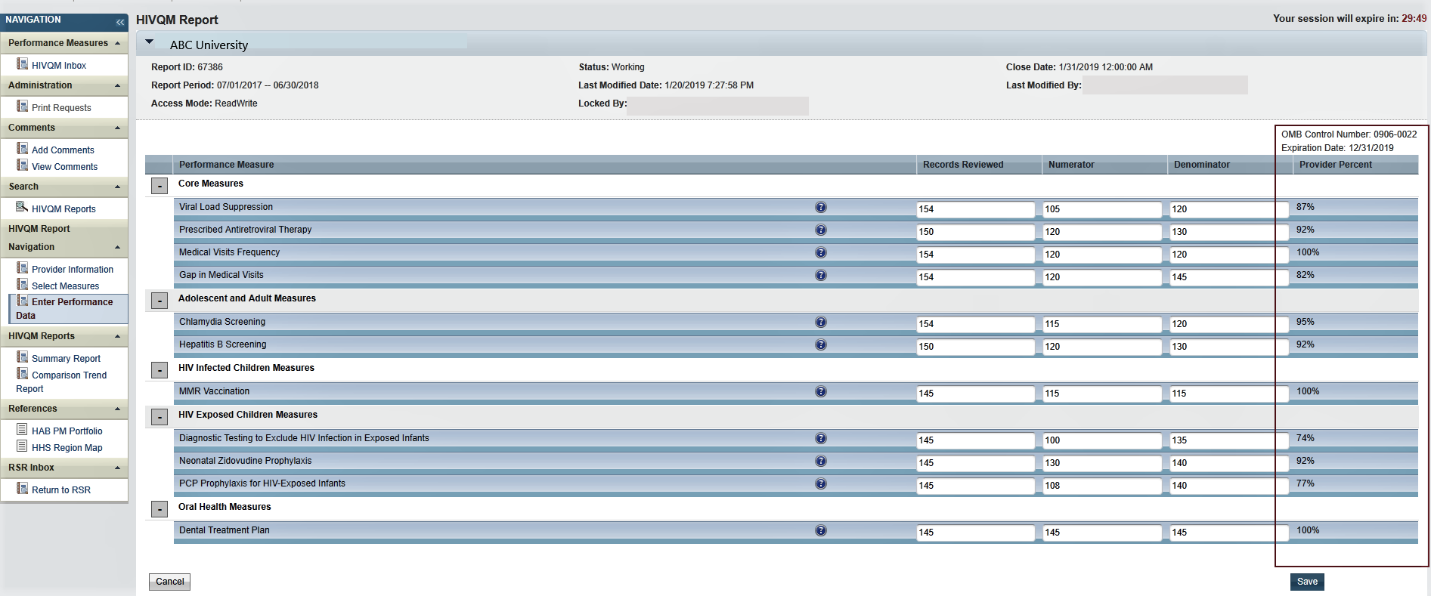
After your data is accurate and saved, the page will refresh with the calculated “Provider Percent” populated on the last column. This is also your organization’s summary report. See Figure 7 for an example of the Organization Summary Report.
Figure 7. HIVQM: Organization Summary Report
Step Five: Generate HIVQM Reports
The HIVQM Module can generate three types of reports: a summary report, a comparison trend report and a program parts comparison report. These reports allow recipients to compare their performance measures data with that of others:
The Summary Report, which was available last year, will now also include state-level data in addition to regional and national data.
The Comparison Trend Report is a new report that will allow recipients to compare their performance data at the organizational, state, regional, and national level over a 5-year period.
Program Parts Comparison Report is another report that will allow recipients to compare performance measures data by Ryan White Part.
To view a report, click the “Summary Report”, “Comparison Trend Report” or “Program Parts Comparison Report” link under HIVQM Reports in the Navigation panel on the left side of the screen.
Summary report NEW!
Once you click “Summary Report,” select the performance measure(s) that you want to view from the pull-down menu at the top of the page. You can select all performance measures, a main category, or individual performance measures. See Figure 8 for a screenshot on selecting performance measures.
Figure
8. HIVQM: Selecting Performance Measure for Reports
(Same for
Summary and Comparison Trend Reports)

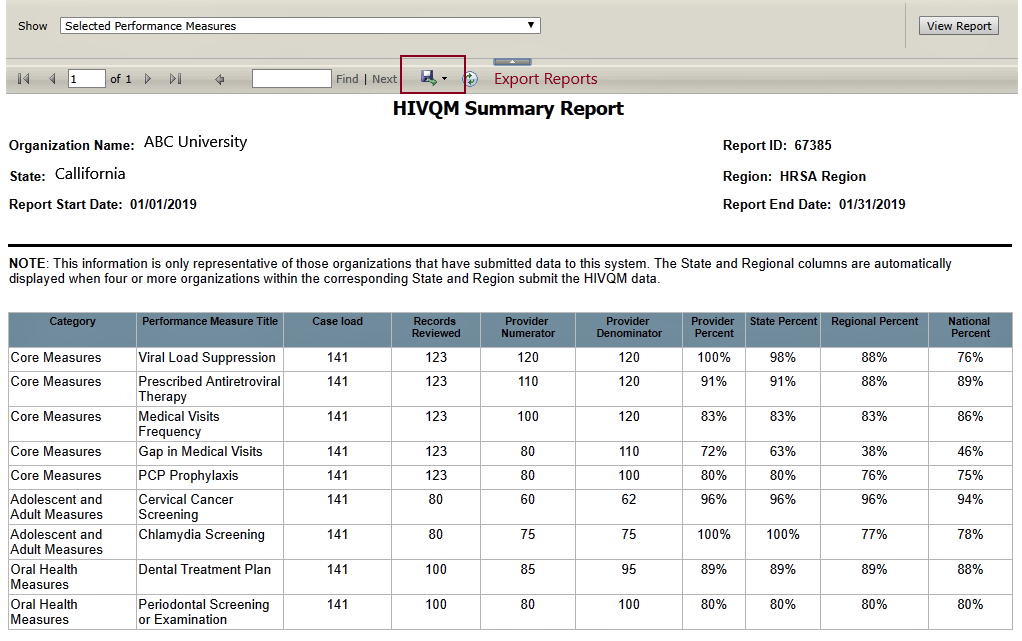
Once you select the performance measure(s), click “View Report” on the right and the report will be generated in a different tab. You can export your summary report via multiple formats (including PDF, Microsoft Excel, and CSV format) by clicking the floppy disk icon for a pull-down menu of options. This summary report reflects data that were submitted during the reporting period. Note that the state and regional columns will be hidden if fewer than four organizations submit data for that state or region. See Figure 9 for an example of the Summary Report.
Figure 9. HIVQM: Summary Report
![]()
Note that the reports will only represent data of organizations that submitted data into the HIVQM Module.
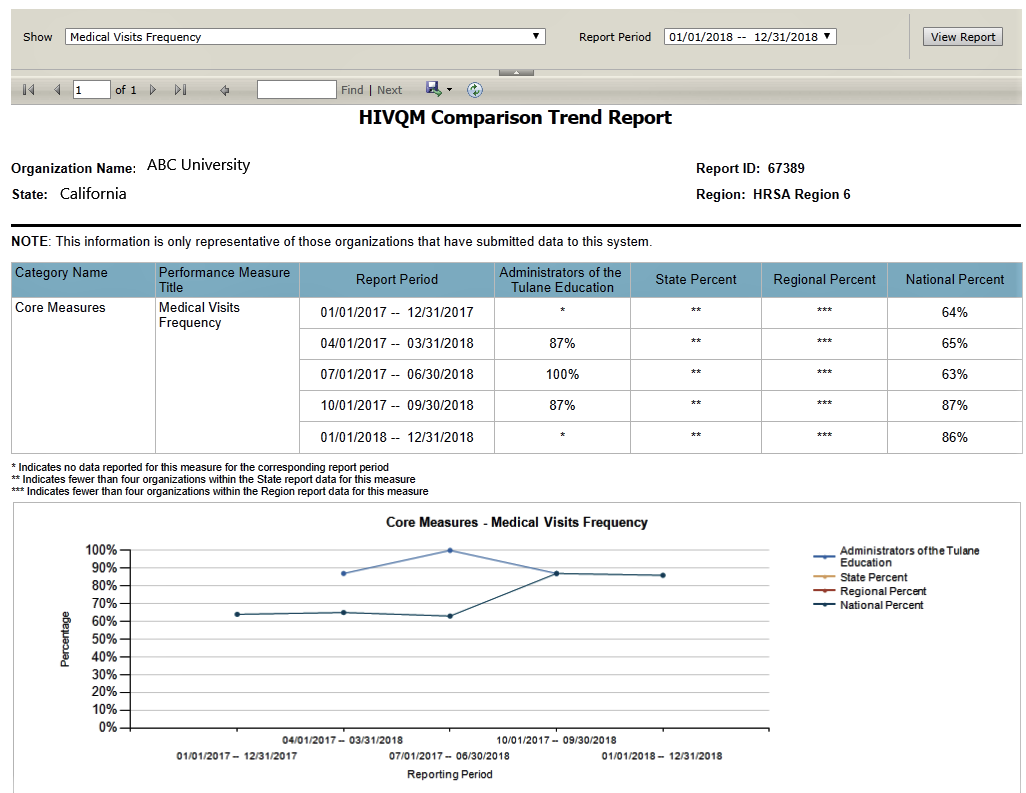
Comparison trend report NEW!
Once you click the “Comparison Trend Report” link, select the performance measure(s) that you want to view from the pull-down menu at the top of the page. In the “Reporting Period” field, select a year-long reporting period from the pull-down menu, starting from January 2016. Click “View Report,” and the report will be generated in a different tab. You can export your Comparison Trend Report via multiple formats (including PDF, Microsoft Excel, and CSV format) by clicking the floppy disk icon for a pull-down menu of options. If fewer than four organizations report data under a performance measure, asterisks will be displayed in the corresponding cell of the data table. See Figure 10 for an example of the Comparison Trend Report.
Figure 10. HIVQM: Comparison Trend Report
Program Parts Comparison Report NEW!
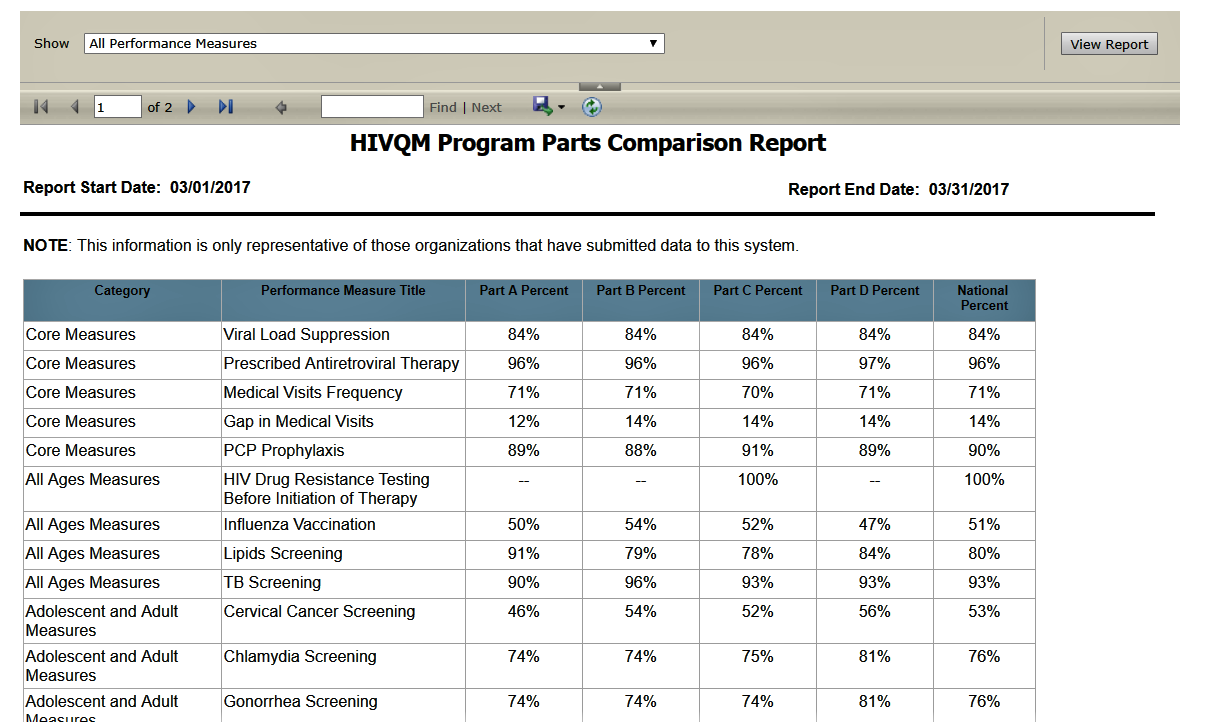
Once you click the “Program Parts Comparison Report” link, select the performance measure(s) that you want to view from the pull-down menu at the top of the page. You can select all performance measures, a main category, or individual performance measures. See Figure 7. HIVQM: Selecting Performance Measures for Reports. Once you select the performance measure(s), click “View Report” on the right and the report will be generated in a different tab. You can export your summary report via multiple formats (including PDF, Microsoft Excel, and CSV format) by clicking the floppy disk icon for a pull-down menu of options. This summary report reflects data that were submitted during the reporting period. See Figure 11 for an example of the Program Parts Comparison Report.
Figure 11. HIVQM: Program Parts Comparison Report
F |
| File Type | application/vnd.openxmlformats-officedocument.wordprocessingml.document |
| Author | Michael J.E. Grier |
| File Modified | 0000-00-00 |
| File Created | 2021-01-15 |
© 2026 OMB.report | Privacy Policy
 f
you need help navigating the EHBs to find your annual RSR,
contact Data Support at 1-888-640-9356 or e-mail