413.17 Benchmark Data Collection
Programs for Improving Energy Efficiency in Residential Buildings
413 17 Benchmark Data Collection Revised (092016).xlsx
Programs for Improving Energy Efficiency in Residential Buildings
OMB: 1910-5184
⚠️ Notice: This form may be outdated. More recent filings and information on OMB 1910-5184 can be found here:
Document [xlsx]
Download: xlsx | pdf
Gross Metrics Input
Normalized Metrics Input


Overview
InstructionsGross Metrics Input
Normalized Metrics Input
Sheet 1: Instructions

|

|
||||||||||||||||||

|

|
||||||||||||||||||


Sheet 2: Gross Metrics Input
| DOE HQ F 413.17 Revised (09/2016) |
OMB Control #: 1910-New Exp. Date: XX/XX/XXXX |
|||||||||||||||
| Better Building Residential Network **Optional** Benchmarking Data Collection Form (DRAFT) | ||||||||||||||||
| Please provide input in the cells that are in yellow | ||||||||||||||||
| Calendar Year | ||||||||||||||||
| Program Name | ||||||||||||||||
| Program Contact | ||||||||||||||||
| Program Category | ||||||||||||||||
| Program Age | ||||||||||||||||
| Predominate Climate Zone | ||||||||||||||||
| Average Electricity Rate ($/kWh) | ||||||||||||||||
| Average Natural Gas Rate($/therm) | ||||||||||||||||
| Funding Source | ||||||||||||||||
| Additional background information like regulatory requirements set by state legislation or public utility commission, program size , or market characteristics. | ||||||||||||||||
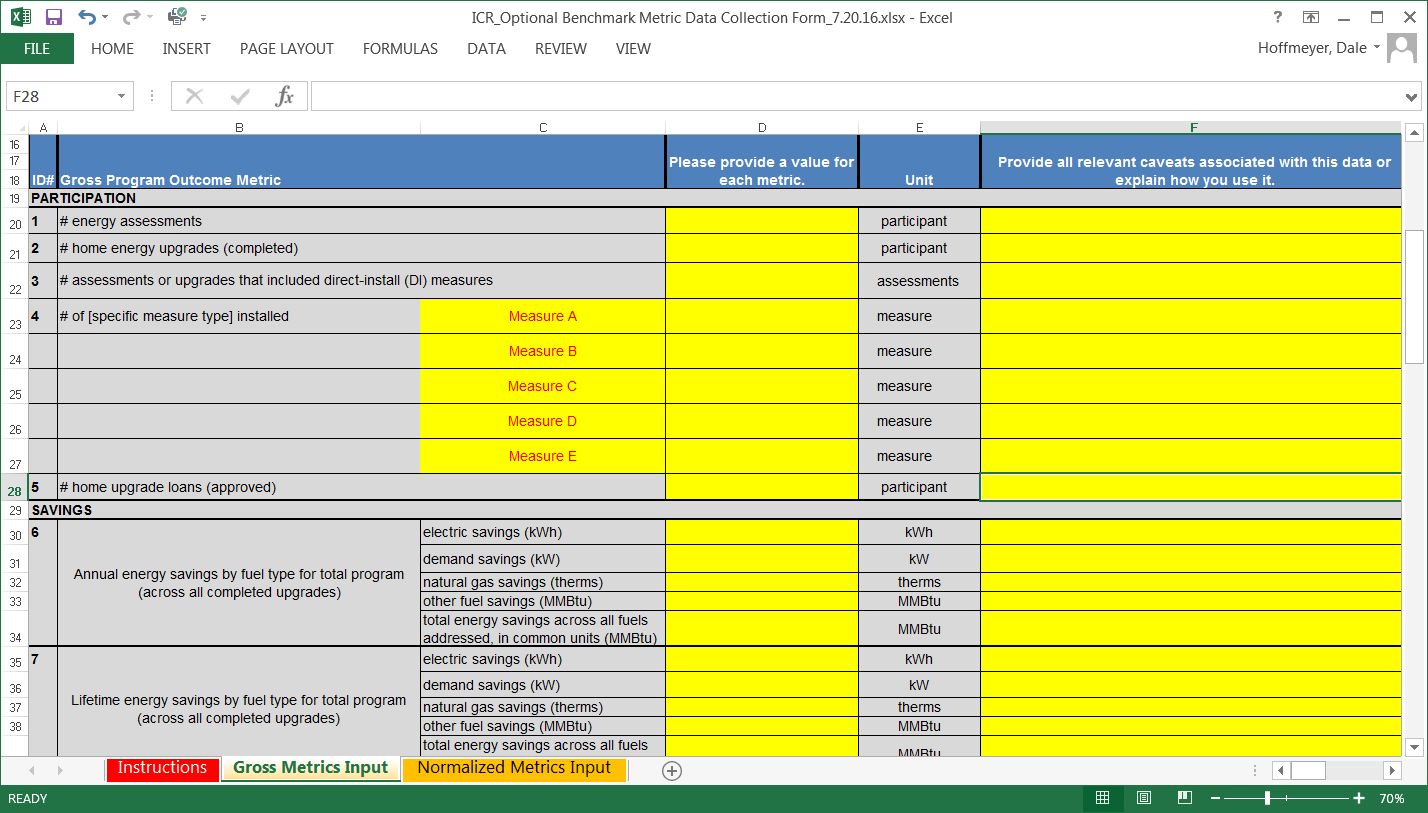
| ID# | Gross Program Outcome Metric | Please provide a value for each metric. | Unit | Provide all relevant caveats associated with this data or explain how you use it. | Please complete the following tables if you would like to benchmark your results against a distribution instead of a single-point average. | |||||||||||
| PARTICIPATION | ||||||||||||||||
| 1 | # energy assessments | participant | Distribution of Home Upgrade Estimated Energy Savings | |||||||||||||
| 2 | # home energy upgrades (completed) | participant | # of Homes | Electric Energy Saving | # of Homes | Natural Gas Energy Savings (therms) | # of Homes | Fuel Oil | # of Homes | Propane Energy Savings (gallons) | # of Homes | Total Energy Savings (MMBTU) | ||||
| 3 | # assessments or upgrades that included direct-install (DI) measures | assessments | (kWh) | Energy Savings (gallons) | ||||||||||||
| 4 | # of [specific measure type] installed | Measure A | measure | <0 kWh | <0 therms | <0 gallons | <0 gallons | <0 MMBTU | ||||||||
| Measure B | measure | 1 - 500 | 1 - 100 | 1 - 100 | 1 - 100 | 0.01 - 2.5 | ||||||||||
| Measure C | measure | 501 - 1000 | 51 - 100 | 51 - 100 | 51 - 100 | 2.51 - 5.0 | ||||||||||
| Measure D | measure | 1001 - 1500 | 101 - 150 | 101 - 150 | 101 - 150 | 5.01 - 7.5 | ||||||||||
| Measure E | measure | 1501 - 2000 | 151 - 200 | 151 - 200 | 151 - 200 | 7.51 - 10.0 | ||||||||||
| 5 | # home upgrade loans (approved) | participant | 2001 - 2500 | 201 - 250 | 201 - 250 | 201 - 250 | 10.01 - 12.5 | |||||||||
| SAVINGS | 2501 - 3000 | 251 - 300 | 251 - 300 | 251 - 300 | 12.51 - 17.5 | |||||||||||
| 6 | Annual energy savings by fuel type for total program (across all completed upgrades) | electric savings (kWh) | kWh | 3001 - 3500 | 301 - 350 | 301 - 350 | 301 - 350 | 17.51 - 20.0 | ||||||||
| demand savings (kW) | kW | 3501 - 4000 | 351 - 400 | 351 - 400 | 351 - 400 | 20.01 - 22.5 | ||||||||||
| natural gas savings (therms) | therms | 4001 - 4500 | 401 - 450 | 401 - 450 | 401 - 450 | 22.51 - 25.0 | ||||||||||
| other fuel savings (MMBtu) | MMBtu | 4501 - 5000 | 451 - 500 | 451 - 500 | 451 - 500 | 25.01 - 27.5 | ||||||||||
| total energy savings across all fuels addressed, in common units (MMBtu) | MMBtu | 5001 - 5500 | 501 - 550 | 501 - 550 | 501 - 550 | 27.51 - 30.0 | ||||||||||
| 7 | Lifetime energy savings by fuel type for total program (across all completed upgrades) | electric savings (kWh) | kWh | 5501 - 6000 | 551 - 600 | 551 - 600 | 551 - 600 | 30.01 - 32.5 | ||||||||
| demand savings (kW) | kW | 6001 - 6500 | 601 - 650 | 601 - 650 | 601 - 650 | 32.51 - 35.0 | ||||||||||
| natural gas savings (therms) | therms | 6501 - 7000 | 651 - 700 | 651 - 700 | 651 - 700 | 35.01 - 37.5 | ||||||||||
| other fuel savings (MMBtu) | MMBtu | 7001 - 7500 | 701 - 750 | 701 - 750 | 701 - 750 | 37.51 - 40.0 | ||||||||||
| total energy savings across all fuels addressed, in common units (MMBtu) | MMBtu | 7501 - 8000 | 751 - 800 | 751 - 800 | 751 - 800 | 40.01 - 42.5 | ||||||||||
| 8 | Annual CO2 or GHG reductions for total program (across all completed upgrades) | [please specify] | 8001 - 8500 | 801 - 850 | 801 - 850 | 801 - 850 | 42.51 - 45.0 | |||||||||
| 9 | Customer $$ savings for total program (across all completed upgrades) | dollars ($) | 8501 - 9000 | 851 - 900 | 851 - 900 | 851 - 900 | 45.01 - 47.5 | |||||||||
| Water Savings | gallons | 9001 - 9500 | 901 - 950 | 901 - 950 | 901 - 950 | 47.51 - 50.0 | ||||||||||
| Water Cost Savings ($) | dollars ($) | 9501 - 10,000 | 951 - 1000 | 951 - 1000 | 951 - 1000 | 50.01 - 52.5 | ||||||||||
| SPENDING | >10,000 kWh | >1000 therms | >1000 gallons | >1000 gallons | >52.5 MMTBU | |||||||||||
| 10 | Total program spending | dollars ($) | ||||||||||||||
| for electric savings | dollars ($) | |||||||||||||||
| for electric demand savings | dollars ($) | Distribution of Home Upgrade Costs or Loan Amount | ||||||||||||||
| for natural gas savings | dollars ($) | # of Homes | Upgrade Invoice Cost | # of Homes | Loan Amount | |||||||||||
| for other fuel savings | dollars ($) | $1 - $1000 | $1 - $1000 | |||||||||||||
| 11 | Total program incentives to customers for assessments | dollars ($) | $1001 - $2000 | $1001 - $2000 | ||||||||||||
| 12 | Total program incentives to customers for upgrades | dollars ($) | $2001 - $3000 | $2001 - $3000 | ||||||||||||
| for electric savings | dollars ($) | $3001 - $4000 | $3001 - $4000 | |||||||||||||
| for electric demand savings | dollars ($) | $4001 - $5000 | $4001 - $5000 | |||||||||||||
| for natural gas savings | dollars ($) | $5001 - $6000 | $5001 - $6000 | |||||||||||||
| for other fuel savings | dollars ($) | $6001 - $7000 | $6001 - $7000 | |||||||||||||
| 13 | Total program incentives to contractors for assessments | dollars ($) | $7001 - $8000 | $7001 - $8000 | ||||||||||||
| 14 | Total program incentives to contractors for upgrades | dollars ($) | $8001 - $9000 | $8001 - $9000 | ||||||||||||
| 15 | Total program cost for direct-install measures | dollars ($) | $9001 - $10,000 | $9001 - $10,000 | ||||||||||||
| 16 | Marketing (or lead generation) spending | dollars ($) | $10,001 - $11,000 | $10,001 - $11,000 | ||||||||||||
| 17 | Total amount loaned for upgrades | dollars ($) | $11,001 - $12,000 | $11,001 - $12,000 | ||||||||||||
| 18 | Total invoiced costs for upgrades | dollars ($) | $12,001 - $13,000 | $12,001 - $13,000 | ||||||||||||
| 19 | Total customer contribution for upgrades | dollars ($) | $13,001 - $14,000 | $13,001 - $14,000 | ||||||||||||
| OTHER | $14,001 - $15,000 | $14,001 - $15,000 | ||||||||||||||
| 20 | Total # certified individuals within active contractor companies | individual | $15,001 - $16,000 | $15,001 - $16,000 | ||||||||||||
| 21 | Customer satisfaction - # complaints; feedback metrics from surveys | [please specify] | $16,001 - $17,000 | $16,001 - $17,000 | ||||||||||||
| 22 | Time from assessment-to-upgrade completion (days) for each home energy upgrade | day | $17,001 - $18,000 | $17,001 - $18,000 | ||||||||||||
| 23 | # marketing leads | lead | $18,001 - $19,000 | $18,001 - $19,000 | ||||||||||||
| 24 | # active participating contractors | contractor | $19,001 - $20,000 | $19,001 - $20,000 | ||||||||||||
| 25 | # eligible homes | Select from Drop-down | $20,001 - $21,000 | $20,001 - $21,000 | ||||||||||||
| 26 | Total building stock (# buildings in program region) | Select from Drop-down | $21,001 - $22,000 | $21,001 - $22,000 | ||||||||||||
| Additional metric TBD | $22,001 - $23,000 | $22,001 - $23,000 | ||||||||||||||
| Additional metric TBD | $23,001 - $24,000 | $23,001 - $24,000 | ||||||||||||||
| Additional metric TBD | $24,001 - $25,000 | $24,001 - $25,000 | ||||||||||||||
| Additional metric TBD | >$25,0000 | >$25,0000 | ||||||||||||||
| Program Category List | Program Age List | Climate Zone | ||||||||||||||
| BEHAVIORAL/ONLINE AUDIT/FEEDBACK | ONE YEAR OR LESS | HOT-HUMID | ||||||||||||||
| CONSUMER PRODUCT REBATE/APPLIANCES | TWO YEARS | MIXED-HUMID | ||||||||||||||
| CONSUMER PRODUCT REBATE/ELECTRONICS | THREE YEARS | HOT-DRY | ||||||||||||||
| CONSUMER PRODUCT REBATE/LIGHTING | FOUR YEARS | MIXED-DRY | ||||||||||||||
| APPLIANCE RECYCLING | FIVE YEARS | COLD | ||||||||||||||
| MULTI-FAMILY | SIX YEARS | VERY-COLD | ||||||||||||||
| NEW CONSTRUCTION | SEVEN YEARS | SUBARCTIC | ||||||||||||||
| HVAC | EIGHT YEARS | MARINE | ||||||||||||||
| INSULATION | NINE YEARS | |||||||||||||||
| POOL PUMP | TEN OR MORE YEARS | |||||||||||||||
| PRESCRIPTIVE | ||||||||||||||||
| WATER HEATER | ||||||||||||||||
| WINDOWS | ||||||||||||||||
| WHOLE HOME/DIRECT INSTALL | ||||||||||||||||
| WHOLE HOME/AUDITS | ||||||||||||||||
| WHOLE HOME/RETROFITS | ||||||||||||||||
| FINANCING | ||||||||||||||||
| OTHER | ||||||||||||||||
| Public reporting burden for this collection of information is estimated to average 390 minutes (6.5 hours) per response, including the time for reviewing instructions, searching existing data sources, gathering and maintaining the data needed, and completing and reviewing the collection of information. Send comments regarding this burden estimate or any other aspect of this collection of information, including suggestions for reducing this burden, to Office of the Chief Information Officer, Records Management Division, IM-23, Paperwork Reduction Project (1910-XXXX), U.S. Department of Energy, 1000 Independence Ave SW, Washington, DC, 20585-1290; and to the Office of Management and Budget (OMB), OIRA, Paperwork Reduction Project (1910-XXXX), Washington, DC 20503. | ||||||||||||||||
Sheet 3: Normalized Metrics Input
| Please provide input in the cells that are in yellow. | |||||
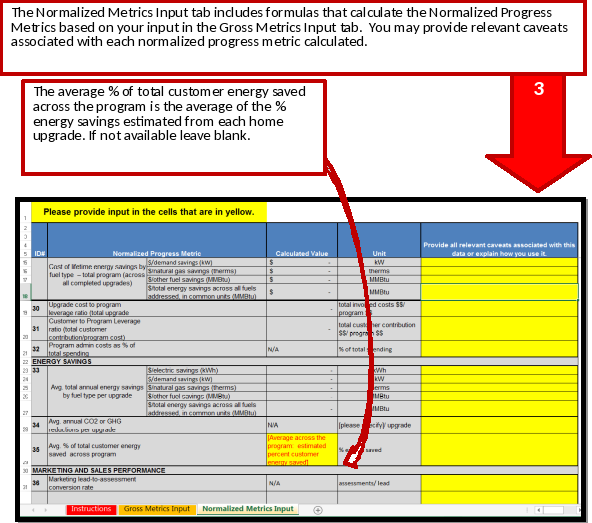
| ID# | Normalized Progress Metric | Calculated Value | Unit | Provide all relevant caveats associated with this data or explain how you use it. | |
| PROGRAM EFFICIENCY | |||||
| 27 | % of eligible homes improved | N/A | % of eligible homes improved | ||
| % of building stock improved | N/A | % of building stock improved | |||
| 28 | Cost of annual energy savings by fuel type – total program (across all completed upgrades) | $/electric savings (kWh) | $- | kWh | |
| $/demand savings (kW) | $- | kW | |||
| $/natural gas savings (therms) | $- | therms | |||
| $/other fuel savings (MMBtu) | $- | MMBtu | |||
| $/total energy savings across all fuels addressed, in common units (MMBtu) | $- | MMBtu | |||
| 29 | Cost of lifetime energy savings by fuel type – total program (across all completed upgrades) | $/electric savings (kWh) | $- | kWh | |
| $/demand savings (kW) | $- | kW | |||
| $/natural gas savings (therms) | $- | therms | |||
| $/other fuel savings (MMBtu) | $- | MMBtu | |||
| $/total energy savings across all fuels addressed, in common units (MMBtu) | $- | MMBtu | |||
| 30 | Upgrade cost to program leverage ratio (total upgrade invoiced costs/program cost) | - | total invoiced costs $$/ program $$ | ||
| 31 | Customer to Program Leverage ratio (total customer contribution/program cost) | - | total customer contribution $$/ program $$ | ||
| 32 | Program admin costs as % of total spending | N/A | % of total spending | ||
| ENERGY SAVINGS | |||||
| 33 | Avg. total annual energy savings by fuel type per upgrade | $/electric savings (kWh) | - | kWh | |
| $/demand savings (kW) | - | kW | |||
| $/natural gas savings (therms) | - | therms | |||
| $/other fuel savings (MMBtu) | - | MMBtu | |||
| $/total energy savings across all fuels addressed, in common units (MMBtu) | - | MMBtu | |||
| 34 | Avg. annual CO2 or GHG reductions per upgrade | N/A | [please specify]/ upgrade | ||
| 35 | Avg. % of total customer energy saved across program | [Average across the program: estimated percent customer energy saved] | % energy saved | ||
| MARKETING AND SALES PERFORMANCE | |||||
| 36 | Marketing lead-to-assessment conversion rate | N/A | assessments/ lead | ||
| 37 | Energy assessment-to-upgrade conversion rate for the total program | 0% | percentage | ||
| 38 | Avg. # upgrades per contractor (across program) | N/A | upgrade/contractor | ||
| 39 | Average invoiced cost per upgrade | $- | dollar | ||
| 40 | Marketing cost per lead | $- | dollar | ||
| 41 | Average loan amount for home upgrades | $- | dollar | ||
| 42 | Customer contribution as a % of total invoiced cost | 0% | percentage | ||
| 43 | Average time-to-complete (time from assessment to upgrade completion) across the program | N/A | days | ||
| CUSTOMER BENEFIT | |||||
| 44 | Average customer $$ savings per upgrade across program | $- | dollars ($) | ||
| CUSTOMER BENEFIT – INFORMATION ON INDIVIDUAL CONTRACTOR PERFORMANCE | |||||
| 45 | Average Customer $$ savings per upgrade for each contractor | dollars ($) | |||
| 46 | Avg. of time-to-complete by contractor | days | |||
| 47 | Customer satisfaction - for specific contractors | [please specify] | |||
| Additional metric TBD | |||||
| Additional metric TBD | |||||
| Additional metric TBD | |||||
| Additional metric TBD | |||||
| File Type | application/vnd.openxmlformats-officedocument.spreadsheetml.sheet |
| File Modified | 0000-00-00 |
| File Created | 0000-00-00 |
© 2026 OMB.report | Privacy Policy