NHANES History
Att_7_ NHANES History 072718.docx
National Health and Nutrition Examination Survey
NHANES History
OMB: 0920-0950
Attachment 7
NHANES History
NHANES History
The National Health and Nutrition Examination Survey (NHANES) consists of three primary methods of data collection: the NHANES interviews, the NHANES examination (including follow-up exams), and NHANES laboratory assessments.
History of NHANES Content
Much of the content of the proposed NHANES field operations were part of previous NHANES. This includes operational features such as listing and screening, sections of the questionnaires and components of the examination.
The questionnaire items in NHANES came from many sources that ensured adequate testing of the wording of the questions and selection of appropriate response categories. Many questions were taken from the National Health Interview Survey (NHIS) core questionnaires (OMB No. 0920-0214, Exp. Date 12/31/2020). These questions have been tested in the NCHS Questionnaire Design Research Laboratory (QDRL) (OMB No. 0920-0222, Exp. Date 07/31/2018) and then used in the field with thousands of respondents. Additional NHANES questions were derived from standard instruments and tests as well as surveys done by other agencies and organizations. Examples of these are the dietary questions and the mental health module. Still other NHANES questions were taken from previous NHANES surveys.
Examination components have been included in previous NHANES and/or other population based studies. A criterion for inclusion of examination content for the early years of NHANES was the existence of a standardized procedure for use on NHANES. To incorporate new content in future years of the continuous NHANES, evaluation of objective data collection procedures used in other studies and testing of new procedures concurrent to NHANES data collection will be required. This developmental work may be done within the NHANES field operations or as a standalone study not using NHANES participants. All laboratory methods used in NHANES have been tested and deemed reliable and valid prior to their inclusion in NHANES.
History of Incentives and Response Rates in NHANES
To maximize response rates for the examination, NHANES participants have received incentives for their examination participation since the 1970s. Incentives began after a study was conducted to test the effect of giving incentives to sample persons who participated in NHANES I. The response rate for those who were told they would receive an incentive was 82%. The response rate for those who were not told they would receive an incentive was 70%. Results of the study were published as "A Study of the Effect of Remuneration Upon Response in the Health and Nutrition Examination Survey, United States," Vital and Health Statistics, Series 2-No.67. In 1978, during NHANES II another study was conducted, this time on the effect of increasing incentives. It showed that those who were told they would receive $20 after their examination had an examination rate of 79% while those who were told they would receive $10 had an examination rate of 74%.
In NHANES III (1988‑94) differential incentives were successfully used to get participants to come to the examination session (morning, afternoon, or evening session) to which they were randomly assigned. This was important because in prior years participants were asked to fast for certain tests and arrive at specific session times to correspond with this testing. Data were lost due to the failure of the participants to attend the appropriate randomly assigned sessions.
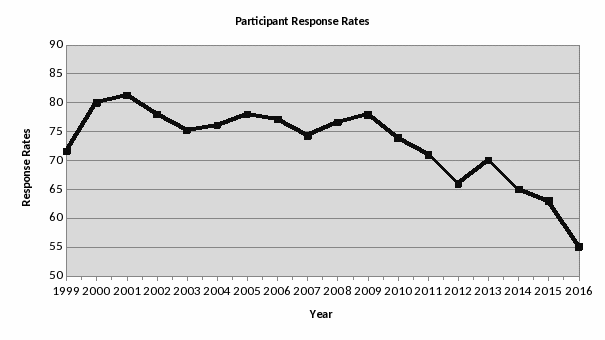
Continuous NHANES began in 1999 and the response rate was 72%, lower than previous response rates for NHANES I, II or III and resulted in an incentive study in 2000. The comparison groups were the current incentive level versus an incentive level approximately 50 percent higher. After 5,900 observations, the overall response rate was the same in both groups. Interviewers were not blinded to the incentives groups, as their primary objective was to get the participants to the examination center. Comments made during the debriefing suggested that interviewers spent more time convincing the lower incentive group to be examined.
The response rates for participants examined for 2015 and 2016 were 63% and 55% respectively. The response rates to the examination from 1999-2016 are presented in the graph
below.

| File Type | application/vnd.openxmlformats-officedocument.wordprocessingml.document |
| File Title | Attachment 5 - Consultation with Outside Organizations and Individuals |
| Author | vlb2 |
| File Modified | 0000-00-00 |
| File Created | 2021-01-14 |
© 2026 OMB.report | Privacy Policy