NWS Hurricane Forecast Survey
Surveys to Collect Data on Use of the NOAA National Weather Service Cone of Uncertainty
NWS Hurricane Forecast Survey_3_12_20
NWS Hurricane Forecast Survey
OMB: 0648-0791


NOAA NATIONAL WEATHER SERVICE HURRICANE FORECAST INFORMATION SURVEY
INTRODUCTION
Does your organization, company, or agency work in the marine, transportation, energy and utilities, or tourism and recreation sectors and use information from NOAA’s National Weather Service (NWS) in its decision-making in advance of a hurricane?1
If yes, please consider taking this survey.
We need feedback from people like you about how you use forecast information from NWS offices such as the National Hurricane Center (NHC) and the Central Pacific Hurricane Center (CPHC) who predict the likely path, intensity, and impacts of hurricanes in the Atlantic Ocean, the Eastern North Pacific Ocean, and the Central Pacific Ocean.
Completing this online survey is voluntary, and your responses are anonymous. Please note that the “save and continue” feature allows you to exit the survey and return to it later. Your responses will be saved for one week.
To begin this survey, click “Next.”
Paperwork Reduction Act Statement: Public reporting burden for this collection of information is estimated at 20 minutes per response, including the time for reviewing instructions, searching existing data sources, gathering and maintaining the data needed, and completing and reviewing the collection of information. Send comments regarding this burden estimate or any other suggestions for reducing this burden to Jen Hilderbrand, NOAA National Weather Service, SSMC 2, Room 17205, 1325 East West Highway, Silver Spring, MD. Notwithstanding any other provisions of the law, no person is required to respond to, nor shall any person be subjected to a penalty for failure to comply with, a collection of information subject to the requirements of the Paperwork Reduction Act, unless that collection of information displays a currently valid OMB Control Number.
ORGANIZATIONAL INFORMATION
Please SELECT ALL of the following sectors that best describe your organization’s primary area of employment:
Tourism and recreation
[Mouseover description: Travel, food and hospitality, sports, hotels and motels, other accommodations, scenic and sightseeing services, etc.]
Energy and utilities
[Mouseover description: Oil and gas production, pipeline and refining, electricity or natural gas facilities, water and wastewater utilities, etc.]
Marine
[Mouseover description: Shipping, water transportation, boat building, support for oil and gas operations, commercial fishing, etc.]
Transportation
[Mouseover description: Air, water, transit, rail, and truck transportation; pipeline transportation; scenic and sightseeing transportation; couriers and messengers; warehousing and storage; etc.]
City, state, or county emergency management
[Exit to disclaimer: “Thank you for your interest in this survey. At this time, NOAA is primarily interested in learning about how the tourism and recreation, energy and utilities, marine, and transportation sectors interact with the Cone of Uncertainty. We look forward to receiving your feedback in future research efforts.”]
Other ______
[Exit to disclaimer]
How would you describe your business/operation more specifically? [open-ended] _____________________
{List of states with selection boxes, as well as “Atlantic Ocean,” “Gulf of Mexico,” “Caribbean Sea,” “Pacific Ocean,” and “Country other than the United States”}
Approximately how many people work for your business or organization?
_____ employees
What is the geographic scope of the stakeholders or customers you serve?
International
National
Regional
Local
HURRICANE EXPERIENCE
Was your organization impacted by one or more hurricanes in 2017–2019?
Yes [Go to Q7]
No [Go to Q8]
If yes, please rate the extent of the damage and/or adverse effects, including monetary impacts, to your organization:
Name (if named) |
Date |
Extent of Damage and/or Adverse Effects |
|||
Extensive – The storm caused significant disruptions of our operations that lasted several days after the storm |
Moderate – There were some disruptions, but we were back to normal operations within a few days at most |
Little if any – The storm caused minor disruptions but we were back to normal quickly. |
None- The storm did not affect our operations at all. |
||
|
August 17-September 1, 2017 |
|
|
|
|
|
August 30-September 12, 2017 |
|
|
|
|
|
September 5-22, 2017 |
|
|
|
|
|
September 16-30, 2017 |
|
|
|
|
|
October 4-8, 2017 |
|
|
|
|
|
May 25-31 2018 |
|
|
|
|
|
September 3-6, 2018 |
|
|
|
|
|
August 31 -September 17, 2018 |
|
|
|
|
|
October 7-11, 2018 |
|
|
|
|
|
July 31-August 16, 2018 |
|
|
|
|
|
August 15-18, 2018 |
|
|
|
|
|
September 1-14, 2018 |
|
|
|
|
|
September 7-17, 2018 |
|
|
|
|
|
February 3-22, 2018 |
|
|
|
|
|
July 11-15, 2019 |
|
|
|
|
|
August 24-September 6, 2019 |
|
|
|
|
|
September 17-21, 2019 |
|
|
|
|
HURRICANE PREPARATION
|
Not at all |
To a small extent |
To a moderate extent |
To a large extent |
Not sure/Don’t know |
National Hurricane Center (NHC) or Central Pacific Hurricane Center (CPHC) |
|
|
|
|
|
Local National Weather Service (NWS) Weather Forecast Office |
|
|
|
|
|
Private meteorological service [Show Q9] |
|
|
|
|
|
Private meteorologist on staff [Show Q9] |
|
|
|
|
|
Tools such as Hurrevac or other tracking applications [Show Q9] |
|
|
|
|
|
Local broadcast meteorologists [Show Q9] |
|
|
|
|
|
National broadcast meteorologists [Show Q9] |
|
|
|
|
|
Other [Show Q9] |
|
|
|
|
|
You indicated that your organization relies on forecast information from sources other than the NHC, the CPHC, or other NWS offices. Please describe them here: [open-ended] ____________________
What forecast parameters do you consider in setting criteria for use in your decision-making before/during a hurricane? (Select ALL that apply)
Storm track
Storm intensity
Storm size
Sustained wind speed at a specific location
Wind gusts at a specific location
Time of onset of sustained tropical-storm-force winds
Duration of sustained tropical-storm-force winds
Storm surge heights
Time of onset of storm surge flooding
Duration of storm surge flooding
Offshore wave heights
Offshore wave period
Rainfall amounts
Rainfall intensity
Time of onset of rainfall
Rainfall duration
River stage
Other ___________________________
To what extent does your organization use the following hurricane products issued by National Weather Service offices when making preparation decisions?
National Hurricane Center/Central Pacific Hurricane Center Products |
|||||
|
Not at all |
To a small extent |
To a moderate extent |
To a large extent |
Not familiar with this product |
Tropical Cyclone Track and Error Cone Graphic (Cone Graphic) |
|
|
|
|
|
Wind Speed Probability Products (graphical or text) |
|
|
|
|
|
Time of Arrival of Tropical-Storm-Force-Winds Graphics |
|
|
|
|
|
Public Advisory Text Product (TCP) |
|
|
|
|
|
Forecast/Advisory Text Product (TCM) |
|
|
|
|
|
Tropical Cyclone Discussion Text Product (TCD) |
|
|
|
|
|
2-Day and 5-Day Tropical Weather Outlooks (graphical or text) |
|
|
|
|
|
Tropical Cyclone Danger Graphic |
|
|
|
|
|
Key Messages Graphic |
|
|
|
|
|
Weather Forecast Office (WFO) Products |
|||||
|
Not at all |
To a small extent |
To a moderate extent |
To a large extent |
Not familiar with this product |
Tropical Cyclone Local Watch/Warning VTEC text product (TCV) |
|
|
|
|
|
Hurricane Local Statement Text Product (HLS) |
|
|
|
|
|
Hurricane Threats and Impacts Graphics |
|
|
|
|
|
Wind (hurricane, typhoon, or tropical storm) Watch and Warning Graphics |
|
|
|
|
|
Storm Surge Watch and Warning Graphic |
|
|
|
|
|
FORECAST TRACK CONE
Now we’d like to ask you some questions about the Forecast Track Cone (Cone Graphic) issued by divisions of the U.S. National Weather Service.
[If
participant selected Atlantic Ocean, Gulf of Mexico, Caribbean Sea,
and Country other than the United States in Q3, show this graphic]
[If participant selected Pacific Ocean in Q3, show this graphic]

[Note: One of the graphics on p. 7 will appear on screen for the respondent as the following questions, 12–18, are asked.]
How familiar are you with the Cone Graphic, as shown in the example on the screen?
Not at all familiar
Slightly familiar
Moderately familiar
Very familiar
Extremely familiar
Where have you seen this Cone Graphic (or some version of it) used in forecasts? Check all that apply.
hurricanes.gov (the NHC and CPHC website)
Local/national news
Cable TV news
Cable weather channels
Private vendor websites
Tools or applications such as Hurrevac
Social media
Other (specify): _______
Please indicate the extent to which you agree or disagree with the following statements about the Cone Graphic: [random order?]
|
Strongly disagree |
Disagree |
Neither agree nor disagree |
Agree |
Strongly agree |
Not sure/ Don’t know |
It provides all the information needed for preparation decisions |
|
|
|
|
|
|
It shows where the storm is likely to go |
|
|
|
|
|
|
It covers the area of all possible tracks for a storm |
|
|
|
|
|
|
It is easy to understand the different symbols and labels on the map |
|
|
|
|
|
|
It is hard to understand the legend |
|
|
|
|
|
|
It is useful in deciding when and whether to prepare |
|
|
|
|
|
|
I do not get all the information I need from this graphic |
|
|
|
|
|
|
It provides too much information |
|
|
|
|
|
|
To what extent do you agree/disagree with the following statements about the Cone Graphic’s features?
|
Strongly disagree |
Disagree |
Neither agree nor disagree |
Agree |
Strongly agree |
Not sure/ Don’t know |
The Cone Graphic depicts storm surge |
|
|
|
|
|
|
The Cone Graphic indicates whether a storm is a tropical storm or hurricane |
|
|
|
|
|
|
The Cone Graphic depicts areas that could experience strong winds |
|
|
|
|
|
|
The Cone Graphic indicates when strong winds are likely to arrive |
|
|
|
|
|
|
The cone size depends on the degree of uncertainty in the track forecast for a storm |
|
|
|
|
|
|
The cone size depends on the level of accuracy in previous track forecasts |
|
|
|
|
|
|
How effective are these elements of the Cone Graphic in communicating information?
|
Very effective |
Somewhat effective |
Not effective |
No opinion |
Labels |
|
|
|
|
Colors |
|
|
|
|
Cone |
|
|
|
|
Center track line |
|
|
|
|
Disclaimer |
|
|
|
|
Forecast position symbols |
|
|
|
|
Do you have any suggestions for improving the Cone Graphic? _____________________
How important would you say the Cone Graphic is to your organization’s activities, operations, or decision-making on when to begin preparing for a hurricane?
Extremely important
Very important
Somewhat important
A little important
Not at all important [Skip to question 23]
Not sure/Don’t know [Skip to question 23]
Now we’d like to ask you a few questions related to the following example of the Cone Graphic. Please answer these questions as if your organization was located within the points indicated by the three stars (A, B, C). Assume that it is Tuesday evening at 6 pm.
[If participant selected Atlantic Ocean, Gulf of Mexico, Caribbean Sea, and Country other than the United States in Q3, show graphic on this page; if selected Pacific, show graphic on page 11]


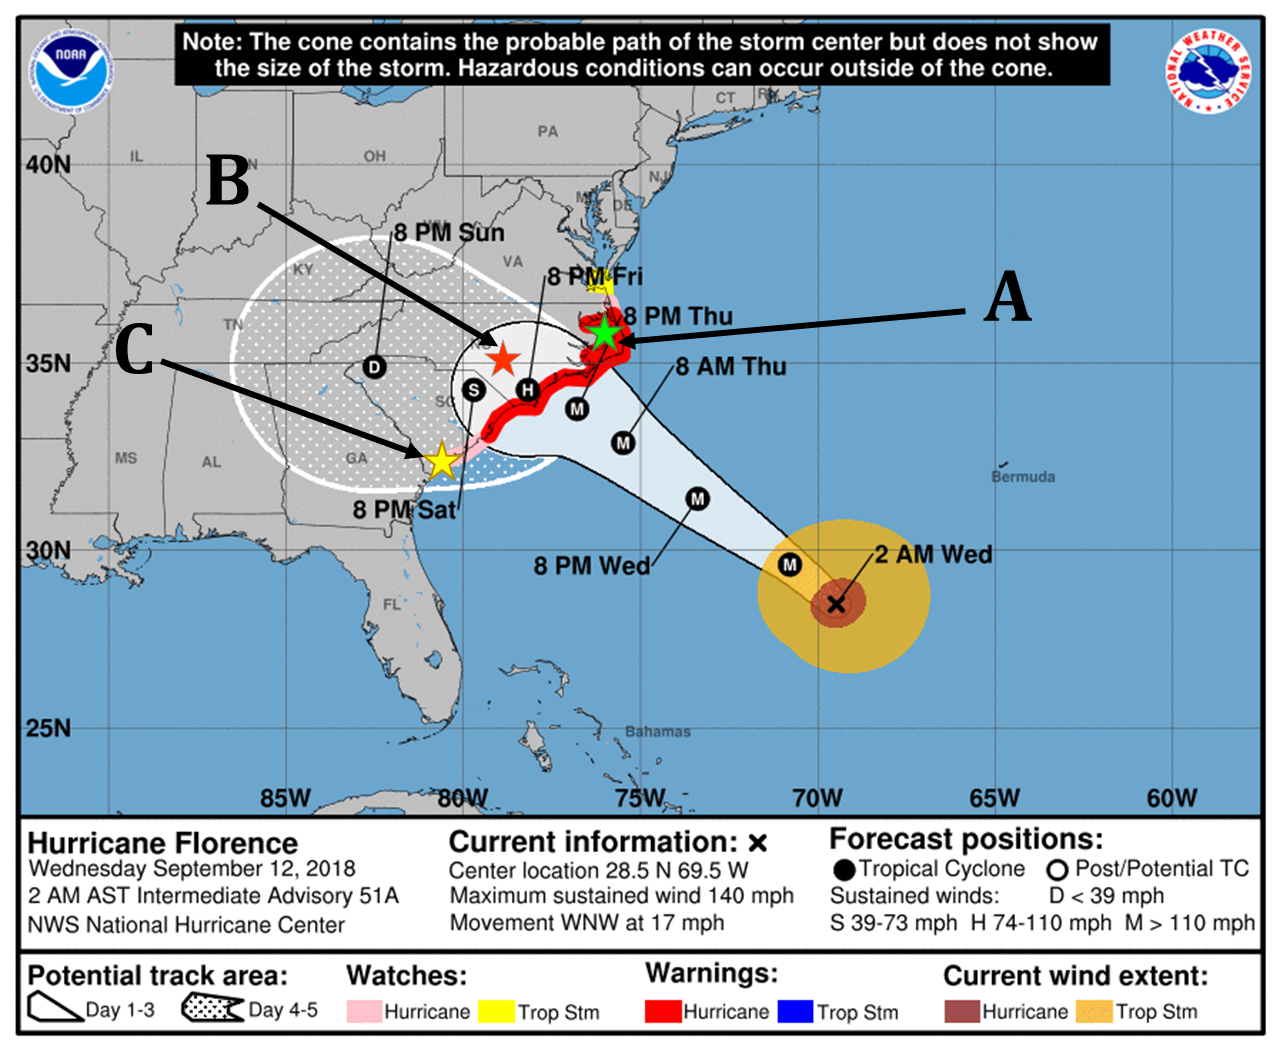

Based on this graphic, if your organization was in the following locations, indicated by the stars, HOW LIKELY do you think it is that you would be affected by this hurricane at any time during the next 5 days?
|
Not at all likely |
Slightly likely |
Moderately likely |
Very likely |
Certain |
Not enough information from graphic to know |
[If selected Atlantic, Gulf of Mexico, Caribbean Sea, and Country other than the United States in Q3, show following points:] |
||||||
Point A: Nags Head, NC |
|
|
|
|
|
|
Point B: Fayetteville, NC |
|
|
|
|
|
|
Point C: Charleston, SC |
|
|
|
|
|
|
[If selected Pacific in Q3, show following points:] |
||||||
Point A: Kailua-Kona (Big Island) |
|
|
|
|
|
|
Point B: Kahului (Maui) |
|
|
|
|
|
|
Point C: Lihue (Kauai) |
|
|
|
|
|
|
Based on this graphic, what level of possible impacts would your organization likely prepare for in the following locations?
|
None |
Minimal |
Moderate |
Very High |
Extreme |
Not enough information from graphic to know |
[If selected Atlantic, Gulf of Mexico, Caribbean Sea, and Country other than the United States in Q3, show following points:] |
||||||
Point A: Nags Head, NC |
|
|
|
|
|
|
Point B: Fayetteville, NC |
|
|
|
|
|
|
Point C: Charleston, SC |
|
|
|
|
|
|
[If selected Pacific in Q3, show following points:] |
||||||
Point A: Kailua-Kona (Big Island) |
|
|
|
|
|
|
Point B: Kahului (Maui) |
|
|
|
|
|
|
Point C: Lihue (Kauai) |
|
|
|
|
|
|
Suppose you were at [random scenario location; see notes on pages 15–19], indicated by the star on the graphic. How likely would you be to take the following actions?
Action |
Not relevant for me |
Not at all likely |
Slightly likely |
Moderately likely |
Very likely |
Not sure |
Move materials and/or equipment indoors or out of the area |
|
|
|
|
|
|
Harden structures with shutters, etc. |
|
|
|
|
|
|
Make staff adjustments (placement, schedules, additions) |
|
|
|
|
|
|
Bring special supplies and/or equipment into the area |
|
|
|
|
|
|
Cancel all but critical events/ activities |
|
|
|
|
|
|
Shut down facilities |
|
|
|
|
|
|
Evacuate people or facilities |
|
|
|
|
|
|
Activate emergency operations |
|
|
|
|
|
|
Open shelters |
|
|
|
|
|
|
Activate fallback facility or alternative operations center |
|
|
|
|
|
|
Communicate and coordinate with stakeholders, partners, and/or the community |
|
|
|
|
|
|
Start tracking storm-related costs |
|
|
|
|
|
|
Other (specify): ________________ |
|
|
|
|
|
|
Notes for Question 21: The text inserted in Q21 will be randomly selected from one of four scenarios (graphics) with the set of 4 potential scenarios based on the respondent’s selection in Q3. The table provides details on these scenarios.
Q3 Answer |
Randomly Selected Scenario (see graphics below) |
Timing |
Inside or Outside Cone |
Geographic Placement |
Atlantic Ocean, Gulf of Mexico, Caribbean Sea, and Country other than the United States |
A1 |
More than 5 days |
Outside |
Matagorda, TX |
A2 |
Within 5 days |
Outside |
Savannah, GA |
|
A3 |
Within 4-5 days |
Inside |
Mobile, AL |
|
A4 |
Within 0-3 days |
Inside |
Tampa, FL |
|
Pacific |
P1 |
More than 5 days |
Outside |
Honolulu, HI |
P2 |
Within 5 days |
Outside |
Honolulu, HI |
|
P3 |
Within 4-5 days |
Inside |
Honolulu, HI |
|
P4 |
Within 0-3 days |
Inside |
Honolulu, HI |
Scenario A1:
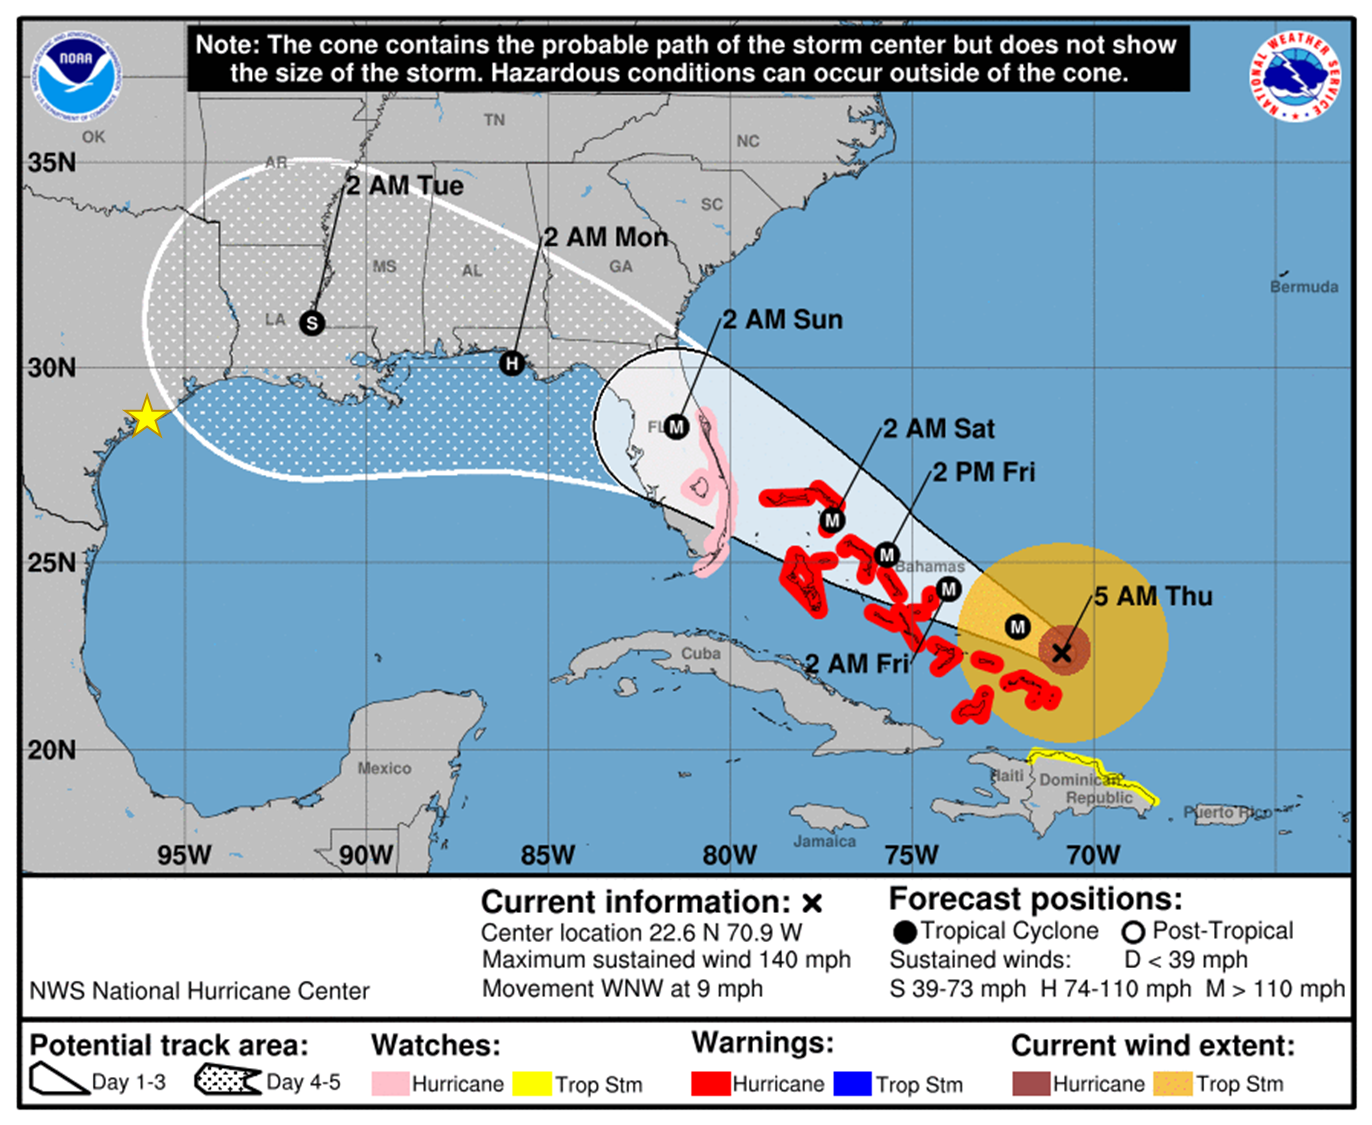
Scenario A2:
Scenario A3:
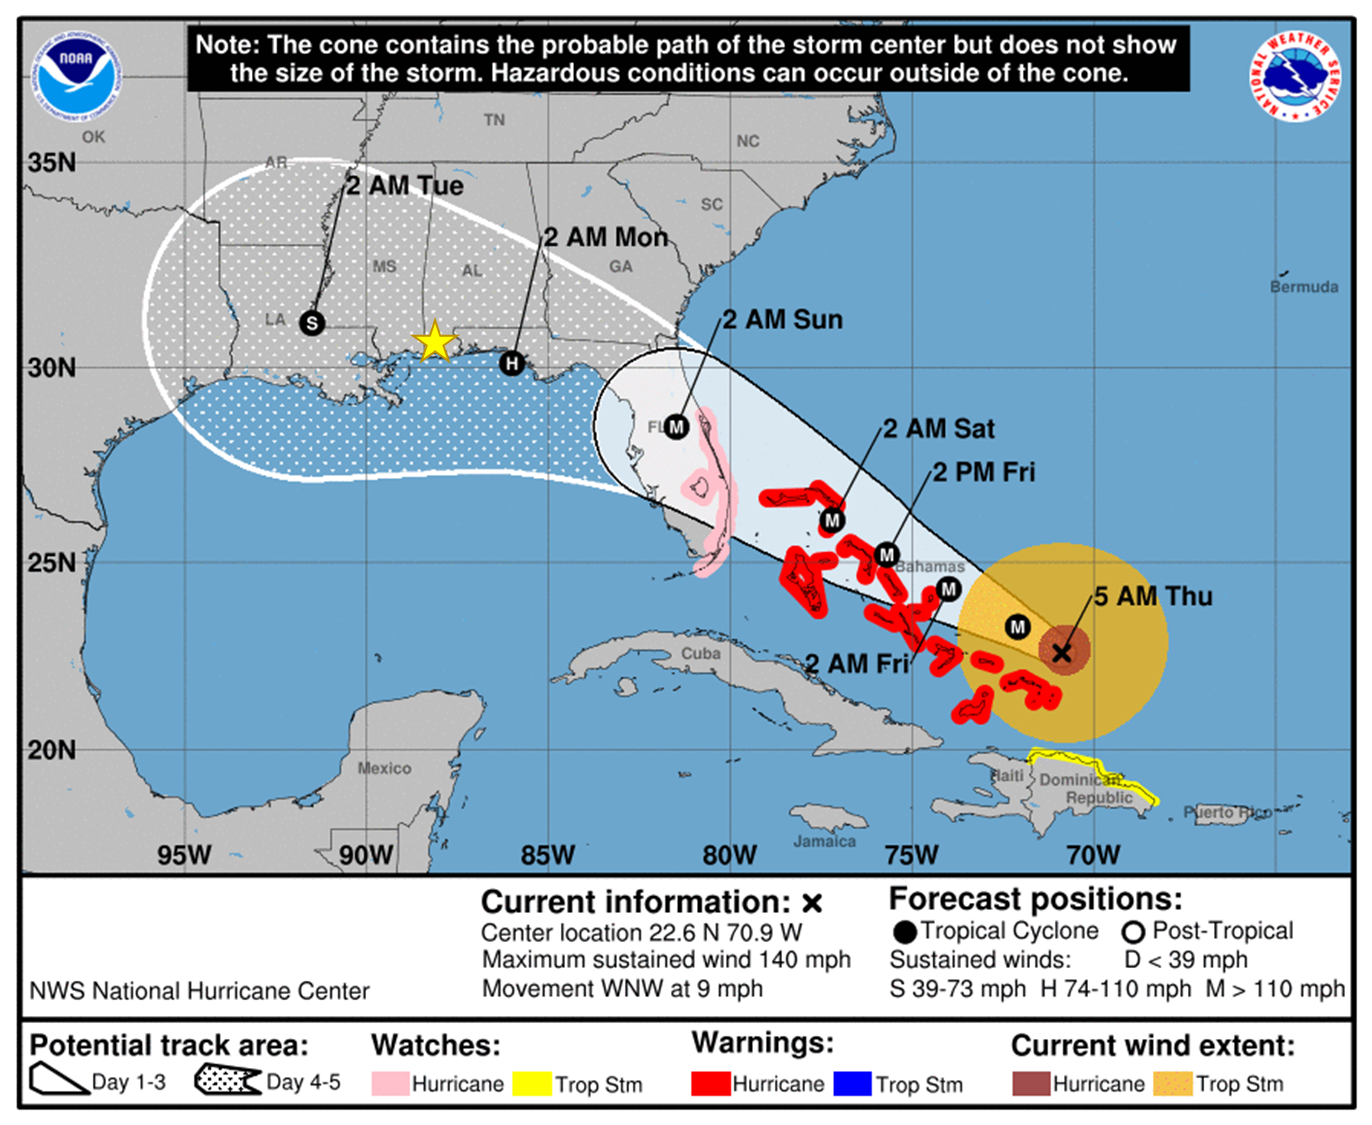
Scenario A4:
Scenario P1:
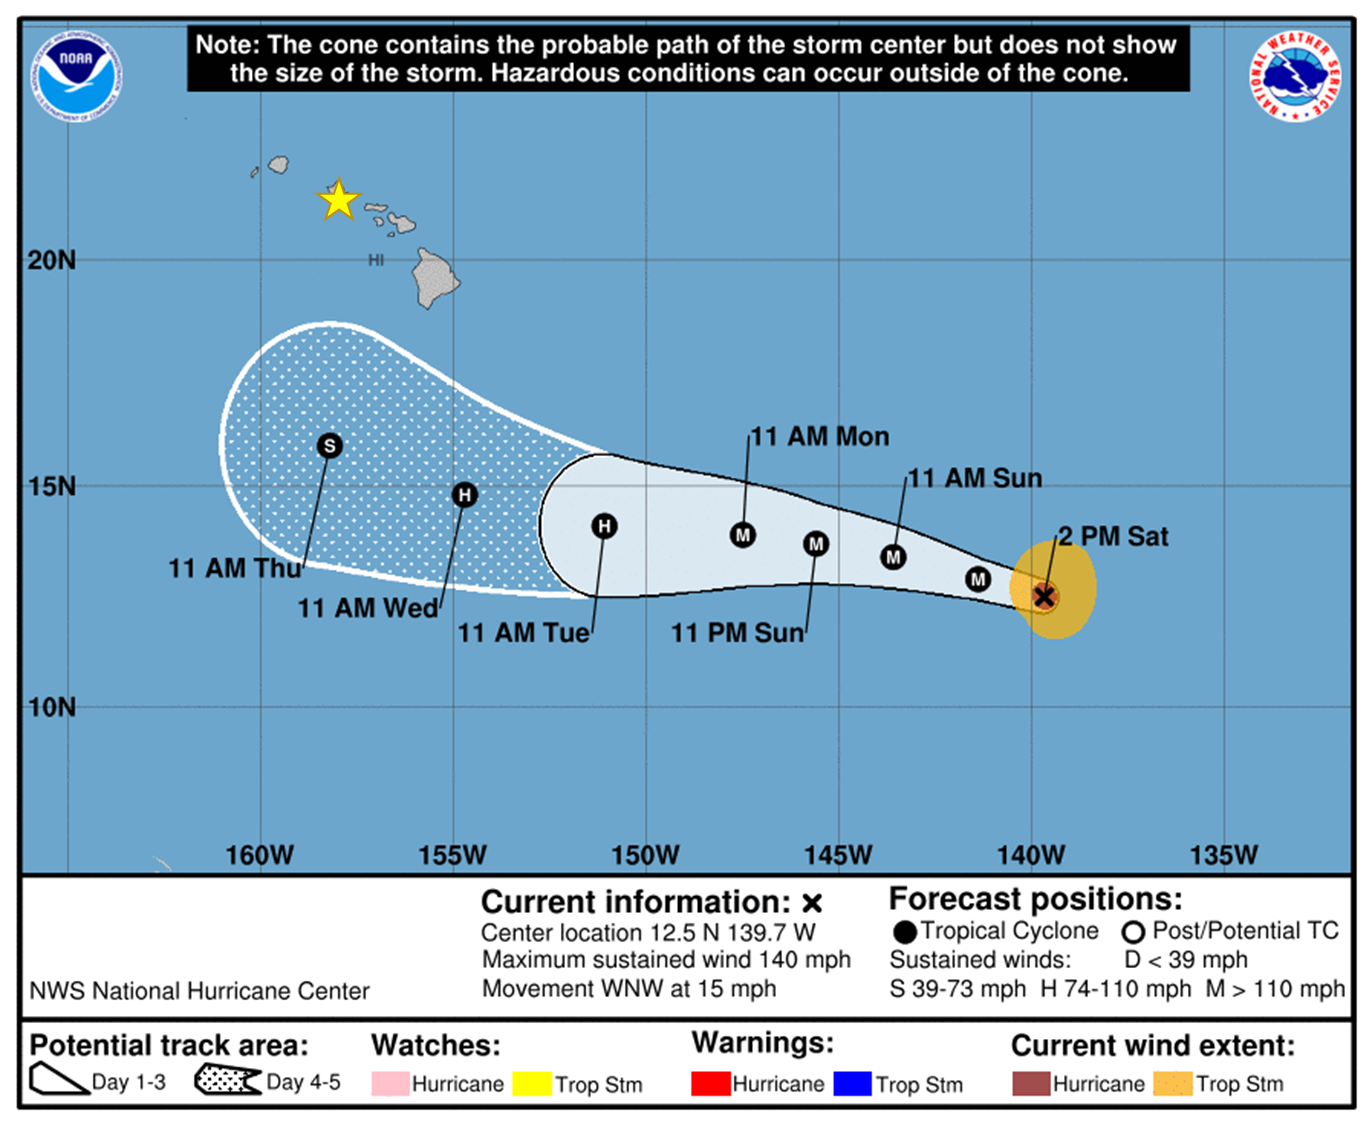
Scenario P2:

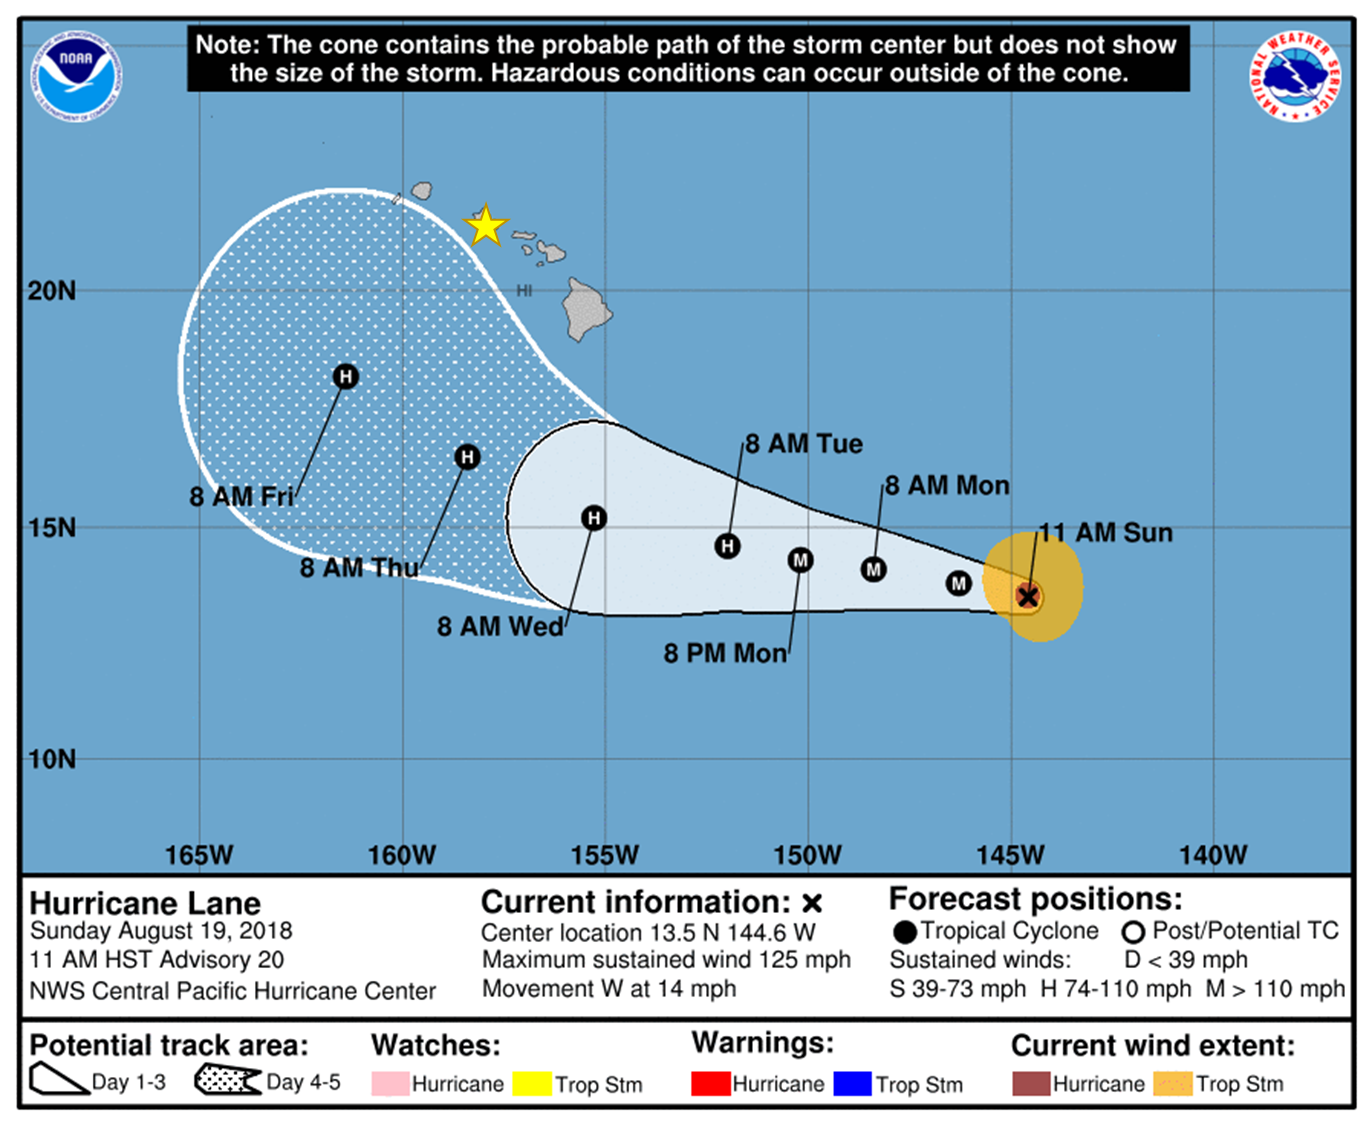
Scenario P3:
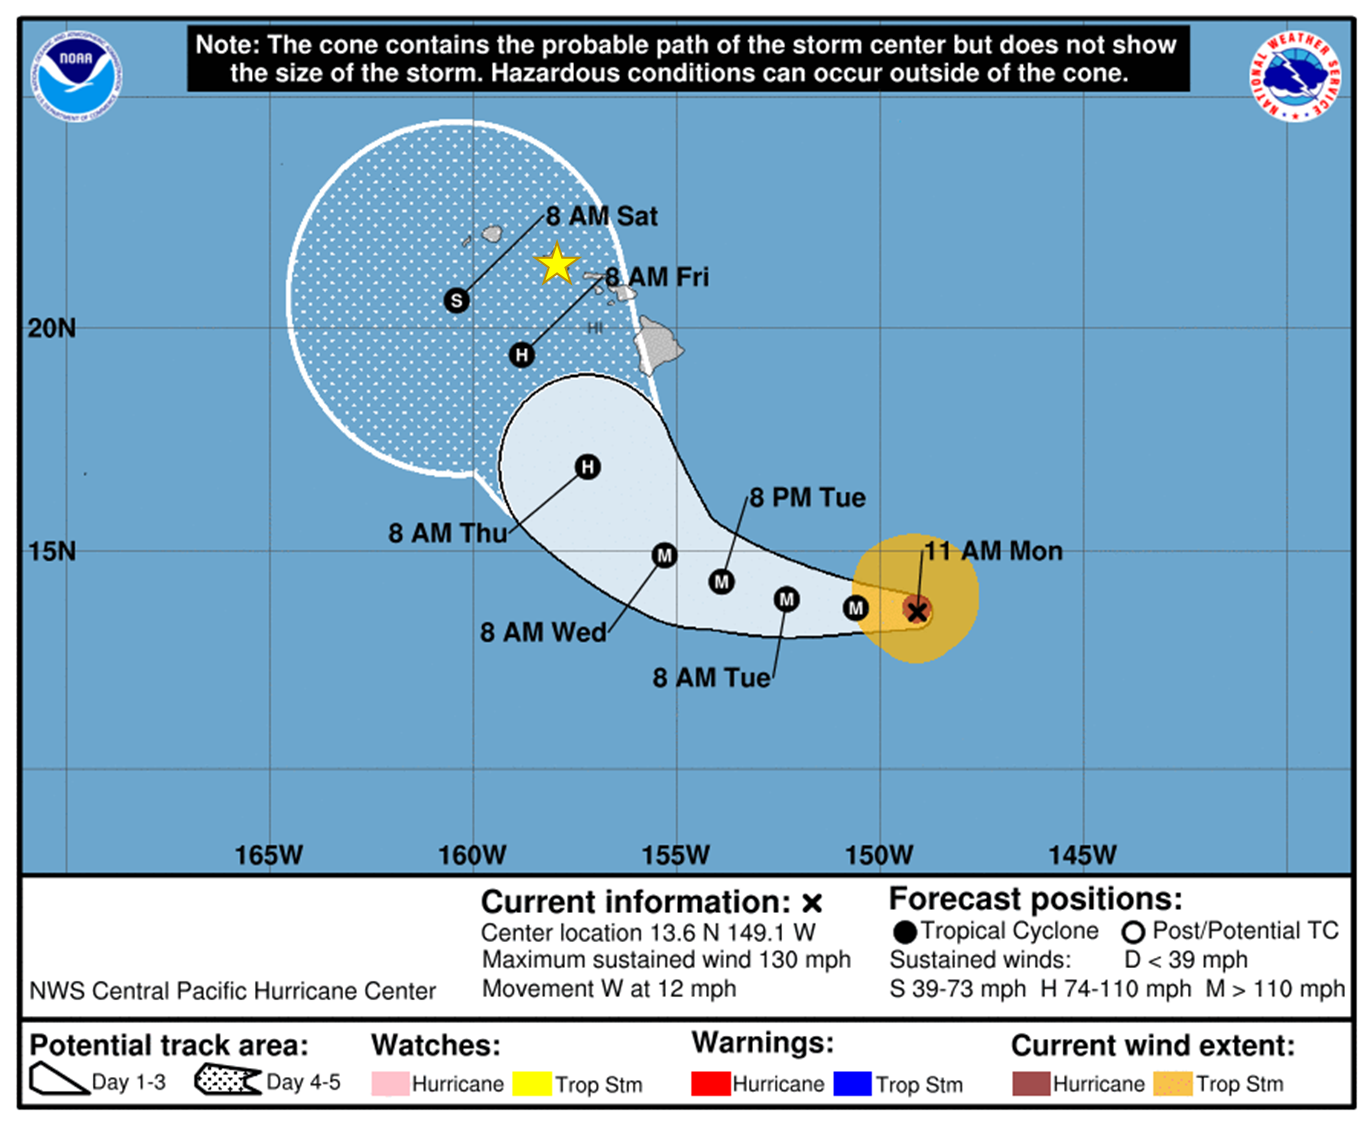
Scenario P4:

OTHER TRACK FORECAST GRAPHICS
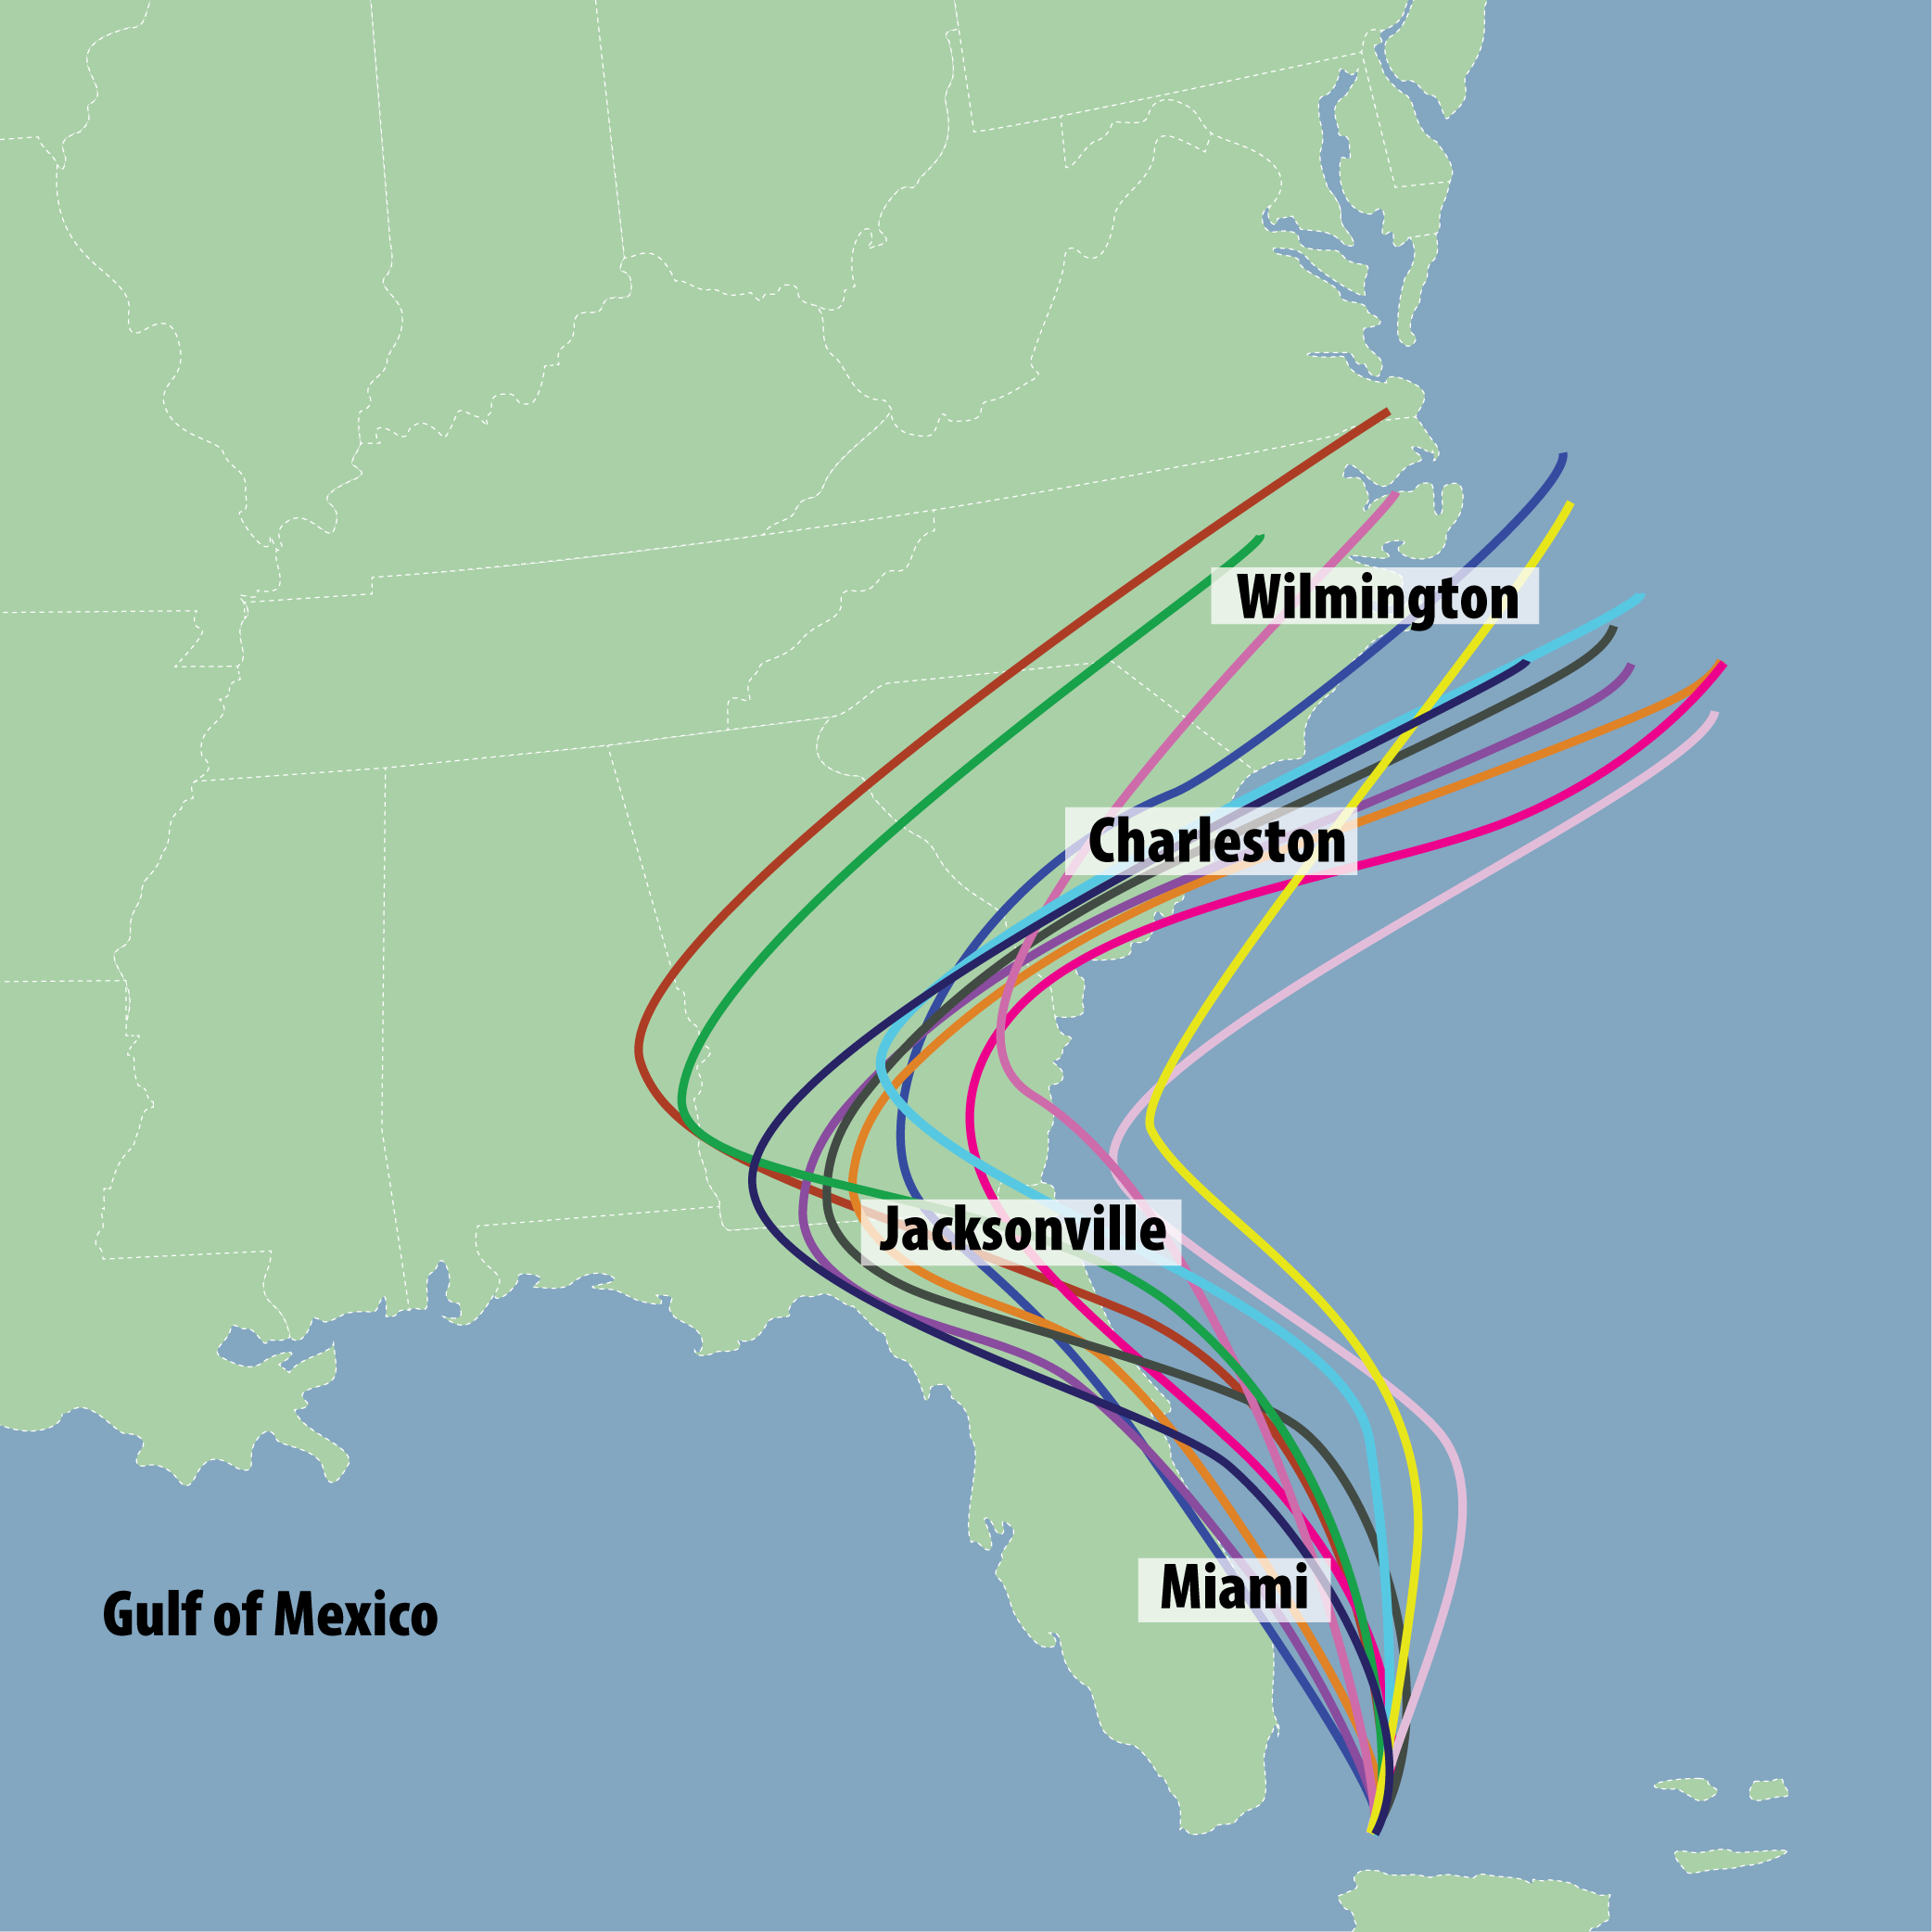
The following three questions refer to a type of graphic that illustrates various track forecasts resulting from different computer models, sometimes known as a “spaghetti graphic.”
How familiar are you with this type of graphic (see example to the right)?
Not at all familiar
Slightly familiar
Moderately familiar
Very familiar
Extremely familiar
Not sure/don’t know
How important would you say this type of graphic is to your organization’s preparation for decision-making?
Not at all important
Slightly important
Moderately important
Very important
Extremely important
It is not available for our area of operations
Not sure/don’t know
What can you get out of this type of graphic that you can’t get from the National Weather Service Cone Graphic or other NWS products, such as Watches/Warnings, Wind Speed Probability Products, etc. ____ [open ended]
Do you have any further suggestions related to hurricane forecast information or graphics that you would like to share with the National Weather Service? _______________________________[open ended]
DEMOGRAPHICS
How many years of work experience do you have in your current industry?
0 to 10 years
11 to 20 years
21 to 30 years
31 to 40 years
More than 40 years
How would you describe your level of expertise in your current position?
Novice
Advanced beginner
Competent
Proficient
Expert
What best describes your role in deciding if and when your organization needs to prepare for a hurricane?
Primary decision-maker
Part of top group of decision-makers
Adviser to decision-maker(s)
Little or no role in these decisions
What is your job title? ________________________
Thank you for participating in this NWS survey. If you would like more information about this project, please visit: [insert link].
1 The term “hurricane” is used in this survey generically to refer to all tropical cyclones, including tropical depressions, tropical storms, typhoons, and super typhoons.
| File Type | application/vnd.openxmlformats-officedocument.wordprocessingml.document |
| Author | Tadesse Wodajo |
| File Modified | 0000-00-00 |
| File Created | 2021-01-14 |
© 2026 OMB.report | Privacy Policy