BEES Please Questionnaire Guide
0693-0036-BEES-Please-QuestionnaireUserGuide-03102020.docx
BEES (Building for Environmental and Economic Sustainability) Please
BEES Please Questionnaire Guide
OMB: 0693-0036

QUESTIONNAIRE User Guide

Anne Landfield Greig
Four Elements Consulting, LLC
![]()
Joshua D. Kneifel
U.S. Department of Commerce
National Institute of Standards and Technology
January 2020
Table of Contents
Basic Life Cycle Assessment and Inventory Concepts 4
BEES System Boundaries: Your Data in the Life Cycle 4
Completing the Questionnaire 6
Product Lifetime, Transport, and Other data 6
II Facility Data Spreadsheet 7
Completing the Facility Spreadsheet 7
III Installation & Maintenance Spreadsheet 10
IV Utilities Data Spreadsheet 10
When to use the Utility Sheet? 11
V Reporting Details and Rules 11
1. Reporting Rules for Materials 11
2. Exclusion of general site operations and capital equipment 12
3. Avoiding double-counting 12
VI Possible Sources of Facility Information 13
OMB NO: 0693-0036 Expires 03/31/2020. The BEES Please information collection is authorized by the U.S. Office of Management and Budget. Your response is voluntary. Public reporting for this collection of information is estimated to average 63 minutes per response, including the time of reviewing instructions, searching existing data sources, gathering the data needed, and completing and reviewing the collection of information. Send comments regarding this estimate or any other aspects of this collection of information, including suggestions for reducing the length of this questionnaire, to the National Institute of Standards and Technology, 100 Bureau Drive, Stop 3220, Gaithersburg, MD 20899-3220 and the U.S. Office of Management and Budget, Office of Information and Regulatory Affairs, Washington, D.C. 20503.
Foreword
The
National Institute of Standards and Technology (NIST) Engineering
Laboratory's Applied Economics Office gathers data to develop
environmental profiles for building products for its online tool,
Building for Environmental and Economic Sustainability (BEES). BEES
implements a powerful technique for selecting cost-effective,
environmentally-preferable building products. The most recent
version, BEES Online, a web application aimed at designers, builders,
and product manufacturers, includes environmental and economic
performance data for over 230 building products. BEES can be accessed
at:
http://www.nist.gov/el/economics/BEESSoftware.cfm
The goal for BEES is two-fold:
Help manufacturers innovate and develop cost-effective green building products, and
Allow a broad range of stakeholders, including architects, designers, government agencies, LCA practitioners, green certification organizations, and consumers analyze and select these products based on attributes that matter most.
The data gathered from this questionnaire will be used to generate environmental and cost Life Cycle Assessment (LCA) results and will be incorporated into BEES. We work closely with manufacturers throughout the data collection and aggregation process to ensure that the product(s) being entered into BEES are representative of the product(s). Results will be available for the manufacturer’s review and approval before publication.
Please return your completed questionnaire to Anne Landfield Greig at [email protected].
For assistance in completing the questionnaire, contact Anne at [email protected] (ph: 206-935-4600) or Joshua Kneifel at [email protected] (ph: 301-975-6857).
Basic Life Cycle Assessment and Inventory Concepts
BEES quantifies environmental performance using the multi-disciplinary approach known as Life Cycle Assessment (LCA). LCA is a “cradle-to-grave” systems approach for measuring environmental performance that is standardized by the International Standards Organization (ISO).1 The approach is based on the belief that all stages in the life of a product generate environmental impacts and must therefore be analyzed, including raw materials acquisition, product manufacture, transportation, installation, operation and maintenance, and ultimately recycling and waste management. An analysis that excludes any of these stages is limited because it potentially ignores the full range of upstream and downstream impacts of stage-specific processes.
The strength of environmental LCA is its comprehensive, multi-dimensional scope. Many green building claims and strategies are based on a single life-cycle stage, environmental impact, or attribute. A product is claimed to be green simply because it has recycled content, or claimed not to be green because it emits volatile organic compounds (VOCs) during its installation and use. These single-attribute claims may be misleading because they ignore the possibility that other life-cycle stages, or other environmental impacts, may yield offsetting impacts. For example, the recycled content product may have a high embodied energy content, leading to resource depletion, global warming, and acid rain impacts during the raw materials acquisition, manufacturing, and transportation life-cycle stages. LCA thus broadens the environmental discussion by accounting for shifts of environmental problems from one life-cycle stage to another, or one environmental medium (land, air, water) to another. The benefit of the LCA approach is in implementing a trade-off analysis to achieve a genuine reduction in overall environmental impact, rather than a simple shift of impact.
The LCA methodology involves four steps.2
The goal and scope definition step spells out the purpose of the study and its breadth and depth.
The inventory analysis step identifies and quantifies the environmental inputs and outputs associated with a product over its entire life-cycle. Environmental inputs include water, energy, and other resources; outputs include releases to air, land, and water. However, it is not these inputs and outputs, or inventory flows, that are of direct interest. We are most interested in their consequences, or impacts on the environment. Thus, the next LCA step,
Impact assessment characterizes these inventory flows in relation to a set of environmental impact categories. For example, the impact assessment step might relate carbon dioxide emissions, a flow, to global warming, an impact.
The interpretation step combines the environmental impacts in accordance with the goals of the LCA study.
We need your help with the second LCA step, inventory analysis. During this step, a life cycle inventory (LCI) is compiled which records material and energy flows into and out of a product system. Based on your completed questionnaire, NIST will compile the LCI and LCIA for your product for review by your firm. Once the product results are uploaded into BEES, BEES will facilitate the LCA interpretation step by permitting the user to synthesize impact scores into an aggregate environmental performance score for your product.
BEES System Boundaries: Your Data in the Life Cycle
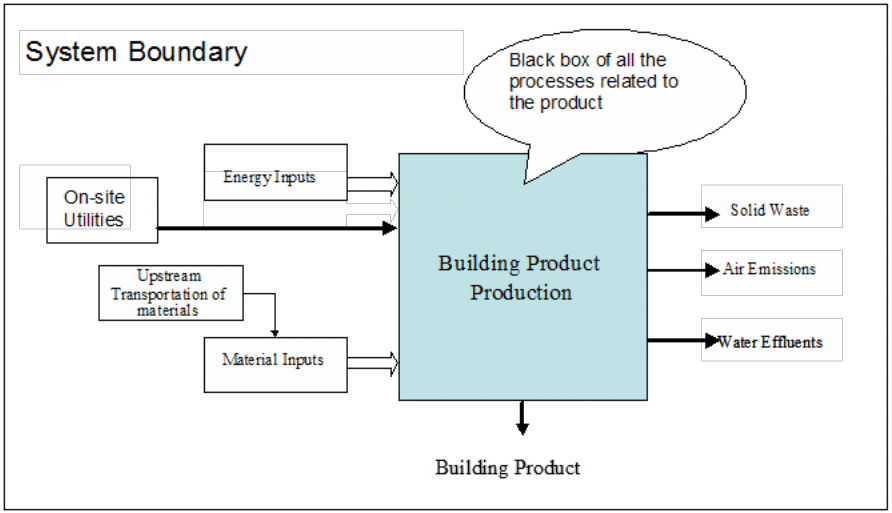
LCA evaluates environmental impacts across all stages in the life of a product: raw materials acquisition, product manufacture, transportation, use, and end of life. Since you are not likely to have detailed environmental performance data for the extraction and production of the raw materials you consume, we are not asking for these data. Rather, much of this questionnaire focuses on the product composition and the manufacturing step you control, from raw materials entering your plant to the finished products ready to be shipped from your plant. Figure 1 displays the processes at your facility of interest. Note that the blue box (“black box”) should encompass all the production processes contributing to the production of your product.

Figure 1 Facility System Boundaries
The questionnaire also contains questions on the use phase of your product, including product installation and maintenance, as well as questions on its disposition at the end of its useful life (including recyclability). For the questions you cannot answer, we work together to come up with reasonable estimates or assumptions based on similar products.
The results that are compiled for your product will include all life-cycle stages, with raw material acquisition data collected from standard databases, and any missing use and end-of-life stage data based on published sources and industry interviews.
Allocation Rules
We are asking for data related to the environmental inputs and outputs of your product’s manufacturing process. Often, a manufacturing plant produces two or more products at the same time (co-products). When this is the case, the inputs and outputs for the plant need to be split, or allocated, to indicate the flows specific to the building product for BEES. This allocation will be done by NIST once your completed questionnaire is received. Therefore, report information for the entire production process, including the BEES product and any other products produced by the same process.
Your manufacturing process may use some on-site utilities that are shared by the entire plant and, therefore, by other products that the plant may produce. Examples of on-site utilities include:
An on-site power plant generating steam, electricity, compressed air, or hot water which is consumed by the whole plant,
A wastewater treatment plant which treats effluents coming from different parts of the plant.
In an LCA study, since on-site utilities usually serve several processes, their input and output quantities are allocated among processes. You may need to make this allocation. The Utilities section below will address data for this part of the questionnaire.
Completing the Questionnaire
The Excel-based BEES questionnaire consists of four parts plus the Introduction:
Product Data
Facility Data
Installation & Maintenance
Utilities Data
The Introduction sheet gives basic information on your company, contact person, and identifies the product to be included in BEES. Once NIST receives your completed questionnaire, our expert consultants will review your data for completeness, accuracy, and consistency, and may have questions for your contact person.
Detailed instructions for completing the four sections follow. Part 4, Utilities, may not be relevant to your process or product.
I Product Data Spreadsheet
Bill of Materials (BOM)
The BOM will provide us with the materials that make up the BEES product. Aim to provide 99 % or greater by mass of your product. Approaching 100 % of inputs is ideal for completeness.

Figure 2 Product Data Questionnaire Structure : BOM Section
Below a couple questions on product characteristics (a, b, and c in the figure), Column B (d) provides the space to list the materials that make up the product. Provide the quantity of materials in mass units in Column D, per the square area you choose in (a). Specify unit of mass in Column C. Columns E and F tell us how and how far materials were transported to your plant. Provide the distance the material is transported and the mode of transportation (truck, rail, barge, etc.). Specify units (e.g., kilometer or mile).
Only white fields should be filled in. Additional columns or rows can be added when space is needed.
Packaging
Describe how the product is packaged. For example, “flooring sheets of 5' x 20', rolled onto a recycled cardboard core and wrapped in plastic film. 8 rolls are transported on a wooden pallet”. Next, provide the quantity of each material per amount described (i.e., 5 lb cardboard per roll).
Product Lifetime, Transport, and Other data
These questions cover additional quantitative and qualitative attributes of the product, and include:
The useful life of the product in years, months, etc.;
The mass of the product;
The recyclability of the product at the end of its useful life;
Transportation of the finished product to the building site or customer;
Manufacturer’s suggested retail price, which is used for economic performance calculations.
II Facility Data Spreadsheet
Completing the Facility Spreadsheet
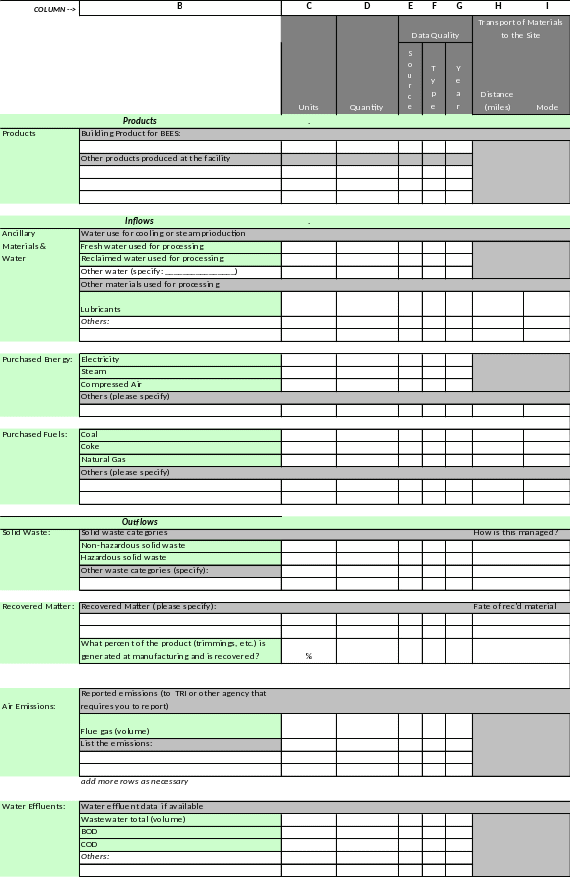
The figure below displays the structure of the Facility Data in the questionnaire. The columns for data input will be described in turn.

Figure 3 Facility Data Questionnaire Structure
COLUMN B: Inputs and Outputs
Products and Coproducts
List the product (and coproducts) at your facility and their quantity produced. You may report them in the unit you prefer (e.g., yard, square foot, pound, kilogram, etc.). The rest of the data on the Facility Data sheet must be reported in terms of the total production quantity reported here.
Inflows – Ancillary Materials, Water, and Energy
Ancillary materials. Provide the quantities of materials consumed during processing, that are not a part of the final product. Provide the data in mass units, per your quantified output.
Water. Report only make-up process (or cooling water) that has been lost in the system; be careful not to include water that is being recycled somewhere in the facility. In the “Notes” column (not shown in the figure), provide the source of the water if known.
Energy. Provide the quantities of purchased energy and purchased fuels consumed during processing or manufacturing. If you have a special type of energy (i.e., all hydropower) or are buying electricity from a special grid, please note this. Also, if your energy source (i.e., natural gas boiler) is especially efficient (or inefficient), state so and provide us with more details. For energy flows, please indicate if the quantity represents Net Caloric Value (NCV) or Gross Caloric Value (GCV).3
Outflows
Waste not recovered. Report information on the non-hazardous and hazardous solid waste produced and describe its fate (i.e., landfill; hazardous waste incineration; etc.). Provide waste on a dry mass basis.
Recovered material. Recovered material includes any material reused/recycled in the same process (i.e. recycled as a closed loop) or in a process not related to your product. In any event, provide what the fate is for each recovered material. We will model the closed loops accordingly. For recovered energy, provide any information regarding whether processes produce energy that goes to other processes. This information will be used to give the process “credit” for that energy used elsewhere.
Air Emissions. Provide emissions reported to the Toxic Release Inventory (TRI) or other required reporting entities. These may include pollutants that a baghouse or other air pollutant scrubbing technology might not have captured, other particulates, VOC’s, metals in air, etc. Do not worry too much about fuel combustion-related air emissions (e.g., CO2…), as these are included within our own data sets on fuel combustion to assure consistency in fuel-related emissions across all BEES products.
Water Effluents. Provide the total wastewater quantity generated by the process (on a volume basis). For the effluents, if you have an on-site wastewater treatment plant (WWTP) that treats effluents from different parts of your facility, then report the effluents in the utility section under WWTP. If you do not have an on-site WWTP, state so and provide the effluents as they leave your facility, and state what their fate is (direct to water body or to an off-site WWTP). If it is an off-site WWTP, we will use our WWTP reduction factors for the modeling.
COLUMN C: Units
The “Units” column requests the units corresponding to the quantity reported in column D.
It is important that units be used that permit conversion to inflow and outflow quantities. For example, if consumption of a material is reported in pounds per year, then yearly production of the product should also be reported. If pollutants are reported as concentration (e.g., SOx in ppmv), then the corresponding volume should also be indicated (a row for volume of flue gas and wastewater is included in the questionnaire).
COLUMN D: Quantity
Quantity needs to be filled in with values corresponding to the production quantity of all the products reported (starting at Row 8 in the spreadsheet).
COLUMNS E, F, G: Data Quality
Data quality measures include data source, type, and year.
Data Source. Data source refers to where the data originated. In each cell, use the following letters to represent the appropriate category:
-
F
At the plant
L
From literature
O
Other (specify in the questionnaire)
Data Type. Data type refers to how you obtained the data point. In each cell, use one of the following letters to represent the appropriate category:
-
M
Measured (e.g., electricity meter)
C
Calculated (emissions factors, mass balance, …)
E
Estimated (estimation has been established based on approximations, e.g. transportation distance)
S
Shared or apportioned (data for 2 processes are estimated)
O
Other (specify in the questionnaire)
Year. Provide the year the reported data point represents. Usually, it is best to provide data for the most recent fiscal year for which it is possible to get 12 months of the most complete/most accurate information. Overall, it is best to report data all from 1 year, but if you have to use data from different years, report the information and specify the year(s).
COLUMNS H and I: Transport of Materials to Site
Columns H and I are for information on transportation of the raw material to the site. The distance the material is transported and the mode of transportation (truck, rail, barge, etc.) are requested for each material transported to the site. Specify units (e.g., kilometer or mile).
III Installation & Maintenance Spreadsheet
The Installation section begins with a general question about how your product is installed. The next part includes providing the quantity of manufacturer-recommended installation materials (e.g., bonding agent for floor tiles, nails for roofing materials) and energy needed to install a given area or quantity of product.
The Maintenance section requests for information on product maintenance schedule and requirements (e.g., floor wax for quarterly waxing of floor coverings). Names of recommended or generic cleaning / finishing products, or their general composition are helpful.
IV Utilities Data Spreadsheet
On-site utilities at your plant could include:
Electric or co-generation plant
Wastewater treatment plant
Air scrubbing equipment
When to use the Utility Sheet?
If a utility is dedicated to only the product for which you are collecting data, then you may include those inputs and outputs in the Facility Data sheet (see Figure 1).
If the utility provides services for parts of the plant other than where the BEES product is manufactured, then allocating the inputs and outputs to the product should be done, and this spreadsheet should be completed.
Directions
On the Utilities spreadsheet, provide all inputs and outputs for the utility plant for the reporting year. Inputs, outputs, and organization of the worksheet are similar to the Facility Data worksheet.
Please give the % the utility is applied to the BEES product you are reporting on, shown below:

Figure 4 Example of a Utility and its Allocation
Use the above approach for all of your utilities pertaining to the product for which you are collecting data.
V Reporting Details and Rules
1. Reporting Rules for Materials
Inflows
While it is impossible to try to record all the inflows to the production process, we still want to capture as many inputs as possible. Decision rules have been established, as follows, to restrict data collection to the set of inputs that will capture information we might overlook, while ensuring we meet our cut-off goal.
Report all energy inputs, including electricity, steam, and compressed air;
Record 99 percent (by weight) or more of total production process inputs. Those inputs that make up less than 0.1% may be excluded;
Record inputs that are small yet have an environmental burden. Typical criteria for the importance of an environmental burden is the purchase cost is high, since this may indicate scarce resources or high energy consumption or obscure/expensive chemicals; and
Report inputs, even if small, if the data are available.
Other Rules for Materials
For recycled materials, specify the percentage of recycled content.
If possible, provide the chemical composition for inputs in addition to their commercial names. You may also provide their function. When chemical composition is not available, enter the consumable under its function name followed by the term “unspecified” (e.g. “coagulating agent: unspecified”, “anti-corroding agent: unspecified”).
If an input is supplied as diluted with water or in an amorphous material, report it in pure terms, that is, 100% of weight. Or if you prefer, provide the full amount, but include the dilution percentage.
Outflows: Solid Waste and Co-products
Solid waste or co-products for which the accumulated tonnage represents less than 1% (by weight) of the total waste or co-product tonnage for the production process need not be recorded.
2. Exclusion of general site operations and capital equipment
Flows not directly related to industrial activities are not taken into account, e.g., cafeteria, building heat, and restroom operations. If these are included because you could not separate this from, e.g., total electricity, state so in the questionnaire.
Capital equipment associated with the site facility should also be excluded, with the exception of capital equipment consumables (example: in the mining industry, truck tires may be replaced numerous times over the course of a year; for this reason, these are considered consumables).
3. Avoiding double-counting
Internal
flows for a building product production process should not be
reported in the questionnaire. This principle applies to both
inflows (materials and energy) and outflows. For example, as
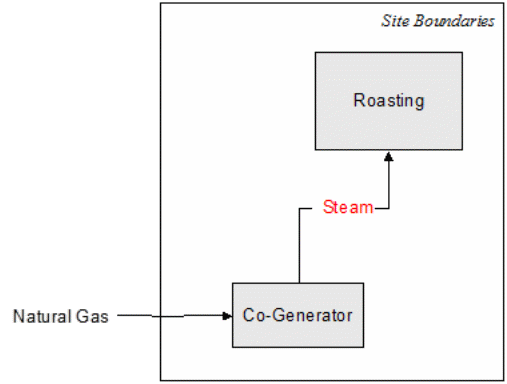
indicated by its depiction in red in

Figure 5 presents the amount of steam energy entering the production process should not be reported because it is an internal flow subject to double counting. If the steam is produced in a boiler, its use is already accounted for through the allocated boiler inputs (e.g., natural gas or heavy fuel oil) and emissions which are recorded in the questionnaire.
Figure 5 Internal Flows – Avoid Double-Counting
VI Possible Sources of Facility Information
The following table identifies the business units most likely to have the information necessary to provide the data requested in this questionnaire.
-
Flow Category
Business Unit
Raw materials and energy
On-site utilities (power plants, etc.)
-- Purchasing Department, Production Department
-- Energy Department for power plant
-- Environmental Department for wastewater treatment plant
Air emissions
Environmental Department
Water effluents
Environmental Department
Solid Waste
Environmental Department
1 ISO 14040:2006, the International Standard of the International Standardization Organization, Environmental management. Life cycle assessment. Principles and framework, and ISO 14044:2006, Environmental management – Life cycle assessment – Requirements and guidelines.
2 ISO 14040:2006.
3NCV or Low Heat Value is the energy recoverable by the combustion of a unit quantity of fuel when the combustion product (the exhaust) is not brought back to the ambient temperature and pressure. GCV or High Heat Value is the total quantity of energy released by the combustion of a unit quantity of fuel, as measured by a bomb calorimeter. The difference between GCV and NCV is the vaporization latent heat of the water contained in the exhaust and the exhaust sensible heat.
| File Type | application/vnd.openxmlformats-officedocument.wordprocessingml.document |
| Author | Anne Greig |
| File Modified | 0000-00-00 |
| File Created | 2021-01-14 |
© 2026 OMB.report | Privacy Policy