Attachment 4 – HC What MEPS tells us about…Charts
Attachment 4 HC What MEPS tells us about Charts.docx
Medical Expenditure Panel Survey Household Component and Medical Provider Component (MEPS-HC and MEPS-MPC)
Attachment 4 – HC What MEPS tells us about…Charts
OMB: 0935-0118


 What
MEPS tells us about ... children
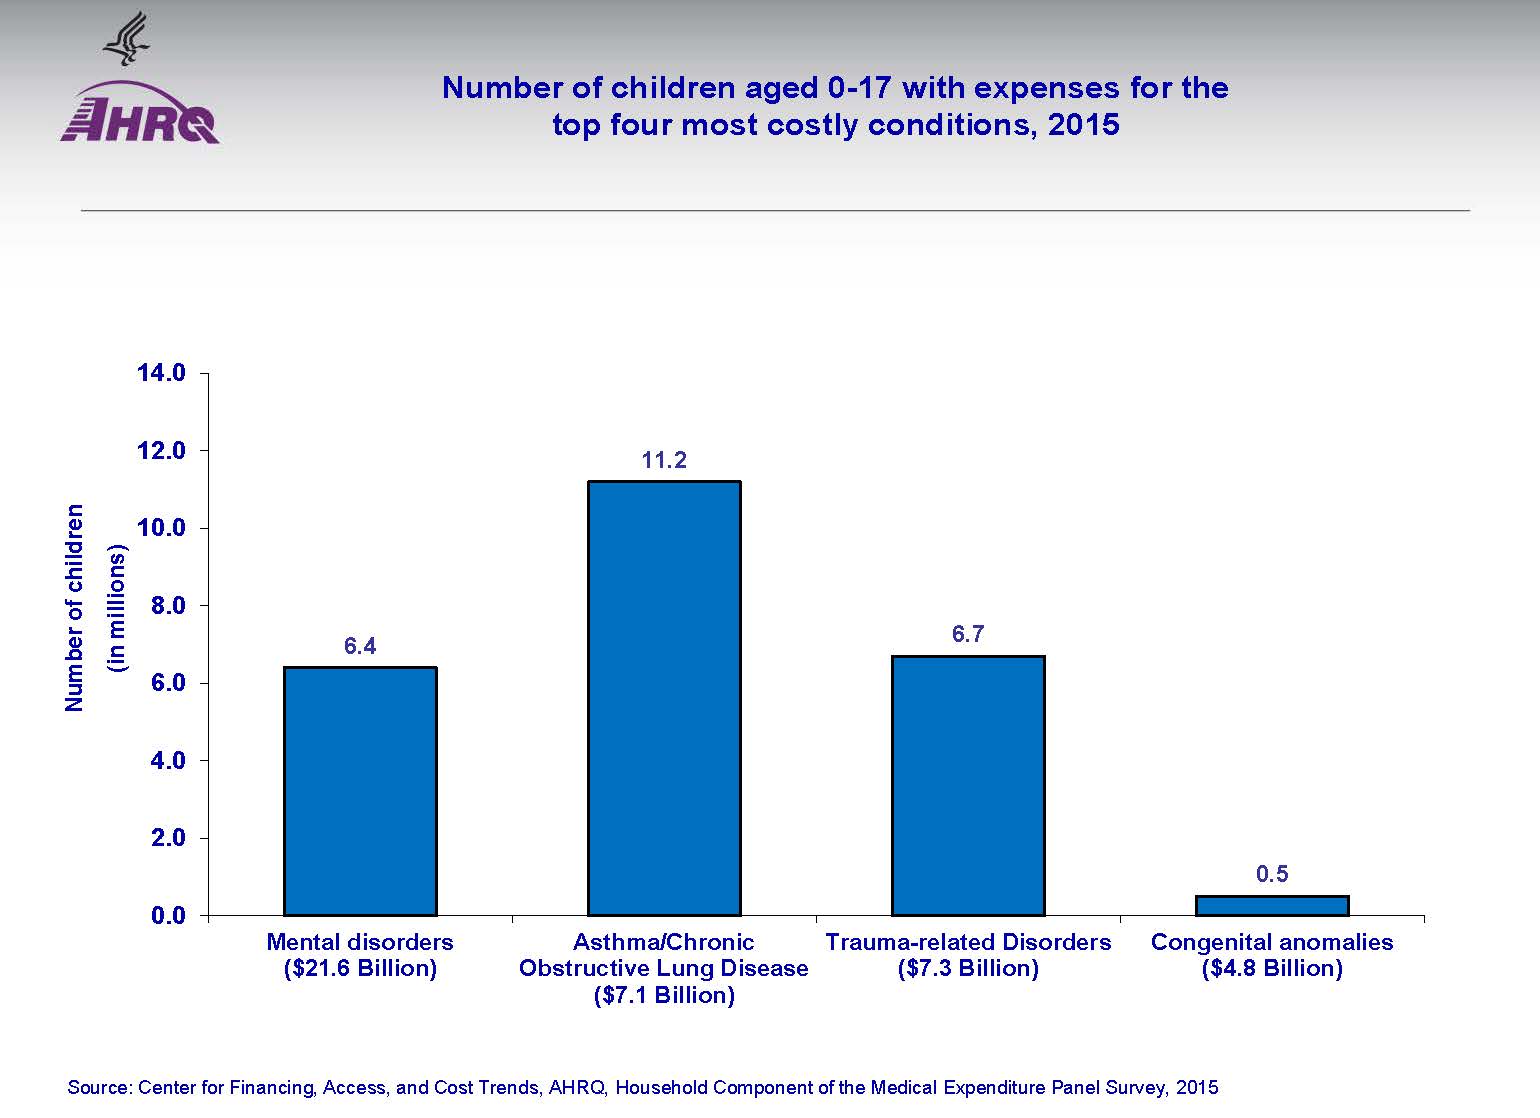
Of the four most costly conditions for children, congenital anomalies affect the fewest children and are the least expensive conditions to treat.
The most expensive conditions to treat for children are mental disorders.
11 million children had asthma or similar chronic respiratory condition.
In 2015, it cost about the same to treat children with asthma or similar chronic respiratory diseases as it did to treat children with trauma-related disorders.

 What
MEPS tells us about … children
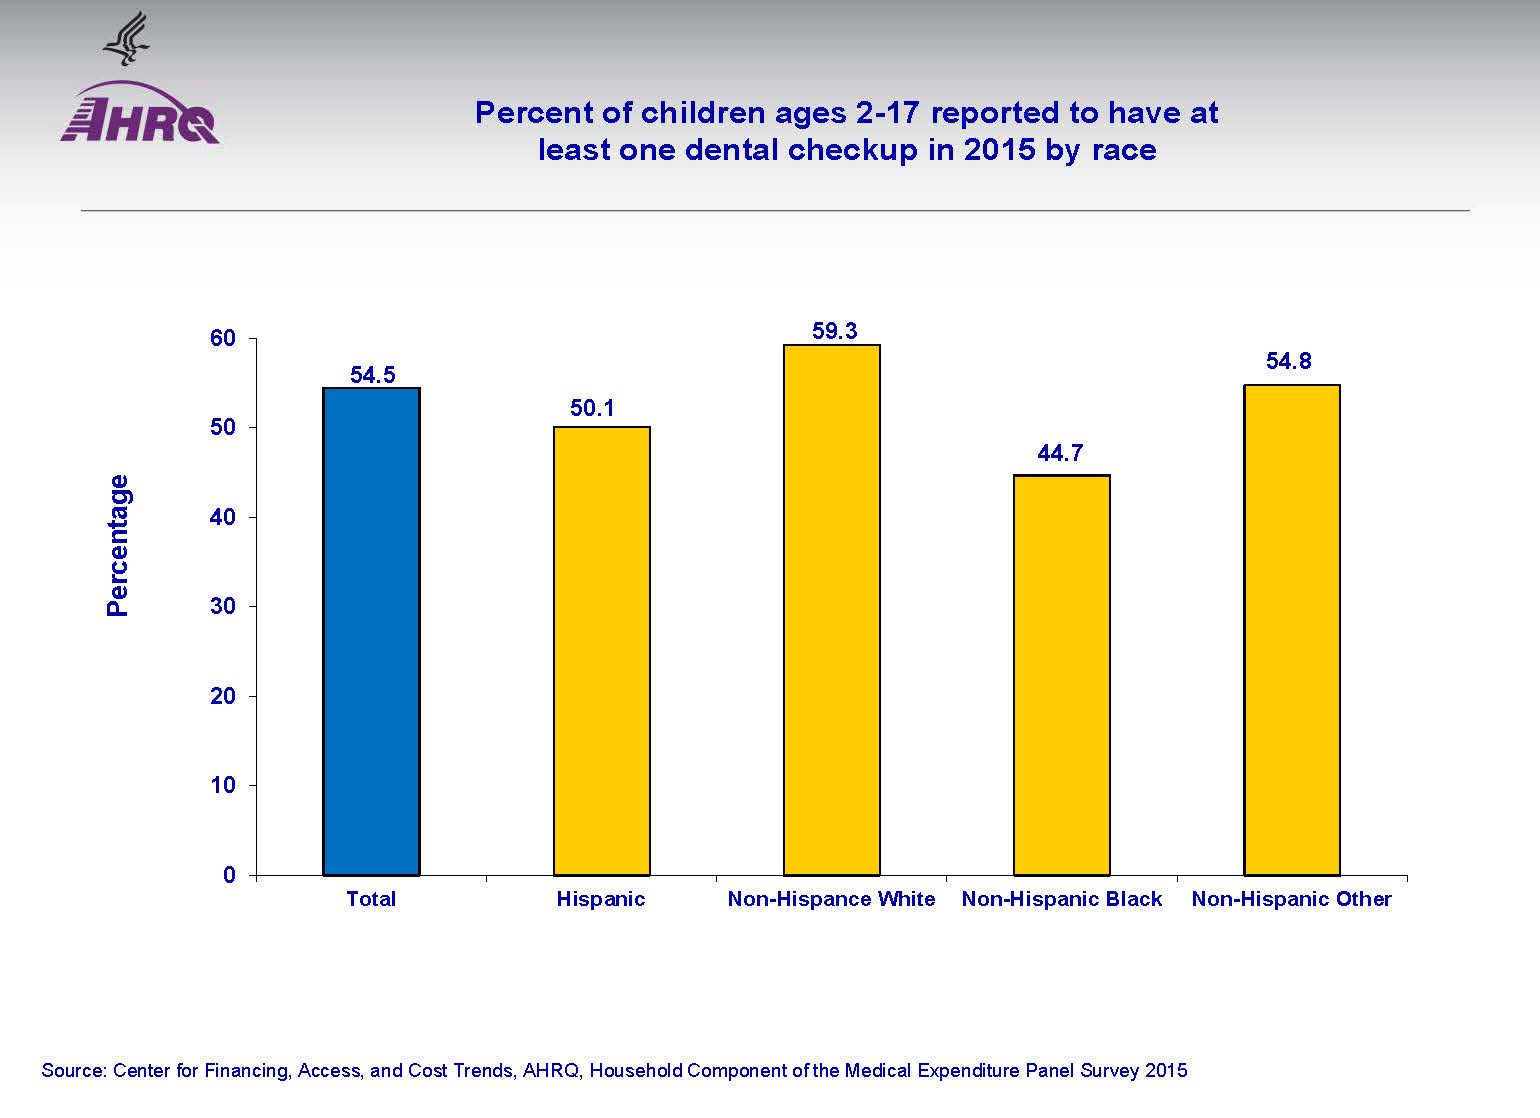
General guidelines suggest children 2 years old and older visit the dentist two times a year.
However, in 2015, only about half of all children in that age group had at least one dental checkup. Which means about half of 2-17 year old children did not have any dental check-ups in 2015.
In 2015, there was little variation by race or ethnicity in the percentage of children with at least one dental check-up.
About half of Hispanic children reported having at least one dental check-up in 2015.
A little over half of white, non-Hispanic children had at least one dental checkup in 2015.

 What
MEPS tells us about … young men
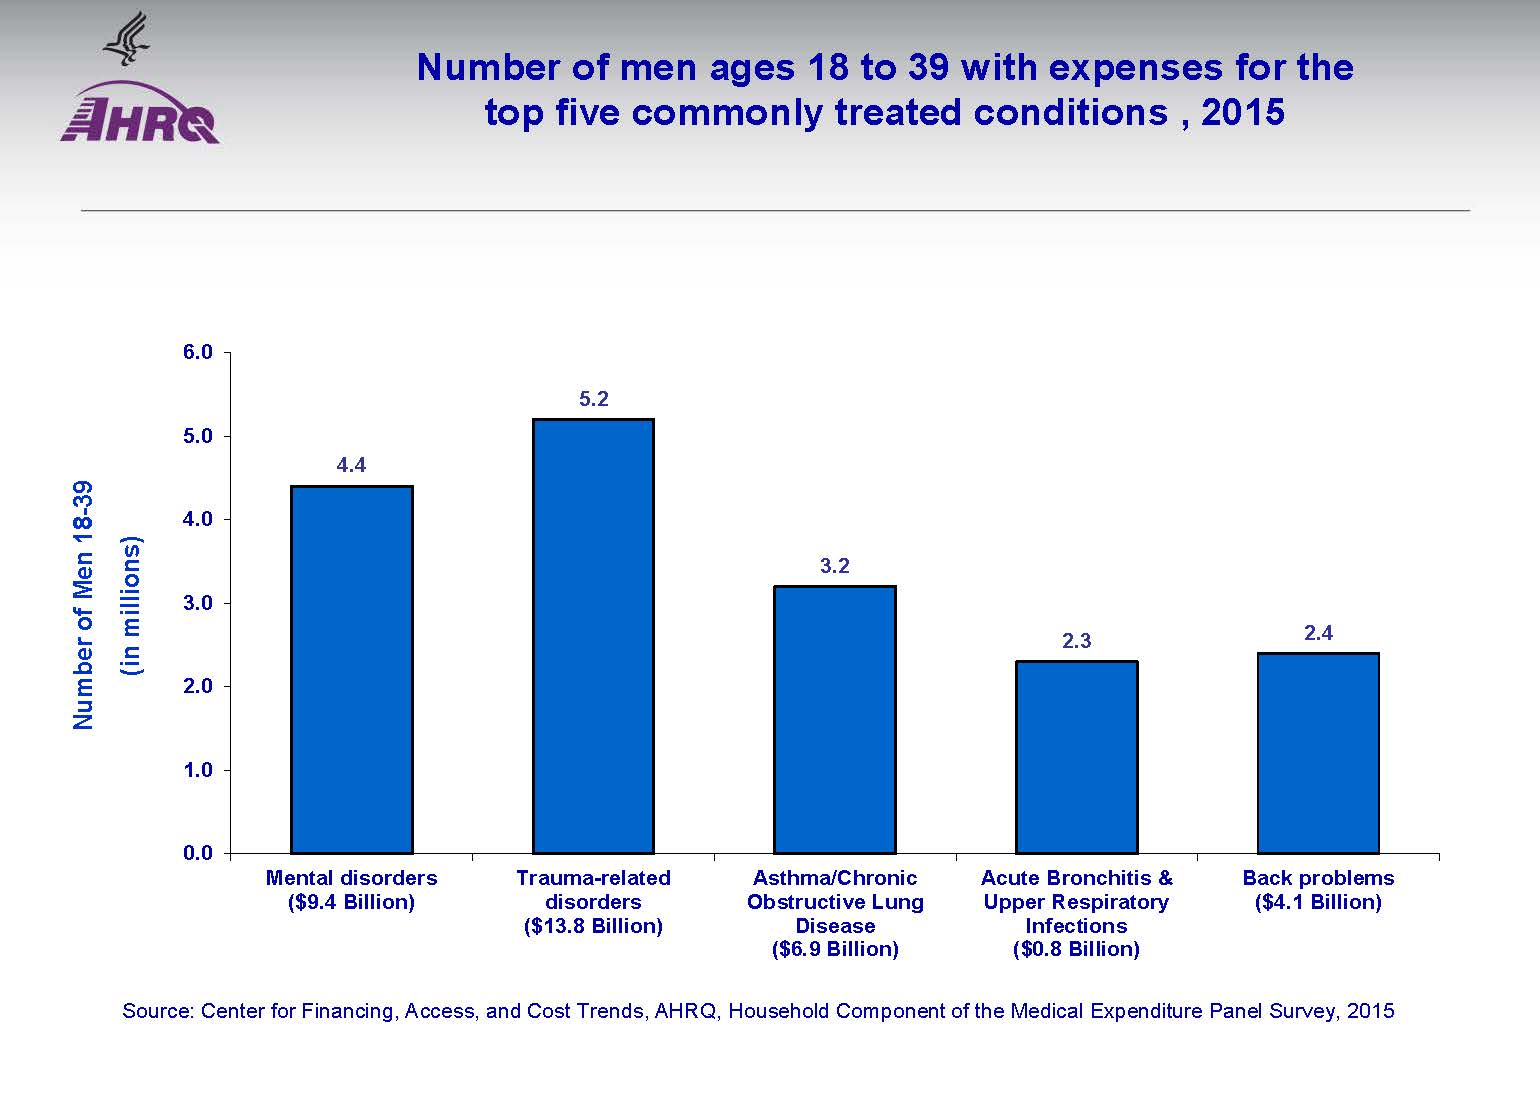
Of the five most costly conditions for men between 18 and 39, trauma-related disorders such as injuries from car accidents and sports affect young men the most and are the most expensive to treat.
In 2015, treating trauma-related disorders in men 18-39 years old cost just about the same as treating asthma, bronchitis, and back problems combined.
In 2015 about the same number of men between 18 and 39 received treatment for bronchitis and other respiratory infections as they did for back problems.

 What
MEPS tells us about … young women
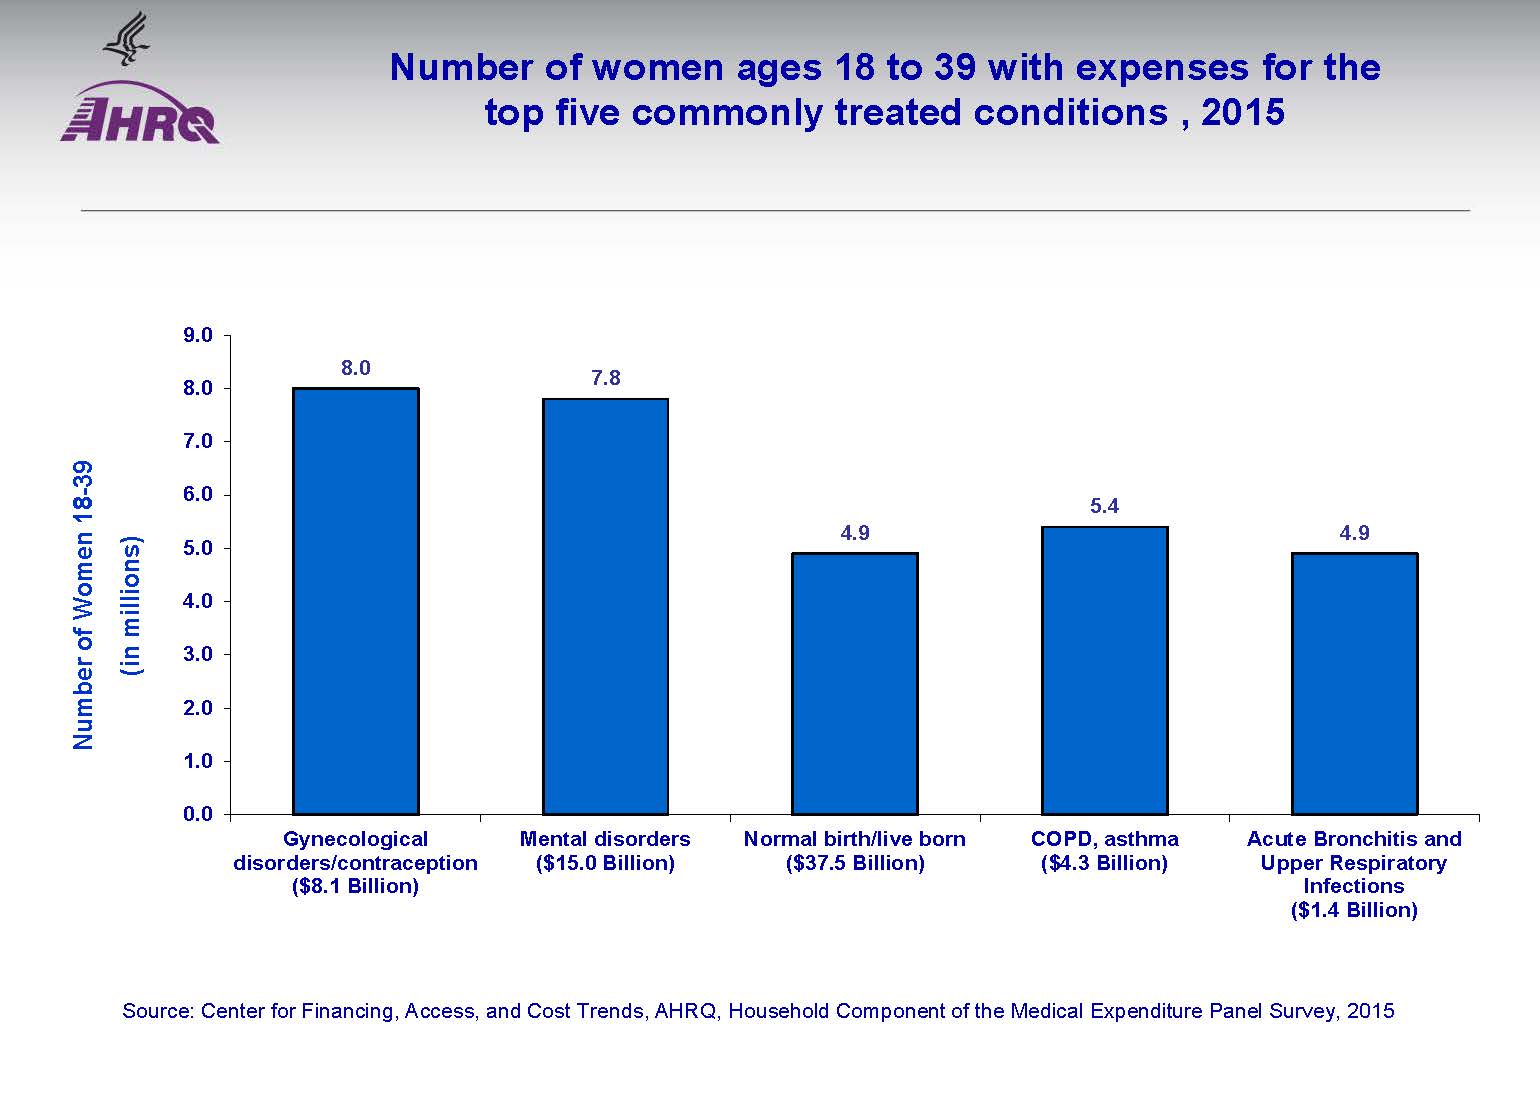
In 2015, more money was spent on care associated with child birth than other health care for women ages 18-39.
However, over 3 million more women between the ages of 18-39 received gynecological care, including contraception, than women who gave birth.
In 2015, for women ages 18 to 39, giving birth cost $22 billion more than care for mental disorders, the second most costly condition.

 What
MEPS tells us about … seniors
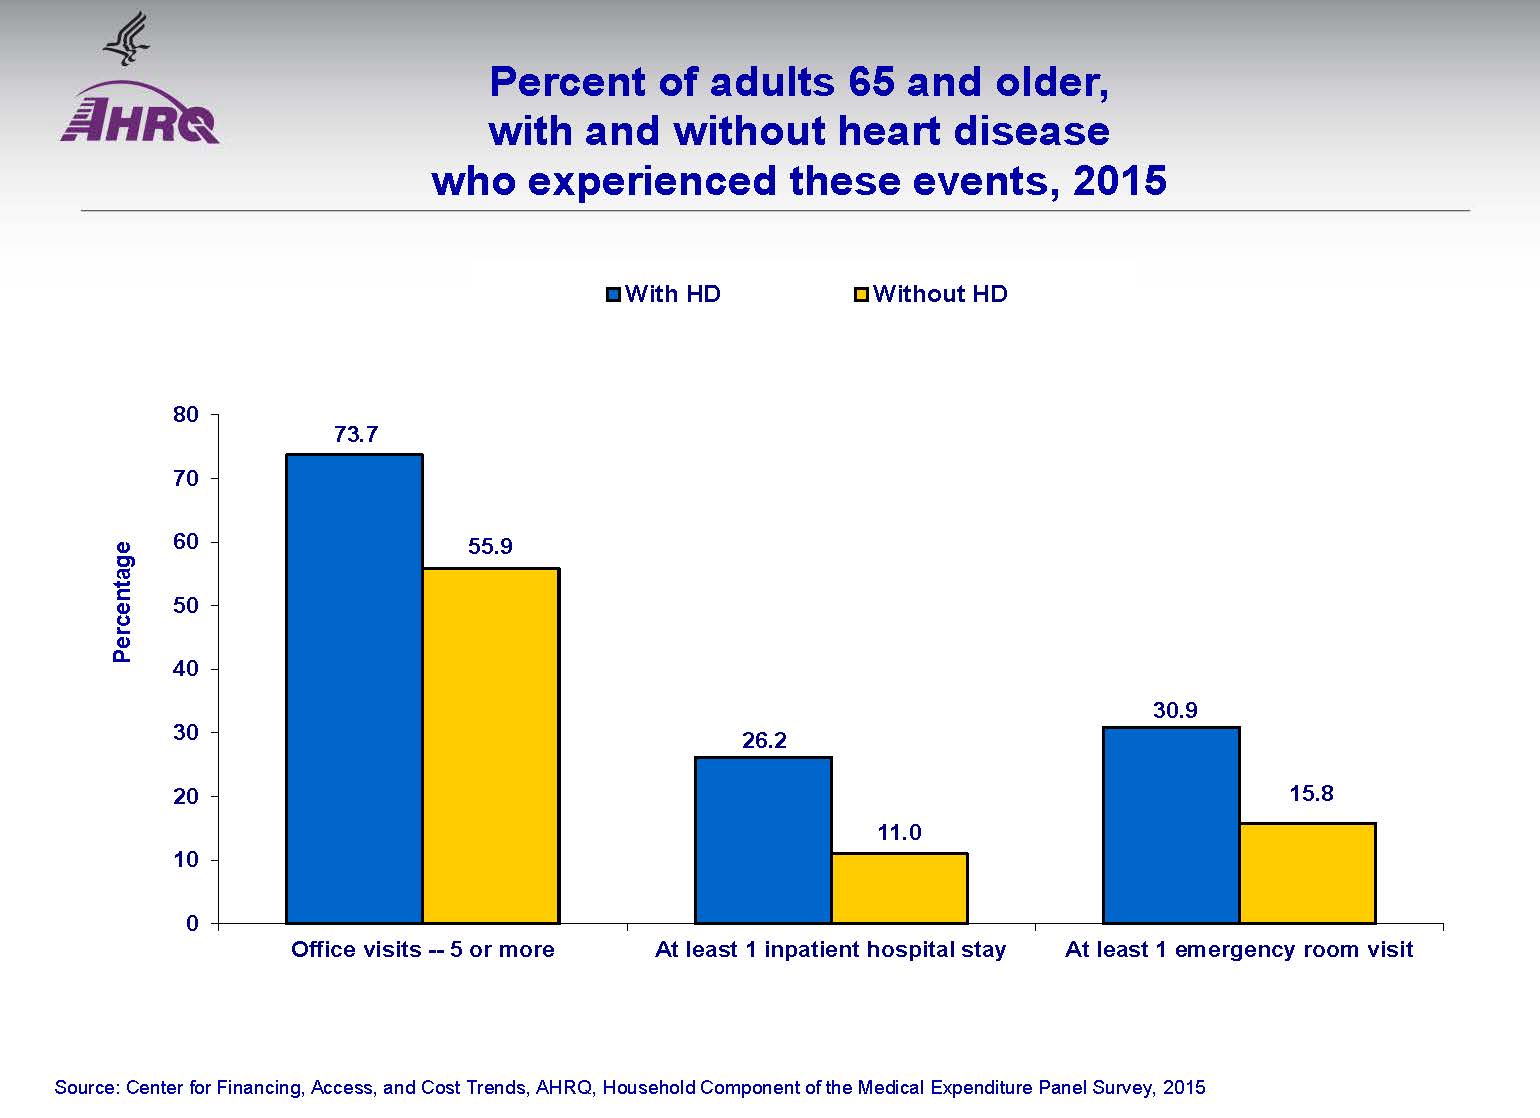
Over half of all adults 65 and older had 5 or more visits to a health provider office in 2015.
Almost 3/4 of seniors with heart disease saw a health care provider 5 or more times in 2015.
In 2015, adults ages 65 or older with heart disease were nearly two times more likely to have at least one emergency room visit than seniors without heart disease.
For adults ages 65 or older, having heart disease meant you were much more likely than those without heart disease to have a large number of office visits, inpatient hospital stays and emergency room visits.

 What
MEPS tells us about … chronic conditions
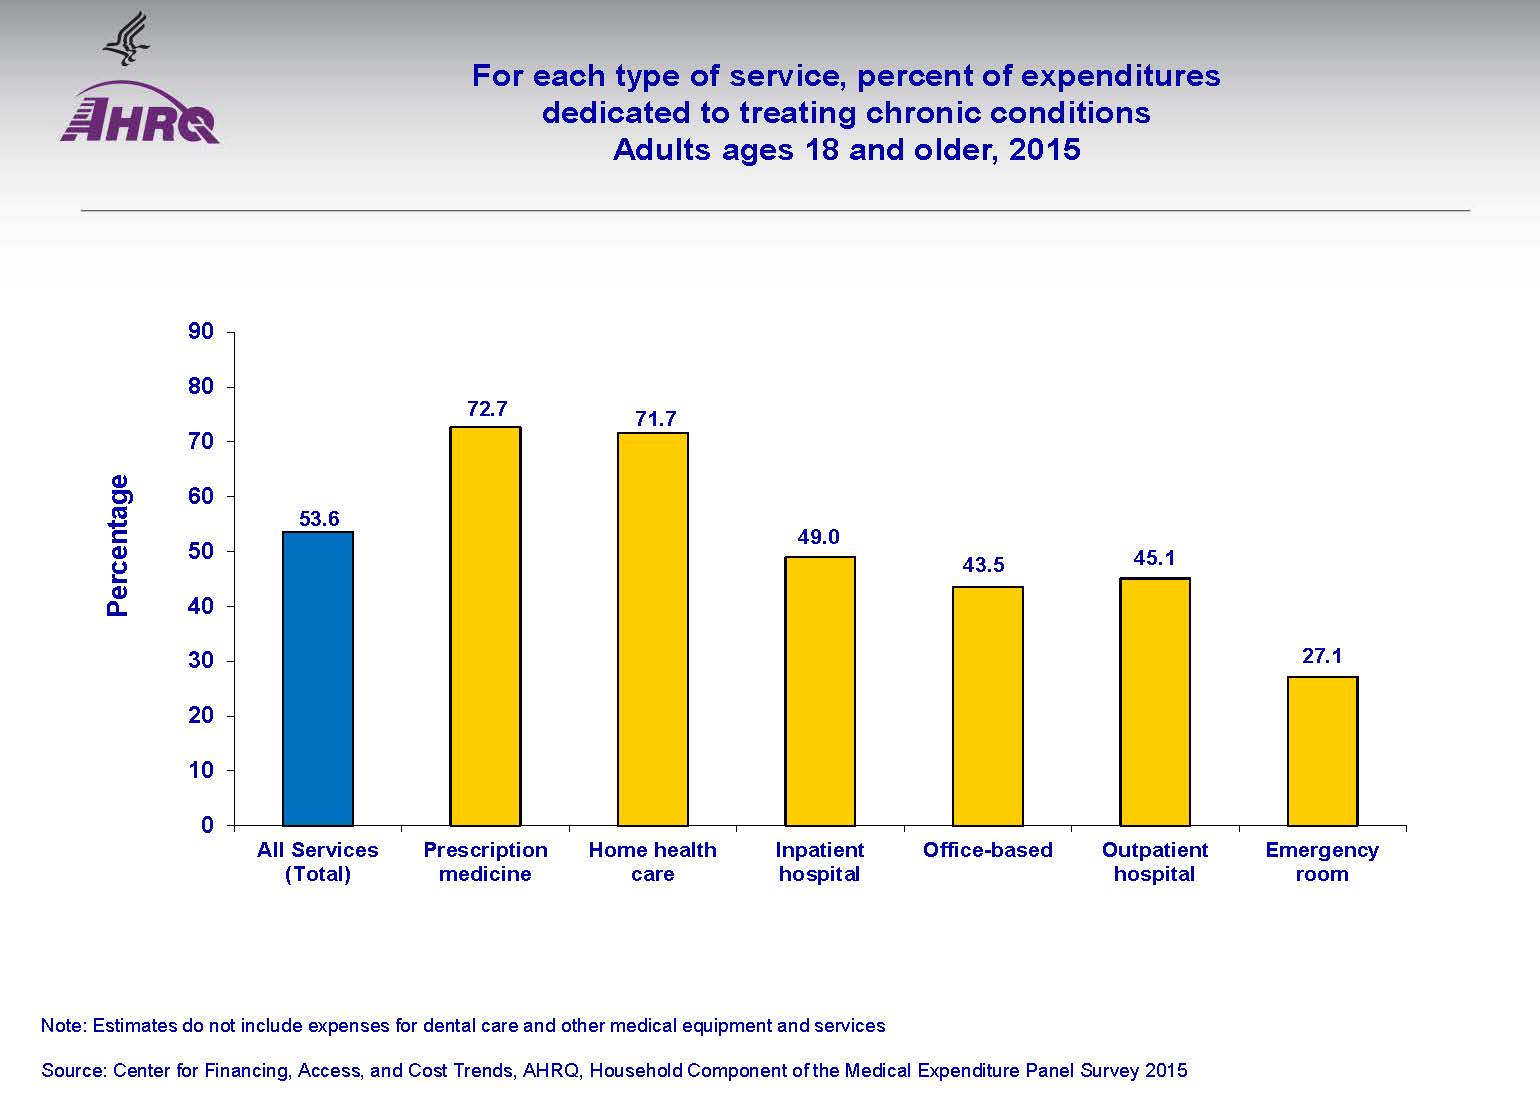
Over half of all money spent on health care for adults is for treating chronic conditions (54%) such as diabetes or asthma.
Almost 75% of all money spent on prescription medicines was for treating chronic conditions.
Almost 3/4 of all money spent on home health care was for treating chronic conditions.
A little more than 1/4 of all money spent on emergency room visits is associated with treating chronic conditions.
18-714.
| File Type | application/vnd.openxmlformats-officedocument.wordprocessingml.document |
| File Title | 2015-6050: At_A_Glance_Charts |
| Author | Anita Haywood |
| File Modified | 0000-00-00 |
| File Created | 2021-01-13 |
© 2026 OMB.report | Privacy Policy