Supplemental Supporting Statement Part B for JARP 2
0140 - Supplemental Supporting Statement B for JARP 04-15-2019.docx
List Sampling Frame Survey
Supplemental Supporting Statement Part B for JARP 2
OMB: 0535-0140
Supporting Statement
June Area Research Project (JARP) Phase 2 – Pilot Study
OMB No. 0535-0140
This substantive change is being submitted as a supplemental supporting statement to the List Sampling Frame Survey.
B. COLLECTION OF INFORMATION EMPLOYING STATISTICAL METHODS
1. Describe (including a numerical estimate) the potential respondent universe and any sampling or other respondent selection method to be used. Data on the number of entities (e.g., establishments, State and local government units, households, or persons) in the universe covered by the collection and in the corresponding sample are to be provided in tabular form for the universe as a whole and for each of the strata in the proposed sample. Indicate expected response rates for the collection as a whole. If the collection has been conducted previously, include the actual response rate achieved during the last collection.
Conducting the June Area Survey (JAS) costs about $7 million per year, which is about four percent of NASS’s overall budget. The JAS is an area-frame-based survey conducted via in-person interviews. NASS is exploring ways to lower the JAS costs by leveraging new statistical methods and technologies.
The June Area Research Project (JARP) pilot study is designed to assess the viability of replacing or reducing the NASS area frame with a web-scraped list frame for the JAS and conducting the survey via telephone, web and mail, thereby reducing or possibly eliminating the expensive in-person enumeration.
The JARP study will be conducted in four states (Kansas (KS), Nebraska (NE), New York (NY) and Pennsylvania (PA)) in the summer of 2019. A parallel design study, also called a parallel group study, will be conducted. The “control” group will be the 2019 JAS sample, which will be drawn and analyzed using current production processes. The “treatment” group will be the sample collected within this pilot study.
In JARP Phase 1, which is being conducted under OMB package [0535-0140], a web-scraped list frame will be developed for each test state. Two states (NE and PA) will use web scraping of national open data sources in the list frame development. The other two states (KS and NY) will use web scraping of both national and state-specific open data sources to develop the list frames. The web-scraped list frames will contain both farms and non-farms. Each list will be matched, using probabilistic record linkage, to the NASS list frame and area frame. The matched records will be the confirmed farms. The records not linking to a NASS list or area frame record are potential farms. A screening survey will be sent to a sample of the potential farms to determine their farm status.
A logistic model of the coverage probability of NASS list frame records will be developed using the records that are on both the NASS and web-scraped list frames and the confirmed farms in the web-scraped sample. The fitted model will be used to estimate coverage probabilities for all records on the NASS list frame. In the final step for JARP Phase 1, the coverage adjustments from the 2019 JAS sample and the fitted model will be compared for selected NASS crop and livestock surveys.
In JARP Phase 2, the treatment group will be the sample drawn from the NASS list frame. A stratified systematic sample will be drawn for each state. The sample design will ensure the most efficient estimates of number of farms and land in farms for each of the test states. The sampling units for the JAS are segments of land about 640 acres. Each segment is divided into tracts of land, which represent unique land operating arrangements. Tracts are classified as agricultural or non-agricultural based on the agricultural activity on the land. The sample size will be restricted to the number of agricultural tracts on the 2018 JAS, adjusted for nonresponse.
The JAS data are collected through in-person interviews. The JARP Phase 2 data will be collected through the web, mail, telephone, and perhaps limited in-person interviews.
The
primary estimates of interest from the JAS are the number of farms
and land in farms (acres) for each state. The estimates of these
values for both the treatment and control groups will be compared to
each other and to the 2017 Census of Agriculture estimates.
From
the 2017 Census of Agriculture, the number of farms and land in farms
for the four test states are shown below.
State |
Number of Farms |
Land in Farms (acres) |
KS |
58,569 |
45,759,319 |
NE |
46,332 |
44,986,821 |
NY |
33,438 |
6,866,171 |
PA |
53,157 |
7,278,668 |
Both the number of farms and land in farms have been declining slowly over time, but the 2017 Census estimates are the most accurate standards available for this study.
The accuracy of the estimates will be compared for the states that had web-scraped list frames developed using only national open data sources (NE, PA) and those that had web-scraped list frames using both national and state-specific open data sources (KS, NY). The question being addressed here is whether the additional costs associated with scraping state-specific open data sources can be justified through improved estimates of coverage, number of farms, and land in farms. Finally the quality of the estimates from speculative states (KS, NE) will be compared to those from non-speculative states (NY, PA). It may be an option to use the traditional JAS in speculative states and the JARP approach in non-speculative.
This is a one-time test of concept. Results may be used for future testing and possible implementation of replacing or supplementing the current JAS. Not collecting this information would reduce NASS’s ability to potentially replace all or part of the JAS with a less burdensome and more cost-efficient data collection strategy.
2. Describe the procedures for the collection of information including:
• statistical methodology for stratification and sample selection,
• estimation procedure,
• degree of accuracy needed for the purpose described in the justification,
• unusual problems requiring specialized sampling procedures
JARP consists of two phases. In Phase 1, a screening questionnaire will be sent to operations that do not link to either the NASS list frame or area frame. The operations confirmed to be farms will provide information on the undercoverage of the NASS list frame. In Phase 2, a sample will be drawn from the NASS list frame. That sample will provide estimates of farms and land in farms.
The Phase 1 screening survey is also being conducted under OMB package 0535-0140, which authorizes NASS list frame-building activities. For a complete picture of the JARP, information on that sample design used for Phase 1 is summarized first before the sample design for Phase 2 is presented.
The sample size for JARP Phase 1 is based on the need for 2,000 to 2,500 responding farms across all four states to adequately adjust for under coverage in the list frame. The following steps were taken to estimate the sample size need for each of the four states:
An estimate of the percentage of operations in the sample that will respond and are a farm (yield). To estimate the percentage of operations that will come back as responding farms, two pieces of information are needed: (1) the response/mail back rate and (2) the percentage of respondents that are farms. The response/mail back rate was estimated using the NACS response rate as a proxy for the JARP Phase 1 response rate. Below are the response rates for the two most recent NACS that response was not required by law.

(Data for the 2015 reference year was collected in 2016 and the data for the 2014 reference year was collected in 2015.)
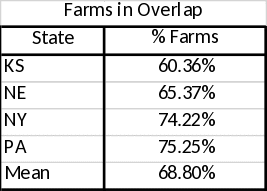
The percentage of respondents that are farms was estimated using the percentage of the web-scraped list frame cases in the overlap with the NASS list frame or area frame that are confirmed farms on the list or area frame. Below are these rates by state:

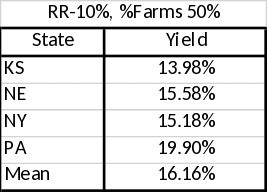
After reviewing these rates, it was determined that these rates were not realistic (too high). So, the percentage of respondents that are farms was set to 50 percent. Additionally, since the last NACS not required by law was conducted in 2016 (referencing 2015 data), the response/mail back rate for JARP Phase I for the yield calculation was estimated by (1) taking the mean of the 2014 and 2015 NACS response rates and by (2) assuming a 10 percent lower response rate. Using both of these numbers, the resulting estimated yields are shown in the table below:

The sample will be allocated to each state proportionally, based on the number of cases on the web-scraped list frame that are not on the NASS list or area frame. Below are the numbers of cases on the web-scraped list frame only as of the morning of March 4, 2019. The list is being further reviewed, and these counts will change.

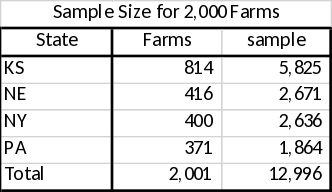
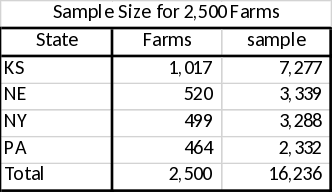
The desired number of farms was calculated for each state for both 2,000 and 2,500 responding farms using the rates from step 2. Next, the desired number of responding farms was expanded to the number of cases that need to be sampled to obtain the required number of responding farms by state. The number of farms responding and the sample sizes by state are shown in the two tables below:


Based on these calculations, a minimum of 13,000 to 16,500 cases will have to be selected for the Phase 1 survey to achieve the desired number of responding farms.
A state-based design will be used. Only potential farms not on either the NASS list frame or the area frame, are eligible for JARP Phase I. This sample will be allocated proportionally based on the number of eligible cases in each state. Within states, a stratified systematic sample design will be used.
The strata will be defined within each state as follows: All active potential farms with incomplete contact information will be in one stratum. The potential farms with complete contact information will be stratified into four strata. These four strata will be defined by (1) crossing an indicator for high predicted probability of being a farm and (2) an indicator for high predicted probability of being a type of operation with lower coverage on the list frame, e.g., a horse farm. Within strata, the systematic sample will be drawn using a serpentine sort. The cases will be sorted using the following sort variables (in this order):
Agricultural district
County
City
Random number
In Phase 2, the primary objective is to evaluate whether self-response and phone enumeration can be used to collect the information that is collected only on the JAS, mainly land in farms and number of farms. Because of this, the Phase 2 sample size was calculated by using the number of agricultural tracts by state in the 2018 JAS adjusted for the expected usable rate. The usable rate was estimated using the mean of the usable rates of the 2017 and 2018 Agricultural Production Survey (APS) (OMB 0535-0213) in each state. This should provide approximately the same number of usable farms from Phase 2 as agricultural tracts in the JAS for each state. See table below for the sample sizes by state.
State |
Sample Size |
KS |
3,413 |
NE |
2,987 |
NY |
640 |
PA |
960 |
Total |
8,000 |
The sample design for Phase 2 is as follows:
State based design
Stratified Systematic sample within states
Strata defined by Total Value of Sales crossed with an indicator of whether a record was in the set of records on both the NASS list frame and the web-scraped list (the overlap indicator) (see table below for strata definitions)
Sorted by farm type within strata
Sample will be allocated within state to minimize the sampling variance on land in farms and number of farms
Strata |
Strata Description |
|
Overlap |
Farm Category |
|
01 |
Yes |
Nonstandard farms |
05 |
No |
Nonstandard Farms |
10 |
Yes |
Total Value of Sales $1,000-$9,999 |
15 |
No |
Total Value of Sales $1,000-$9,999 |
20 |
Yes |
Total Value of Sales $10,000-$49,999 |
25 |
No |
Total Value of Sales $10,000-$49,999 |
30 |
Yes |
Total Value of Sales $50,000-$99,999 |
35 |
No |
Total Value of Sales $50,000-$99,999 |
40 |
Yes |
Total Value of Sales $100,000-$249,999 |
45 |
No |
Total Value of Sales $100,000-$249,999 |
50 |
Yes |
Total Value of Sales $250,000-$499,999 |
55 |
No |
Total Value of Sales $250,000-$499,999 |
60 |
Yes |
Total Value of Sales $500,000-$999,999 |
65 |
No |
Total Value of Sales $500,000-$999,999 |
70 |
Yes |
Total Value of Sales $1,000,000-$249,999 |
75 |
No |
Total Value of Sales $1,000,000-$249,999 |
80 |
Yes |
Total Value of Sales 5,000,000+ |
85 |
No |
Total Value of Sales 5,000,000+ |
The probability of a record being on the NASS list frame will be estimated using the confirmed farms identified through the screening survey in Phase 1 and the farms on both the NASS list frame and the web-scraped list frame. A weighted logistic regression will be conducted to account for the sample inclusion probabilities of the confirmed farms. Potential covariates are those in both the control data on the NASS list frame (for records on both frames) and the screening survey information (for records on only the web-scraped list). As primary characteristics of interest, total value of sales and farm type will be forced into the model; other covariates will be identified through stepwise selection, or a similar variable selection approach.
The fitted model will be used to estimate the coverage probability of all records from the four pilot states on the NASS list frame. This information will be used throughout the year to estimate coverage for NASS list-based surveys.
The sampling weights of the respondents in Phase 2 will be adjusted for undercoverage and nonresponse. The coverage adjustment will be obtained in Phase 1, and the nonresponse adjustment will be based on categories of respondents with similar probabilities of responding. Measures of uncertainty will be obtained using a group jackknife approach.
3. Describe methods to maximize response rates and to deal with issues of non-response. The accuracy and reliability of information collected must be shown to be adequate for intended uses. For collections based on sampling a special justification must be provided for any collection that will not yield "reliable" data that can be generalized to the universe studied.
Phase 2 Data Collection: A cover letter and questionnaire will be mailed to the NASS list frame sample. The letter explains the purpose of data collection. Included with the cover letter, operations are also given the opportunity to respond online. They are provided a link to a website along with a personalized, secure key code that will allow them to access only their questionnaire and provide their information in a secure manner.
Non-respondents (mail or internet) will be contacted by telephone. Telephone data collection is done primarily through a Data Collection Center using a computer-assisted telephone interviewing (CATI) instrument which automatically displays forms and manages call-backs and appointments for the enumerators. Those operations expected to have a large value of sales or have multiple operations are typically assigned to enumerators for personal visits.
Estimates will be generated for farms and number of farms for the four test states: KS, NE, NY and PA. Official estimates will not be published for this test. Data are for internal evaluation of the viability of this approach. Analysis of this test will be provided to the public through research evaluations.
The sample is designed to have a sample size that should yield the number of usable reports equal to the number of agricultural tracts in the 2018 JAS (the number for 2019 is unknown). For each state, the JAS and JARP estimates of the number of farms and land in farms will be compared to each other and to the 2017 Census of Agriculture estimates.
Survey data are subject to non-sampling errors such as omissions and mistakes in reporting and in processing the data. While these errors are not measured directly, they are minimized by NASS staff reviewing all reported data for consistency and reasonableness through an Interactive Data Analysis System (IDAS).
4. Describe any tests of procedures or methods to be undertaken.
The JARP pilot study should allow NASS to evaluate three primary questions. First, can a web-scraped list frame be used to measure undercoverage on the NASS list frame? Second, can information on farms and land in farms be obtained through a questionnaire that relies on web, mail, and telephone responses? And, third, what additional information is gained by scraping national and state-specific open data sources (KS and NY) compared to scraping only national open data sources (NE and PA)? Further, does the response to this last question depend on whether the state is a speculative state (KS and NE) or a non-speculative state (NY and PA)?
In Phase 1, coverage adjustments will be estimated for all NASS list frame records. The difference in the coverage adjustment from Phase 1 and that from using the JAS will be compared for key surveys. The selection of these surveys will be made after consultation with NASS’ Statistics Division. Both crop and livestock surveys will be included. Of special interest will be those surveys for which the number of farms in the target population on the JAS is small.
In Phase 2, for each state, the estimates of farms and land in farms from the JAS and the JARP will be compared to each other and the 2017 Census of Agriculture estimates. The measures of uncertainty will also be compared.
The quality of both the estimated coverage adjustments and the estimates of farms and land in farms will be compared between states that had open data source scraping only at the national level and those that had scraping of both national and state-specific open data source scraping. Whether these results depend on whether or not the state is in a speculative region will also be considered.
5. Provide the name and telephone number of individuals consulted on statistical aspects of the design and the name of the agency unit, contractor(s), or other person(s) who will actually collect and/or analyze the information for the agency.
Linda J. Young, Chief Mathematical Statistician and Director of the Research and Development Division (202-690-0027; [email protected]) will be the lead contact on the project. Denise Abreu, Research and Development Division Deputy Director for Management and Budget (202-720-4503; [email protected]) will be the co-lead.
The development of the web-scraped list frame is led by Shane Ball, Section Head of the Survey Methodology and Technology Section, Research and Development Division, (202)836-0573.
The survey design and sample size for each State are determined by the Sampling, Editing, and Imputation Methodology Branch, Methodology Division; Branch Chief is Mark Apodaca, (202)720-5805 with input from Benjamin Reist, Research and Develop Division Deputy Director for Science and Planning.
The summary and analysis will be completed by the Research and Development Division under the direction of Linda Young and Denise Abreu.
Data collection is carried out by web, mail, and the NASS Data Collection Centers. The Branch Chief of the Survey Administration Branch in the Census and Survey Division is Gerald Tillman, (202) 720-3918.
The NASS survey statistician in charge of the June Area Research Project Pilot Census and Survey Division Technical Lead Robin Gannon, (202) 308-4350. She is responsible for coordination of sampling, questionnaires, data collection, training, Interviewers Manual, Survey Administration Manual, data processing, and other Field Office support. The Director of the Census and Survey Division is Barbara Rater, (202)720-4557.
| File Type | application/vnd.openxmlformats-officedocument.wordprocessingml.document |
| File Title | Supporting Statement |
| Author | HancDa |
| File Modified | 0000-00-00 |
| File Created | 2021-01-12 |
© 2026 OMB.report | Privacy Policy