Excel Tool for Current Grantees
Evaluation of Promise Neighborhoods
Appendix C. PN Excel Workbook Current Grantees 9 27 2021.xlsx
Grantee Survey, District Administrative Records Request
OMB: 1850-0965
Document [xlsx]
Download: xlsx | pdf
Main Workbook
Counts for survey
Overview
InstructionsMain Workbook
Counts for survey
Sheet 1: Instructions
| INSTRUCTIONS | 
|
|||||||||
| The Main Workbook tab of this Excel file is meant to capture all of the programs your Promise Neighborhood has provided, or is currently providing, during the grant period for the grant you received in Fiscal Year 2016, Fiscal Year 2017, or Fiscal Year 2018. We suggest that you start to complete this Excel workbook before the Word survey, as it will help you answer questions in the survey. | ||||||||||
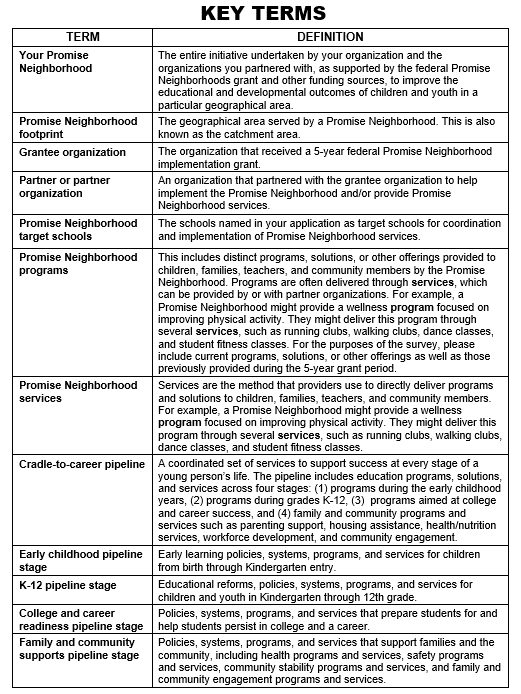
| Each program should be recorded on a separate row on the "Main Workbook" tab. Then please answer the questions in each column about the services offered under each program. As shown in the Key Terms box, "programs" include the distinct programs, solutions, or other offerings provided to children, families, teachers, and community members by the Promise Neighborhood. Programs are often delivered through services and can be provided by or with partner organizations. For the purposes of the survey, please include programs, solutions, or other offerings provided during the 5-year grant period. | ||||||||||
| The study team worked to pre-populate some rows and columns of the Main Workbook tab using existing data sources. We ask that you review the prepopulated information and update it as necessary. Then you can fill in the remaining columns for each program (and related services) by inputting an answer or using the drop-down options in each cell. | ||||||||||
| Please add rows and information for any additional programs provided by your Promise Neighborhood during the grant period that are not already pre-populated in the sheet. | ||||||||||
| After you fill in all of the columns for each program, you can review a summary of the data you entered in the “counts for survey” tab of the spreadsheet. You can refer to these counts when answering questions in section A of the survey. | ||||||||||
| When you are finished reviewing and filling in the spreadsheet, please email it back to Mathematica. | ||||||||||
Sheet 2: Main Workbook
| Promise Neighborhood Program | Description of services offered through the program (Please enter a brief description of the services recipients receive) |
Total number of unique recipients served (Provide number of recipients and specify if recipients are children, students, parents, families, or teachers. Your best estimate is fine; if you are unable to provide an estimate, enter DK) |
Pipeline Stage 1 (Please select a stage from the dropdown menu) |
Pipeline Stage 2 (If a second pipeline stage applies, please select it from the dropdown menu, otherwise you can leave this column blank) |
Type of service provider (Use the dropdown menu to classify the primary type of service provider.) |
Need(s) addressed (Need #1) (Please select the primary need addressed from the dropdown menu)- A full list of needs can be seen on the Counts for Survey Tab, in column F |
Need(s) addressed (Need #2) (If the services address a 2nd need, please select it from the dropdown menu. Otherwise you can leave this column blank) |
Need(s) addressed (Need #3) (If the services address a 3rd need, please select it from the dropdown menu. Otherwise you can leave this column blank) |
New Services: Compared to the 3 years before the grant was received, were the services added as new services during the grant period? |
Expanded Services: Compared to the 3 years before the grant was received, were the services expanded to serve more recipients during the grant period? |
Improved Services: Compared to the 3 years before the grant was received, were the services improved during the grant period? |
Sheet 3: Counts for survey
| Total number of programs- Survey Question A1 | Number of programs by pipeline stage (Might be helpful when answering Survey Question A3) |
Count | Full list of need(s) addressed by services | ||
| 0 | Early Childhood | 0 | Improved academic skills | ||
| K-12 education | 0 | Improved kindergarten readiness | |||
| College and career readiness | 0 | Improved student attendance | |||
| Family and community supports | 0 | Improved high school graduation rates | |||
| Improved college enrollment, graduation, and vocational certification rates | |||||
| Improved school climate and safety | |||||
| Improved student access to internet and a connected computing device | |||||
| Improved employment, earnings, and income | |||||
| Improved availability of affordable housing | |||||
| Improved mental health | |||||
| Increased fruit and vegetable consumption | |||||
| Increased physical activity levels | |||||
| Increased child participation in early learning settings or programs | |||||
| Increased use of non-emergency medical facilities for young children | |||||
| More parents and families who read to or encourage children to read | |||||
| More parent/family discussion about importance of college and career | |||||
| Reductions in student mobility (entries and withdrawals from school) | |||||
| Reductions in juvenile delinquency, conviction, or incarceration | |||||
| Reductions in teen pregnancy | |||||
| Reductions in neonatal and maternal deaths | |||||
| Other |
| File Type | application/vnd.openxmlformats-officedocument.spreadsheetml.sheet |
| File Modified | 0000-00-00 |
| File Created | 0000-00-00 |
© 2026 OMB.report | Privacy Policy