Justification for Non-substantive Change
CPSC_SCOA Survey_Incentive and Door Knocking Sampling 09 17 19 Maps Revised.docx
Survey on Usage and Functionality of Smoke Alarms and Carbon Monoxide Alarms (SCOA) in US Households
Justification for Non-substantive Change
OMB: 3041-0180

Introduction
The following memo outlines a revised SCOA survey sampling approach to increase response rate for the survey. CPSC’s survey vendor, EurekaFacts, has been administering the SCOA survey since January 2019. For the last 8 months, EurekaFacts had significant difficulty recruiting participants for the in-home portion of the SCOA survey, which is directly impacting the schedule. To improve data collection efforts and to finish this project within the timeframe of the contract and ahead of the March 1, 2020 start of the Census collection period, we request approval from OMB to increase the incentive value and a modified methodology for stage 3 sampling.
The following memo outlines two proposals to the revised SCOA survey; increase incentive and modified sampling approach:
Increase the incentive from $25 to $50
A change in methodology for stage 3 sampling of occupied housing units to accommodate a door-to-door recruitment campaign.
Background
CPSC’s survey vendor, EurekaFacts, has been administering the SCOA survey since January 2019. For the last 8 months, EurekaFacts has had significant difficulty recruiting participants for the in-home portion of the SCOA survey, which is directly impacting the schedule. To improve data collection efforts and to finish this project within the timeframe of the contract, we request approval from OMB to pilot a Door-to-Door methodology. Justification for this change provided below.
Survey Recruitment Efforts and the Challenges Encountered
Using the OMB approved methodology an initial round of sampling and recruitment yielded a response rate of less than one quarter of 1% (<0.25%). OMB approved revisions were made to the screening instrument to raise the appeal, urgency and information on the public benefit of the study, along with streamlining of language for greater efficiency in screening potential participants. Following these revisions to the recruitment efforts and their implementation, the response rate results are unchanged and are inadequate in meeting the schedule and the current contract with CPSC. The current cooperation rate to schedule participants for in the in-home survey equals 0.23% (or less than one-quarter of 1%) for the two combined primary sampling units where the survey has fielded.
Here is a summary of the vendor’s recruitment efforts: From Jan. 1-May 31, 2019, EurekaFacts recruited respondents by phone using an ABS of households to participate in the SCOA survey. Data collection efforts focused on primary sampling units in Charlotte and New Bern, NC. A sample of 23,702 calls have been made in the Charlotte and New Bern metro area, which approximately 60% of households had working phone numbers, the response rate success was 0.23% percent for the in-home survey.
Modified Incentive
EurekaFacts respectfully requests to increase the incentive from $25 to $50. This increase in incentive would be implemented during the Modified Sampling Methodology (as explained below) to determine if it will sufficiently improve the cooperation rate to meet the objectives of the survey within the established timeframe. At the end of a one metro area recruitment campaign that will serve to verify the efficacy of these changes, the cooperation rate will be analyzed and presented to OMB with the results.
Modified Stage 3 Sampling Methodology
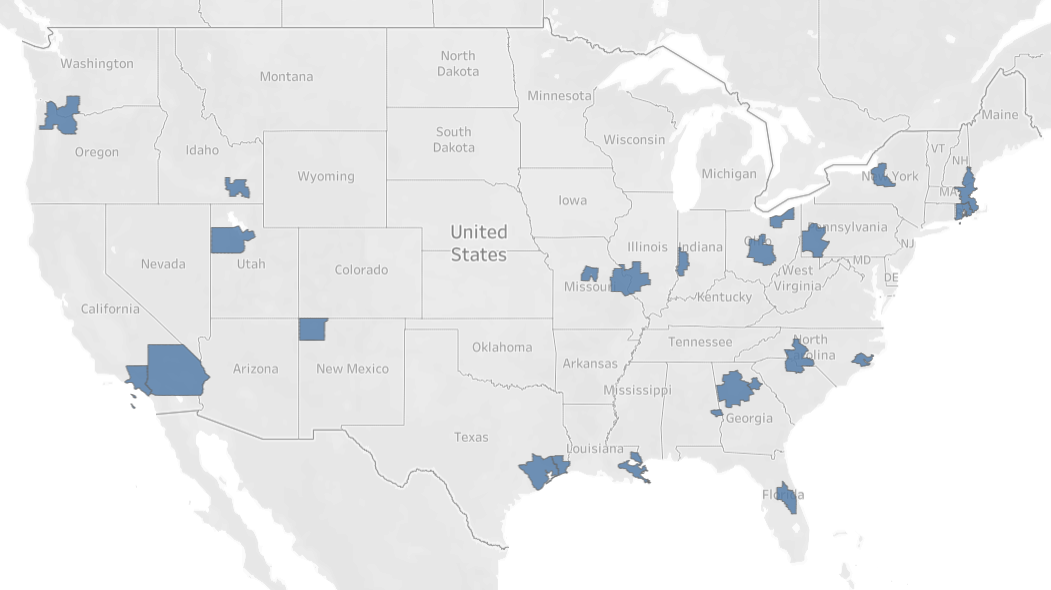
Sampling Stage 1: Selection of Primary Sampling Units (PSUs) from the sampling frame of metro areas
For
the SCOA survey’s first stage of sampling, we selected 24 PSUs
from all U.S. metropolitan statistical areas. For reference, the
final stage 1 PSU sample is available here
or see Appendix
1.
(https://public.tableau.com/profile/eurekafacts.com#!/vizhome/SCOASurvey-PrimarySamplingUnits/SCOASurvey-PrimarySamplingUnits)
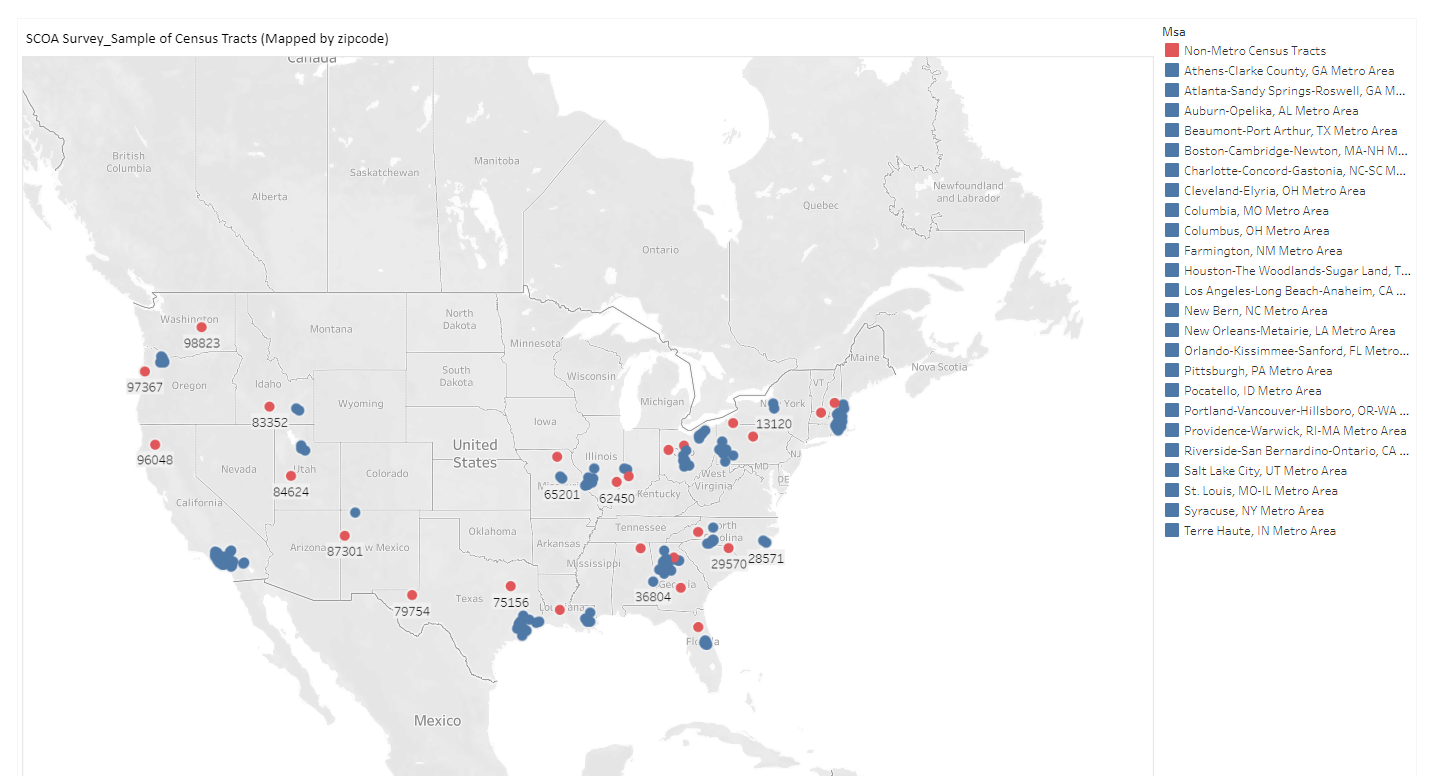
Sampling Stage 2: Selection of Secondary Sampling Units (SSUs) from the sampling frame of U.S. Census tracts
For
the survey’s second stage of sampling, we selected Census
tracts within PSUs in proportion to the number of occupied housing
units (OHUs) within a given PSU and to maintain methodological
consistency between stages 1 and 2. For reference, the final Census
tracts chosen and mapped to its approximate zip code is available
here
or see Appendix 2.
(https://public.tableau.com/profile/eurekafacts.com#!/vizhome/SCOASurvey_SampleofCensusTractsMappedbyzipcode/Sheet1)
Sampling Stage 3: Selection of occupied housing units for each Census tract
As a pilot for this sampling strategy, the Washington D.C. metro area will be used. The selection of the DC Metro area presents the following advantages for successful completion of data collection. The vendor (EurekaFacts) will have close monitoring oversight of data collection teams and the participant response rate with this local door-knocking campaign that allows for efficient use of resources and budget. To accomplish this, a random metro area of comparable size (with a comparable quota for completed interviews) will be replaced by the Washington D.C. metro area using the current sample of 24 PSUs approved by CPSC. This substitution will consider demographic and geographic similarities between the metro areas when making the replacement. All other PSUs will remain the same. If successful, statistical findings and diagnostics with and without the Washington, DC metro area will be reported, with caveats detailing the assignment of Washington as the pilot PSU.
To maintain consistency between sampling methods, all households within the census tract will be a part of the sampling frame. The method to randomly select which homes are visited during the door-knocking campaign is as follows:
List all households in a census tract in an Excel spreadsheet
Randomly assign each a number value
Sort the households by randomly assigned number
Calibrate the expected response rate to the quota needed within the tract to determine the number of homes that may need to be visited
For example, a tract with a quota of 3 completes and an expected 1% response rate means selecting the first 300 homes in the Excel sheet after it has been randomly sorted
Map the selected homes to predetermine walking route in a tract
Randomly assign one household as the starting point and walk clockwise
Piloting the door-to-door knocking in the Washington DC metro area allows for careful monitoring of the procedures and quick adjustments to be made. This will allow for a refined process to be applied to metro areas across the country.
A review of the response rate from the pilot area will be analyzed to determine if it would be feasible to launch the Increased Incentive and Door-to-Door before launching to the other PSUs in the survey study. At the end of the end of the time period, the cooperation rate will be analyzed and presented to OMB with the results.
Tentative Timeline for Washington DC Metro Area Data Collection
Task |
Estimates Timeframe |
Logistics/Staffing/Training |
Week 1 |
Awareness/Outreach Campaign |
Week 2-3 |
Implement Sampling Strategy |
Week 3 |
Field Data Collection/Monitoring |
Week 4-6 |
Data Analysis |
Week 7 |
Diagnostic Reporting |
Week 8 |
Submit Report to CPCS for Review |
End of Week 8 |
Appendix 1: Map SCOA Survey of Primary Sampling Units (PSUs)

Appendix 2: Map SCOA Survey of Secondary Sampling Units (SSUs)

| File Type | application/vnd.openxmlformats-officedocument.wordprocessingml.document |
| Author | Garry Curtis |
| File Modified | 0000-00-00 |
| File Created | 2021-11-04 |
© 2026 OMB.report | Privacy Policy