Water Quality Benefits
Focus Groups As Used By EPA For Economics Projects (Renewal)
2205.19 Water Quality Benefits Generic Survey
Water Quality Benefits
OMB: 2090-0028
2205.19, 2090-0028
FOCUS GROUP GUIDE
WATER QUALITY BENEFITS STATED PREFERENCE SURVEY
Overview
The purpose of the focus groups is to develop a stated preference survey to generate data for nonmarket valuation of water quality improvements. The broad objective of the study is to provide benefit estimates for water quality improvements at the local, regional, and national level. Factors that may affect household benefits include the amount of water affected by the improvements, the size of the improvements, baseline conditions, and the availability of substitute waterbodies. Early focus groups will involve discussion on participants’ visits to waterbodies, perceptions of water quality, and familiarity with well-known and culturally important waterbodies. The moderator will guide the conversation as needed, by asking questions regarding specific topics of interest. Data from early focus groups will be used to create information treatments and draft questions for later focus groups. In early focus groups, the discussion will largely focus on topics such as:
Participants’ perceptions and ability to discern the geographic location of waterbodies, their residence, and various geographic areas, including: buffers around their home, location and boundaries of different HUC-level watersheds1, political jurisdictions (e.g., states), etc.
Perceptions and preferences towards key characteristics of waterbodies, such as: cultural significance, waterbody type, and quantity within a given area (e.g., number of waterbodies, miles of shoreline, surface area)
Perceptions and preferences towards alternative measures and attributes defining water quality
We have provided a draft script for the initial focus groups below, including preliminary maps and draft questions.
Several elements of the survey design, including but not limited to visual aids, information text, and valuation questions will be tested in later focus groups. In addition, we plan to test various response formats (e.g., dichotomous choice, discrete choice experiment, and contingent ranking), selecting that which will provide more reliable responses. Given the complexities of our scenario and the number of outcomes of interest, we anticipate that our efforts will result in a stated choice or contingent ranking format. However, as with the other design elements, we will rely on information collected in early focus groups to guide the development of the survey instrument.
As we conduct more focus groups we will eventually converge on a complete survey instrument that can be tested in final focus groups and cognitive interviews.
Focus Group Participants
The purpose of the stated preference survey is to estimate average household willingness to pay for water quality improvements. As such, the target sample will be representative of the U.S. population. In order to develop a survey that is accessible and salient to as many recruited households as possible we seek to recruit focus group profiles that are also representative of the adult U.S. population in as many respects possible.
Focus Group Script
Introduction
Thank you for participating…moderator and observer (if there is one in the room) introduce themselves
The session should last about 2 hours
This discussion is strictly confidential, and there will be no follow-up contacts after this discussion
Introduce focus group participants: State your first name and town where you live and how long you’ve lived in the area.
Purpose of focus group is to gather information on your thoughts and experiences with bodies of water like lakes, rivers, bays and estuaries, and coastal waters. [Avoid mentioning water quality and pollution this early because we want information on perceptions of water bodies more generally and do not want to inadvertently provoke emotional responses from some people.]
The objective is to help researchers develop a survey to gather people’s honest views, so please be open and frank with us. There are no “wrong” answers and there is no particular answer from you that we are looking for, so we will not be offended by any views that you express here.
Ground rules
We want to follow basic guidelines for polite conversation
We want to hear from everyone, so please participate
Take turns speaking
We may hear a wide range of views expressed here and we want to encourage this, so please be polite if you disagree with someone
We will be recording the session so we have an accurate record of what you say [again emphasize confidentiality]
Initial Conversation Prompts
Consider the time you spend participating in outdoor recreation and water-based activities. This could be time spent at/on a lake, pond, river, stream, or bay. What are some of the activities you commonly engage in?
Do you visit one type of waterbody more than another? (can probe about waterbody size here)
Is the main purpose of some or all of these outings visiting particular water bodies, engaging in specific activities (ex: can only surf in the ocean), or are there other primary purposes (visiting family for example)?
If you travel to reach your location for outdoor and water-based recreation how far do you typically travel on such trips and how often?
(if many participants answered #3 with long travel distances then ask this question) Do you ever take shorter local trips?
What about occasional trips to farther waterbodies? If so, what kinds of waterbodies do you visit? What is different about these waterbodies that make you travel greater distances?
What other factors affect your experiences when you visit waterbodies?
When I say one lake has “cleaner” water than another, what differences do you imagine between the two?
Considering the expense of making these trips (gas, food, time, etc.), would you be likely to take more trips if the water was cleaner? Would you travel farther to visit cleaner waterbodies?
What characteristics of clean water do you look for or matter to you? Clarity, color, smell, healthy wildlife and aquatic species populations, whether it is safe for certain uses, other?
(Ask about well-known waterbodies that are far away.) Who here has heard of Lake Tahoe? Has anyone ever been there? (Now, speaking to the ones that haven’t) What do you know about it?
Can everyone think of a well-known waterbody that they have never been to? (Have some suggestions on hand if people struggle.) Why is it well-known? What makes it special?
Who here has heard of Antelope Lake in North Dakota? (Presumably no one. Follow with description of Antelope Lake.) What characteristics make Lake Tahoe well-known but not this lake?
Water Quality Metrics
Our survey will ask people about changes in the quality and cleanliness of rivers, lakes, and coastal waters. What are some ways we can describe different levels of water quality and cleanliness on our survey?
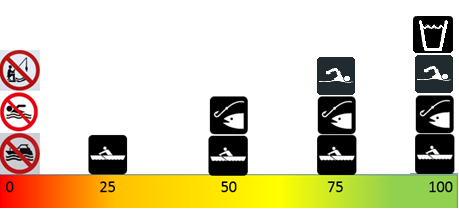
One measure that is used to describe water quality is what things people can do safely in a particular body of water. For example, is it safe to swim in? Are there risks with eating the fish caught out of that water? Here is a scale that uses a score from 0-100 and showing which activities are safe at what values. (Get participants’ reactions to graphic.)

Are there any features of water quality that matter to you that are not represented in the scale above?
Do you interpret this water quality scale as providing firm cutoff points between what is okay versus not okay, or do you see it more as a continuum?
Draft Watershed Maps
Please imagine the maps you are about to see were parts of a survey you received in the mail or were asked to take online.
The moderator will show several maps depicting watershed regions, the amount of water resources available, and the quality of surface water to the participants to gauge how well the maps convey that information. See example maps and accompanying descriptions following script.
What are your first reactions to these maps?
Is the description of the watershed regions easy to understand?
Is it difficult to tell which parts of the country have a lot of lakes and rivers?
According to the maps, what parts of the country have poor water quality?
What might the researchers consider to make the materials easier to understand?
What do you think of the maps? Was it easy to find familiar areas? Do you have any suggestions for changes to the maps?
Which geographic representation was easier to understand but also presented the most useful information, the 21 watershed regions or the 202 subregions?
Would other geographic representations make more sense to you? (If needed, probe into States, circular buffers, etc.)
Follow Up Questions
Please think about waterbodies (rivers, streams, lakes, estuaries) you think are nationally recognizable. Can you name a few?
What characteristics do you think these waters have in common? What makes some waterbodies more recognizable than others?
(Pass out a list of the largest waterbodies in the US by shoreline miles and area.) Please circle which ones you have heard of.
Present comparison maps with potential iconic waters labeled on some and not on others. Ask for feedback.
Example Maps
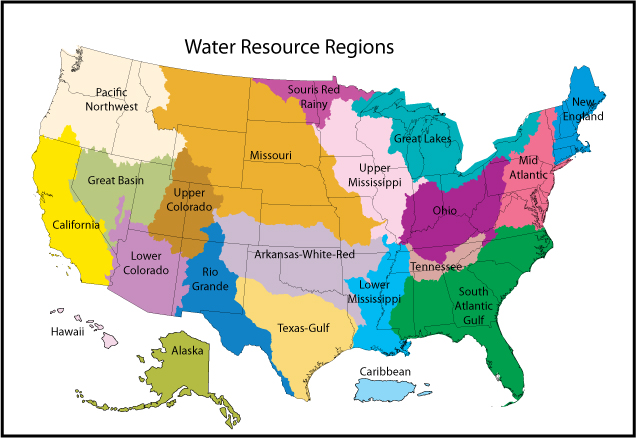
The entire country can be divided into regions called “watersheds” based on the natural flows of water. For example, the map below shows 21 watershed regions across the country. Water that lands anywhere within one of these regions eventually drains into the corresponding lakes, rivers, or coastal waters within the region.

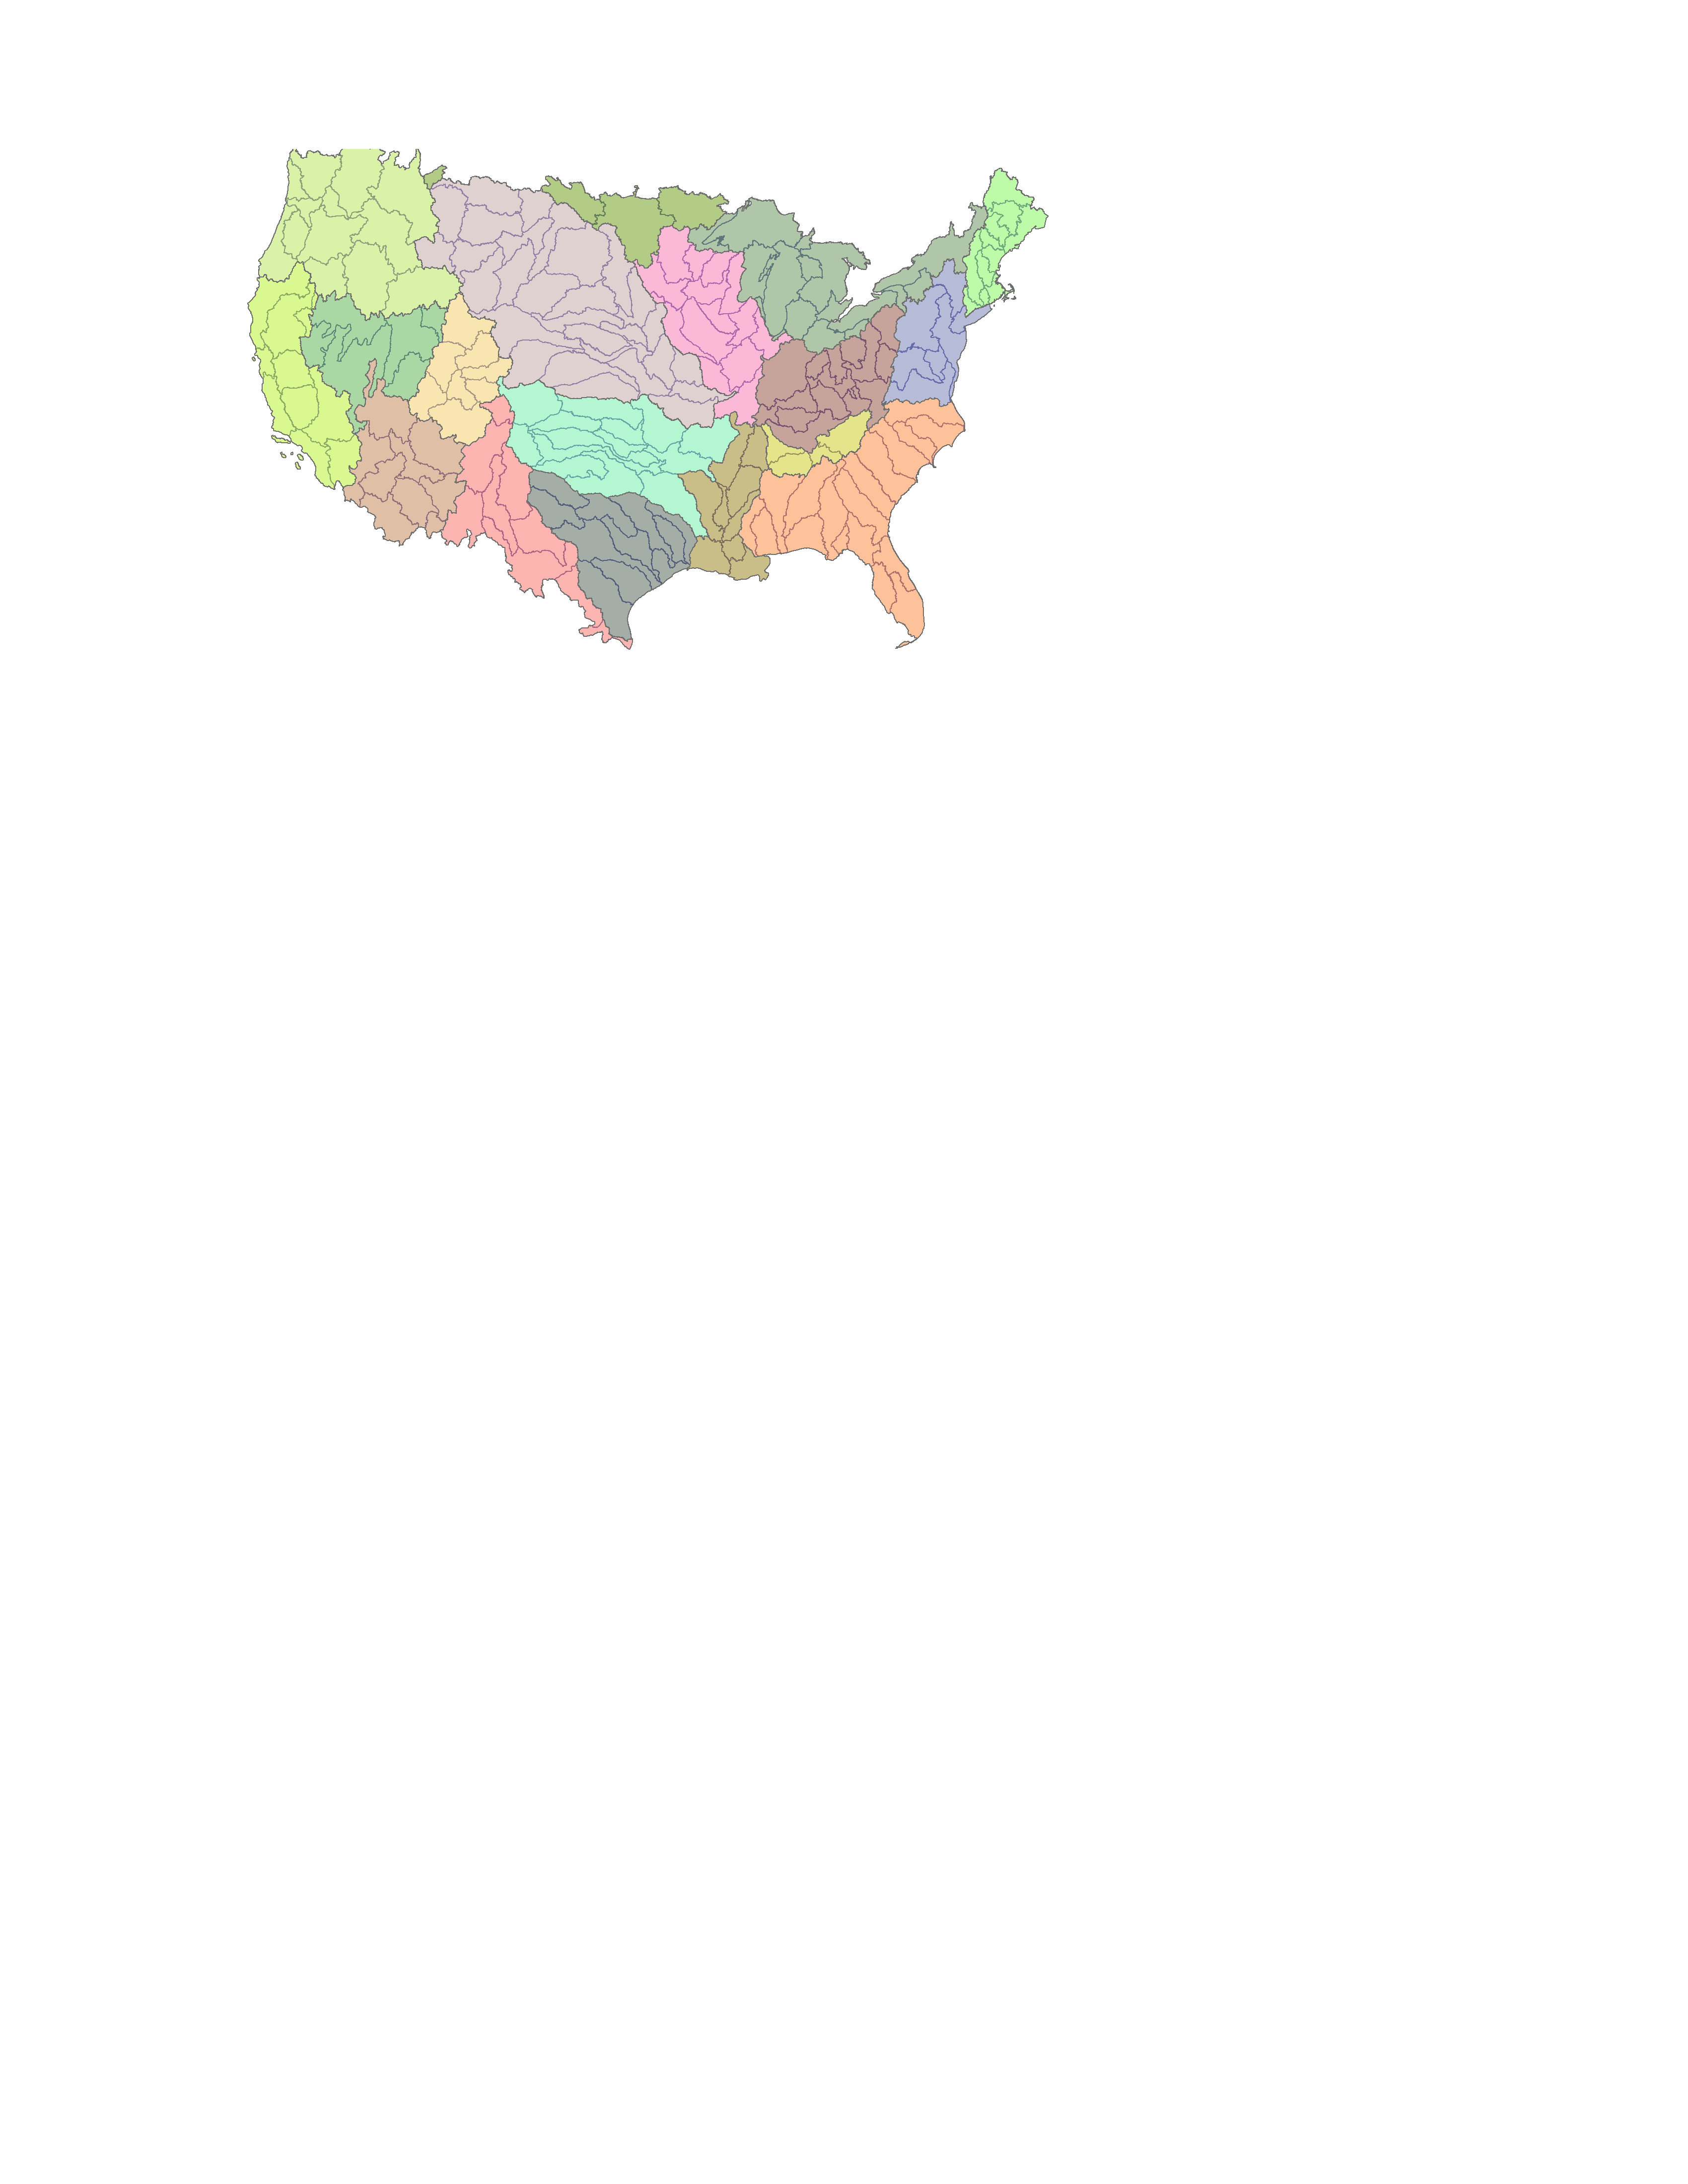
These watershed regions can be further divided into 202 watershed sub-regions, as shown in the map below. Where the waters within each sub-region flow into a smaller waterbody, which then flows into larger ones within the watershed region.

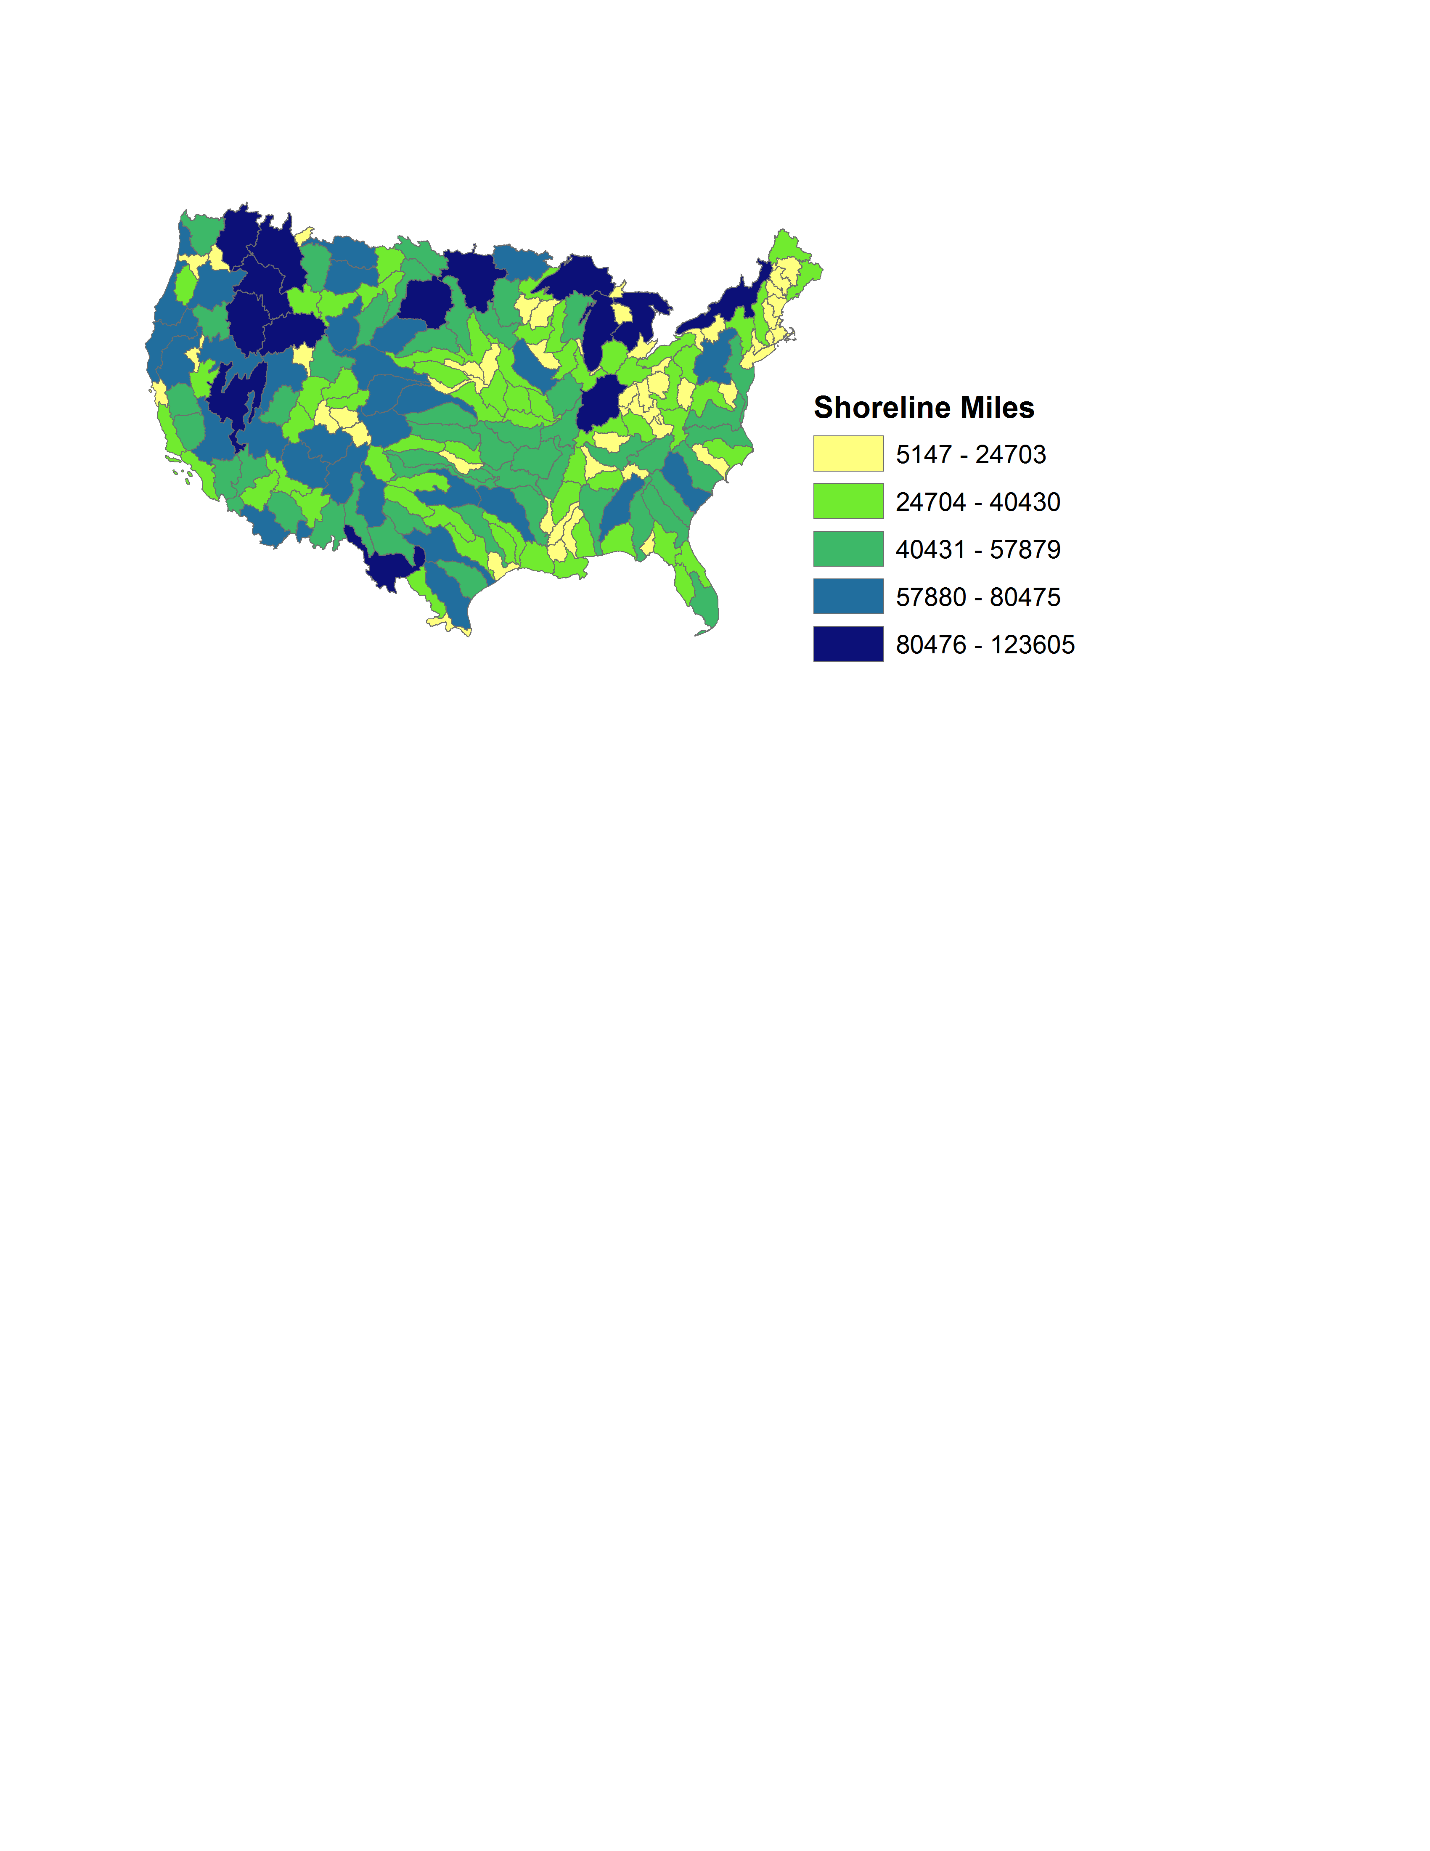
The type, size, and number of waterbodies within each sub-region vary considerably across the country, ranging from the arid regions in the Midwest to the freshwater lakes in the Northeast, and across the estuaries and coastal waters along the East, West, and Gulf Coasts. The map below shows the total number of shoreline miles in each sub-region, considering all lakes, streams, and estuaries.

Water quality across these sub-regions can vary due to several different reasons, including natural features of the weather, waters, and soils, but also due to human caused alterations to waterways and pollution.
The map below shows the average water quality score for each sub-region. Currently 20% of stream miles nationwide have a score of at least 95, which means the water is clean enough to drink (so 80% is not drinkable), 50% has a score of at least 75, which means the water is clean enough to swim in (so 50% is not swimmable), 75% has a score of at least 50, which means the water is fishable (so 25% is not fishable), and 90% has a score of at least 25, which means the water is boatable (so 10% is not boatable).

1 HUC stands for Hydrological Unit Code, which is a hierarchal classification system dividing and subdividing US lands into successively smaller hydrological units or watersheds (USGS, http://water.usgs.gov/GIS/huc.html, accessed 5/6/2016).
| File Type | application/vnd.openxmlformats-officedocument.wordprocessingml.document |
| Author | Chris |
| File Modified | 0000-00-00 |
| File Created | 2022-01-27 |
© 2026 OMB.report | Privacy Policy