Citizen Science Chart Update
Nautical Discrepancy and Data Reporting System
Citizen Science Chart Update Template 2020-0423
Citizen Science Discrepancy Reports
OMB: 0648-0007
OMB Control # 0648-0007
Expiration Date: xx/xx/20xx
Instructions
Individuals or groups should first notify OCS that they would like to participate in the 2019 Chart update Project. This can be done by sending an email to [email protected].
Reports should be submitted in a Microsoft (MS) Word format (.doc or .docx) using this template.
The report file should be named ENC#_YYYY_Name, where:
ENC#: ENC Cell Name (e.g. US5NY52M)
YYYY: Year (e.g. 2019)
Name: Individual or group name (e.g. USPSDistrict3)
Reports should be submitted through email at [email protected].
When possible, include all images and graphics should be embedded within the report. Graphics that cannot be embedded within the Word document can be submitted as separate files.
When possible, use Degrees/Minutes/Seconds (DDD/MM/SS) for latitude and longitude. If you have recorded a GPS position, use seconds to the hundredths (SS.SS). Otherwise, reporting to the nearest second is acceptable.
Only submit updates for NOAA Electronic Navigational Charts (ENCs). Updates submitted for NOAA Raster Charts will not be evaluated.
Special attention should be given to Section C. – Critical Chart Issues. This is the most important part of the report as it details issues that may be a hazard to navigation.
If a critical danger to navigation is found any time during the year, local reporting units should submit these items immediately through ASSIST.
The report may be assembled and submitted anytime during the boating season. Target dates for submission are no later than October 1, 2020.
A Federal agency may not conduct or sponsor, and a person is not required to respond to, nor shall a person be subject to a penalty for failure to comply with an information collection subject to the requirements of the Paperwork Reduction Act of 1995 unless the information collection has a currently valid OMB Control Number. The approved OMB Control Number for this information collection is 0648-0007. Without this approval, we could not conduct this information collection. Public reporting for this information collection is estimated to be approximately 1 hour per response, including the time for reviewing instructions, searching existing data sources, gathering and maintaining the data needed, and completing and reviewing the information collection. All responses to this information collection are voluntary. Send comments regarding this burden estimate or any other aspect of this information collection, including suggestions for reducing this burden to the Matthew Kroll, Office of Coast Survey, Office 6304, SSMC3, Silver Spring, MD, 20832.
(SAMPLE COVER SHEET)
ENC Update Report
For
NOAA ENC US######
<Name of Individual or Group>
Submitted on
Month ##, 2020
General
ENC or CHART
The entire area covered by NOAA ENC US###### was evaluated.
or
The following portion of NOAA ENC US###### was evaluated.
Northern Limit: DD-MM-SS N Eastern Limit: DDD-MM-SS W
Southern Limit: DD-MM-SS N Western Limit: DDD-MM-SS W
DATES OF EVALUATION
MM/DD/YYYY to MM/DD/YYYY
ENC or CHART EDITION NUMBER AND DATE
## Edition, Month, Year
BOATING GROUP or INDIVIDUAL INFORMATION (Optional)
Name/Group: <e.g. Individual, Boat Club, Power Squadron, or USCG Aux>
Address:
Point of contact for this report:
POC phone number:
POC e-mail address:
If group, names of individuals contributing to this report:
Number of hours working on this project ashore:
Number of hours working on this project on the water:
GENERAL METHODS OF ENC/CHART EVALUATION
Provide a brief explanation of methods used to evaluate the chart.
For example:
The ENC Viewer was used to compare charted shoreline to satellite imagery. Comparisons were made over the entire area covered by the ENC.
Inspection of the ENC was made by boat in the following areas: (describe)
If depths were recorded, please note the echo sounder and positioning equipment that was used.
Inspection of the ENC was made by automobile in the following areas: (describe)
Critical Issues
List those “on the water” issues that you consider hazards to marine navigation. In general, these issues have the potential to cause groundings or are otherwise hazardous to marine navigation. If none are identified, simply state, “No critical issues were discovered”. Negative reporting of critical issues is important.
Examples of Critical Issues:
Water depths that are shallower than charted.
Sunken features such as wrecks, rocks, or obstructions that might cause groundings.
Any feature that is charted as “Visible” but was not seen upon inspection. For example, a charted visible wreck is no longer visible—a charted pile is no longer visible.
Charted islands that are no longer visible.
For each critical issue Provide:
Currently Charted Feature: (For example, “Visible Wreck” or “10 foot depth”)
Latitude/Longitude: DDD/MM/SS (Decimal seconds (SS.SS) if determined by GPS)
Method of Investigation: Provide date/time of investigation if conducted on the water, name of person in charge, type of vessel, type of positioning system and depth sounder used.
Description: Describe the nature of the issue. For example, “the chart shows 12 feet depth--we found 3 foot depths in the area.” or…”The chart shows a visible wreck while none was observed when in the area.” Or “There is a charted island, however, it is now a submerged area at all stages of tide.”
Attach any supporting documentation, such as a chartlet.
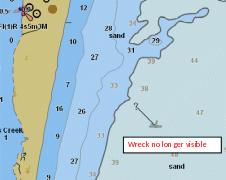 Example
of graphic accompanying a critical issue

SHORELINE AND FEATURES
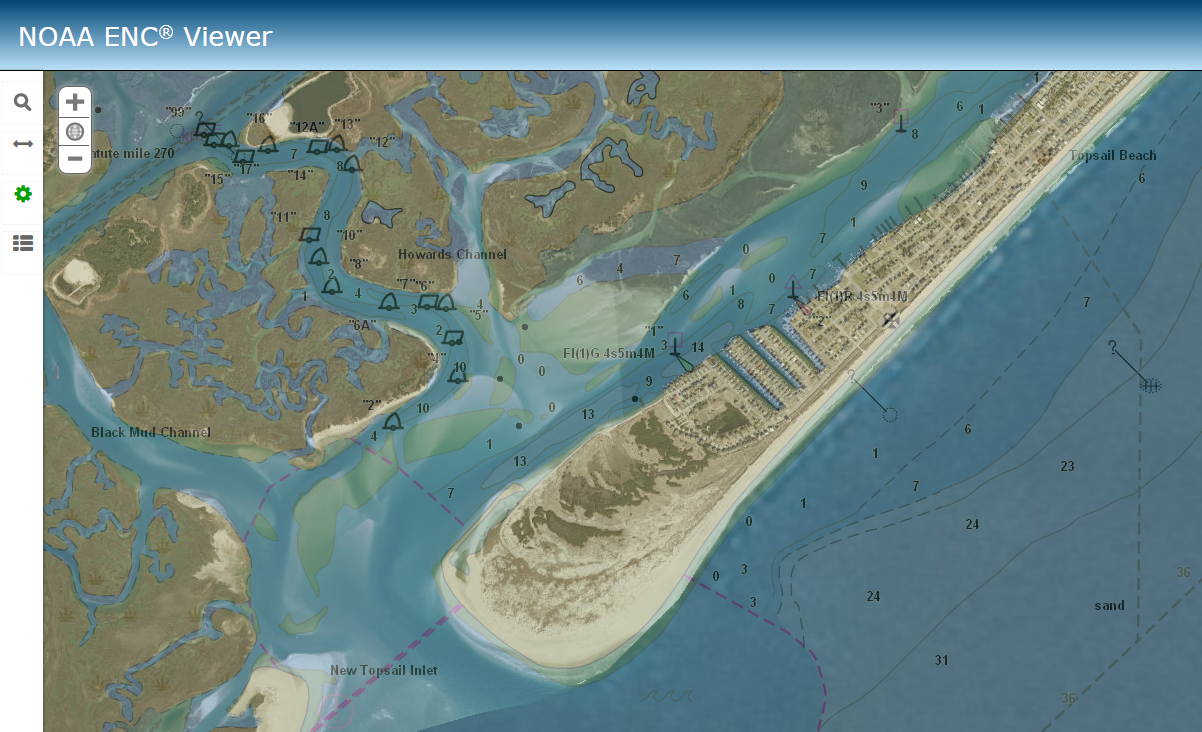
Use NOAA’s ENC Viewer to examine the charted shoreline overlaid on satellite imagery. Note any major changes in the natural and manmade shoreline. Include screen shots of major discrepancies. For manmade features such as piers and jetties, focus on areas where there are numerous features, rather than individual ones.
To determine if something is significant, use the rule “1 millimeter at the scale of the chart” for guidance. In other words, if the chart is a 1:10,000 scale, then a feature that extend 10 meters (or approximately 33 feet) offshore would be significant. At a 1:20,000 scale chart, a feature that extends 20 meters (or approximately 66 feet) offshore would be significant.
Below is a list of other onshore features that can be inspected using the RNC Viewer.
Airports |
Ferries |
Piers and Docks |
Overhead Cables* |
Groins |
Platforms |
Coast Guard Stations |
Jetties or Breakwaters |
Pipelines |
Bridges |
Landmarks |
Ramps |
Dams |
Logbooms |
Radio Broadcasting Stations |
Dikes and Levees |
Marine Construction |
Rocks |
Docks and Piers |
Marine Railways |
Ruins |
Dolphins |
Obstructions |
Sewer Outlets |
*If overhead cables are found that are not charted, please attempt to locate any information in the area as to who owns the cable. If an uncharted submerged cable is located from a sign on the shore, please capture the information onthe sign so Coast Survey can reach out for more information if needed.
Example of graphic accompanying a shoreline report
LANDMARKS
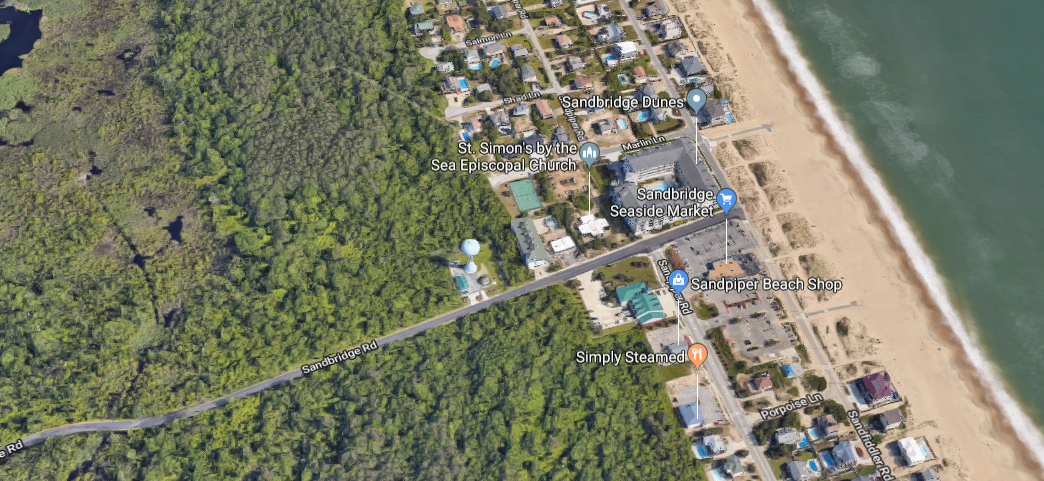
Using the ENC Viewer with imagery, inspect all charted landmarks. Observe if all landmarks are visible on the satellite imagery and fall within the charted landmark circle. If a landmark is not visible on the imagery—a field trip to the landmark may be desirable in order to determine if it still exists. If you are in a boat on the water, then make note if the landmark is visible. A landmark will rarely be deleted based on information obtained only from the imagery. The deletion of the landmark can be confirmed by field observation—either on the water, or by visiting the landmark location.
State that you have examined all landmarks on the chart and make note which landmarks were not confirmed. Provide details for those landmarks that are recommended for deletion.


TANK
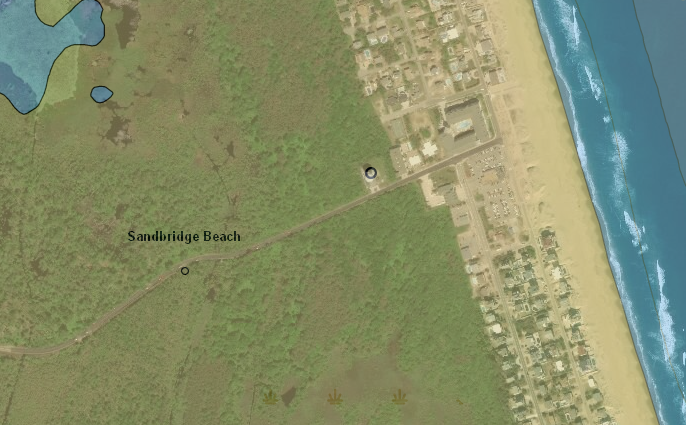
TANK

FIELD /ON THE WATER CHART INSPECTION
Field inspection from (on the water of from shore) can provide valuable information regarding the accuracy of the chart. Safety of the vessel/vehicle and crew must be the principle concern when performing chart inspection activities on the water. In general, submerged features-- such as submerged wrecks and obstructions-- will not be deleted from the chart based on a chart inspection survey. Therefore, it is best to stay clear of these types of submerged hazardous features. Types of features that may be addressed on the water:
Those issues that have been identified through the ENC Viewer. For example, make observations regarding a new jetty or cluster of piers. Identify public boat ramps that are not charted. Where possible, obtain a GPS position on or near the feature.
Confirm that charted islands are now submerged.
Identify charted visible wrecks that are now submerged and no longer visible.
If you have the capability to conduct depth surveys—identify areas where the chart may be in error. Depth information regarding “Shoaling Reported” notes may be valuable. Transducer depth and tide corrections should be applied to survey depths when possible.
Identify features, such as bridges, that are charted “under construction.” If construction on these features appears to be completed, please make a note of this. In regards to vertical and horizontal bridge clearances, do not make physical measurements on bridges. NOAA obtains that information through the USCG and bridge builders.
When possible, insert screenshots of charts in the report to help illustrate the issue.
Coast Pilot
View or download the United States Coast Pilot® and search for the section associated with the chart you are inspecting. There may be several paragraphs--sometimes an entire page-- describing the chart. Review the information and identify areas where information is not accurate and changes should be made. Include recommended changes in this section.
Be sure to include the Coast Pilot Number, edition number, affected pages, and paragraph numbers. If everything in the Coast Pilot is accurate, state that the Coast Pilot has been reviewed and no issues were discovered.
Miscellaneous
Include any other information or statements regarding accuracy of the chart.
Appendix: Using the ENC Viewer for Chart Inspection
Access the ENC Viewer through the Coast Survey home page at https://nauticalcharts.noaa.gov/enconline/enconline.html
Pan and zoom into the area of interest using the Plus/Minus symbols in the upper left corner or the scroll wheel on your mouse.
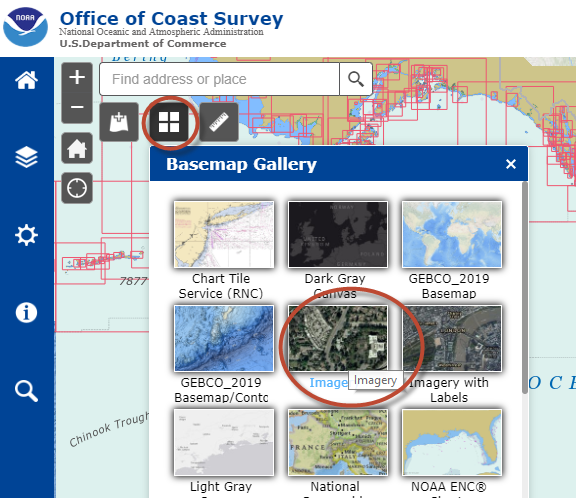
Choose Imagery from the Basemap Gallery in the upper right hand corner.
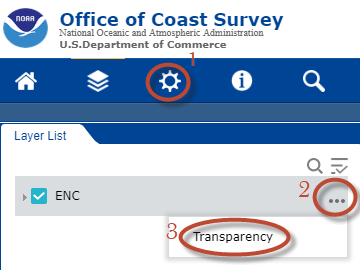
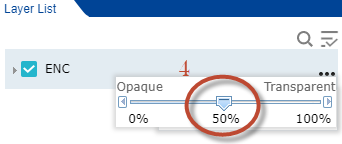
Change the transparency of the ENC to approximately 50% so that the imagery shows through.
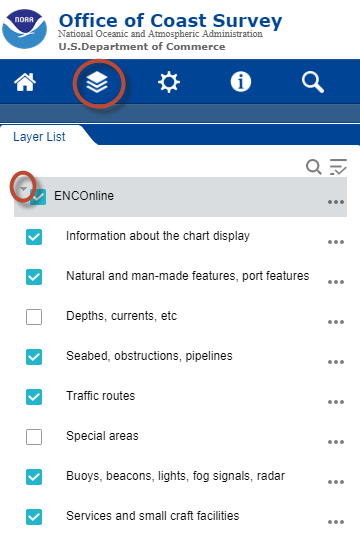
Use the Layer List to turn on and off different features in the ENC.
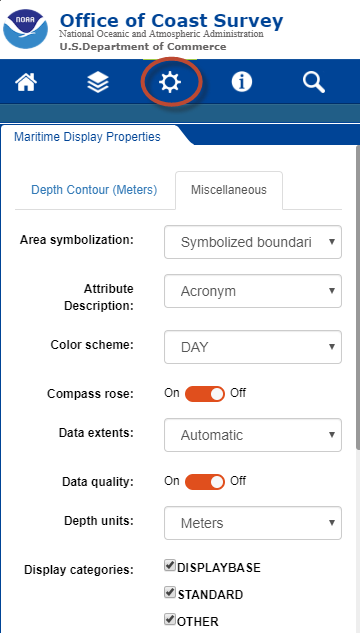
Use the Settings tool to choose different ways to display the data, such as depth units, color scheme and symbols.
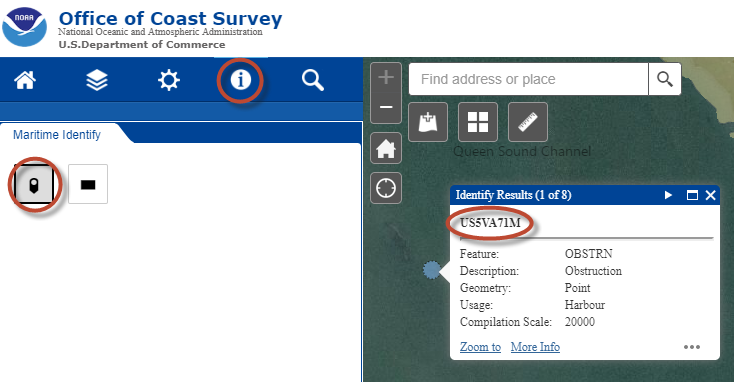
Use the Identify Tool to query features in the ENC and to determine which ENC the feature comes from.
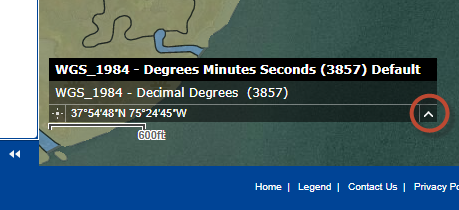
Change the format of the way that coordinates are displayed from the lower left corner of the screen
![]()
| File Type | application/vnd.openxmlformats-officedocument.wordprocessingml.document |
| Author | Nick Perugini |
| File Modified | 0000-00-00 |
| File Created | 2022-07-20 |
© 2026 OMB.report | Privacy Policy