Appendix F9 Advance Materials for Second Concept Mapping Meeting_01202022
Appendix F9 Advance Materials for Second Concept Mapping Meeting_01202022.docx
Food Security Status and Well-Being of Nutrition Assistance Program (NAP) Participants in Puerto Rico
Appendix F9 Advance Materials for Second Concept Mapping Meeting_01202022
OMB: 0584-0674
OMB Number: 0584-XXXX Expiration
Date: XX/XX/XXXX
Appendix F.9. Advance Material for Second Concept Mapping Meeting
Data
Visualization Resulting From the Group Concept-Mapping Activities
With Stakeholders:
Policy Priorities to Influence Food Security
in Puerto Rico
Thank you for the time and effort you have put into concept mapping around policies and practices that can influence food security in Puerto Rico. This report includes a series of data visualizations that are the result of the brainstorming, sorting, and rating activities. Please review this information before the next stakeholder meeting scheduled for [INSERT DATE] and be prepared to provide feedback on these results.
During the meeting, you will be asked to participate in discussions on the following questions:
Do the clusters represent a complete picture of the food security landscape in Puerto Rico? What did we get right? What did we miss?
When looking at the cluster maps and thinking about the relationship (i.e., distance between) clusters, are there any surprises or relationships you did not expect to see?
When you look at the statements in the Go-Zone, are you aware of any that are currently being discussed or piloted?
When you compare the Go-Zone maps of different groups, are there clear differences that stand out that we should be aware of?
What similarities and differences do you see in how different groups of stakeholders have sorted the policy and administrative recommendations?
Based on all the information presented, what would be your recommendations for policy, systems, or environmental changes?
Statements and clusters. Table 1 presents a summary of the statements used in the multidimensional scaling and data analysis step. A total of 186 statements were generated during the brainstorming period. All statements were reviewed by the research team, and a set of 120 statements was produced through (1) reduction of repeated ideas and (2) parsing of multiple idea statements (e.g., the statement “increase funding and hire more staff” would be parsed into two statements, “increase funding” and “hire more staff”). In addition to the statements, table 1 indicates the cluster the statement is nested in and the statement’s mean rating on potential impact and implementation feasibility.
Table 1. Statement, Clusters, and Mean Ratings
Statement Number |
Statement/Idea |
Cluster |
Potential Impact |
Implementation Feasibility |
1 |
Increase food access in rural communities |
Access |
2.37 |
1.21 |
2 |
Augment administrative funding |
Program Administration |
2.06 |
4.99 |
3 |
Teach food storage/preservation |
Education |
3.56 |
4.37 |
4 |
Encourage development of supermarkets |
Access |
4.27 |
4.58 |
5 |
Tie housing security to food security |
Federal Policy |
2.33 |
3.61 |
6 |
Work with local nonprofits to develop double-buck programs for fruits and vegetables |
Local NGOs |
1.27 |
3.67 |
7 |
Fund SNAP-Ed type programs |
Education |
1.21 |
4.11 |
8 |
Establish new methods for determining monthly benefits |
Federal Policy |
4.37 |
1.24 |
… |
|
|
|
|
113 |
Revise eligibility requirements |
Federal Policy |
4.18 |
3.11 |
114 |
Work with local retailers to increase healthy options |
Healthy Retail |
2.93 |
2.72 |
115 |
Provide culturally tailored nutrition education |
Education |
3.59 |
2.86 |
116 |
Conduct expanded outreach and notification |
Communication |
1.38 |
4.74 |
117 |
Create separate disaster relief program |
Federal Policy |
4.76 |
4.25 |
118 |
Provide additional training to program staff |
Program Administration |
4.25 |
1.45 |
119 |
Develop new methods of communicating with benefit recipients |
Communication |
1.45 |
3.12 |
120 |
Shift NAP to an entitlement program |
Federal Policy |
3.12 |
3.17 |
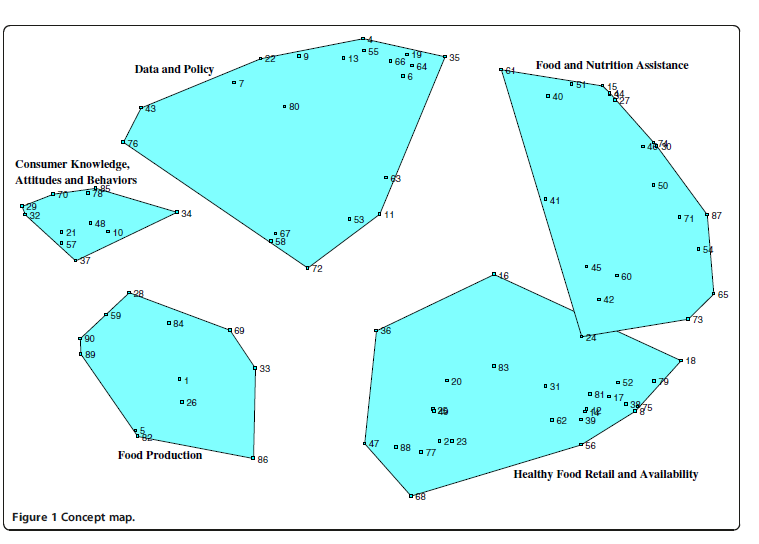
Cluster maps. Figure 1 presents a cluster map with data points indicating the statements nested within each cluster. The cluster map in figure 1 represents a five-cluster solution. The cluster map is created through a multidimensional scaling analysis that uses the sorting data provided by stakeholder participants to generate groups based on common patterns of similarity.
Figure 1. Example of a Cluster Map: Five-Cluster Solution

The following text is an example of how the cluster results would be described to the stakeholders:
The 120 printed statements were grouped on average into XX.yy (SD = x.yy) clusters (range = 2–10). The number of statements per cluster varied from Y to Z and averaged XX.yy (SD = x.yy). Based on the piles of statements made by participants, the MDS analysis produced an interpretable point map that displayed the 120 statements (see appendix A for a complete list of the statements). Each of the 120 statements is indicated on the map by a dot and number (see figure 1).
More similar or related statements are located closer to each other on the map, reflecting a high degree of conceptual similarity as judged by participants. Distance between dots would not change if the map were rotated or if clusters were modified. The cluster map consists of irregular geometric shapes that define the concept domains on the point map. The research team selected the 5-cluster solution because the 6-cluster solution divided cluster 1 into 2 distinct clusters, but their content overlapped, and the 4-cluster solution regrouped clusters 11 and 10, which appear to bring distinctive elements into the conceptualization.
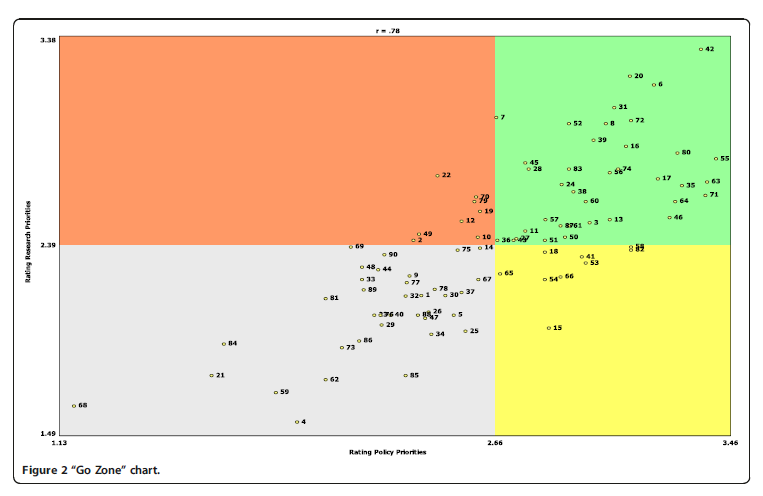
Go-Zone Diagrams. The Go-Zone diagram (figure 2) is an efficient visualization for recognizing which ideas the stakeholder group views as actionable. The axes reflect the rating criteria and determine the dimensions of the space; in this case, a two-dimensional diagram is generated. Examples of potential rating dimensions are potential impact and implementation feasibility. The bisecting lines indicate the mean rating for the rating criteria, and the green quadrant in the upper left corner represents the Go-Zone, which would identify ideas rated high (greater than the mean) in potential impact and implementation feasibility. In contrast, the grey zone would identify ideas rated low in potential impact and feasibility.
Figure 2. Example of a Go-Zone Diagram

The following text is an example of how the cluster results would be described to the stakeholders:
Figure 2 shows the Go-Zone chart for all statements. It is noteworthy that, as shown visually by the chart, most statements had similar rankings for both potential impact and feasibility. There were some exceptions to this trend; for example, the idea of a streamlined application process and eligibility rules for NAP (statement 15) was rated higher for potential impact than for implementation feasibility, and understanding the determinants of food insecurity (statement 6) was rated higher for feasibility than for potential impact. The statements that were ranked among the lowest for both potential impact and feasibility addressed more individual characteristics of rural residents, such as their travel patterns (statement 68) or social standing (statement 21), and social-political factors in rural areas, such as traditional land use patterns (statement 84), outmigration from rural areas (statement 59), and access to political decision making (statement 4).
Public
Burden Statement This
information is being collected to assist the Food and Nutrition
Service (FNS) in understanding food security status and economic
well-being among Puerto Rico residents. This is a voluntary
collection. FNS will use the information as a baseline for future
assessments of food security and the Nutrition Assistance Program,
particularly in the context of natural disasters. This collection
does not request personally identifiable information under the
Privacy Act of 1974. According to the Paperwork Reduction Act of
1995, an agency may not conduct or sponsor, and a person is not
required to respond to, a collection of information unless it
displays a valid OMB control number. The valid OMB control number
for this information collection is 0584-XXXX. The time required to
complete this information collection is estimated to average 75
minutes per response, including the time for reviewing instructions
and completing and reviewing the collection of information. Send
comments regarding this burden estimate or any other aspect of this
collection of information, including suggestions for reducing this
burden, to: U.S. Department of Agriculture, Food and Nutrition
Service, Office of Policy Support, 1320 Braddock Place, Alexandria,
VA 22314. ATTN: PRA (0584-XXXX). Do not return the completed form to
this address.
Food Security Status and Well-Being of NAP Participants in Puerto Rico, Appendix F.9. Advance Material for Second Concept Mapping Meeting
| File Type | application/vnd.openxmlformats-officedocument.wordprocessingml.document |
| Author | Allyson Corbo |
| File Modified | 0000-00-00 |
| File Created | 2023-08-24 |
© 2025 OMB.report | Privacy Policy