Reassessing Nonresponse Bias and Calibration in 2020 ARMS Phase III
NEW - Reassessing Nonresponse Bias and Calibration in 2020 ARMS Phase III - July, 2022.docx
Agricultural Resource Management Phase 3 Economic Surveys
Reassessing Nonresponse Bias and Calibration in 2020 ARMS Phase III
OMB: 0535-0275

United States Department of Agriculture

National Agricultural Statistics Service
Reassessing Nonresponse Bias and Calibration in 2020 ARMS Phase III
Fatou Thiam
Methodology Division
Washington, DC 20250
July 2022
EXECUTIVE SUMMARY
Phase III of the Agricultural Resource Management Survey (ARMS) is a sample survey conducted by the National Agricultural Statistics Service (NASS) on behalf of the Economic Research Service (ERS). ARMS Phase III is conducted annually from January to April, collecting total farm and enterprise level financial data.
In September 2006, the Office Of Management and Budget released the Office of Management and Budget Standards and Guidelines for Statistical Surveys. The Office of Management and Budget’s (OMB) standards and guidelines updated specifications for common survey issues affecting Federal Statistical Agencies. Standard 3.2 updates specifications guiding analysis of survey response rates, as well as mandating evaluation of nonresponse bias when survey response rates are less than 80 percent.
In 2020, NASS’s ARMS III survey yielded a 39.4 percent response rate (Weber, 2021). In compliance with OMB Guidelines, NASS has completed a nonresponse bias investigation for 2020. This investigation replicated two previous ARMS nonresponse bias investigations in 2005 and 2006, both published in 2008. The current research effort applies similar statistical methodology as the precedents, applying it to 2020 ARMS Phase III.
The current research effort begins by matching the 2020 ARMS Phase III sample with respondent records from the 2017 Census of Agriculture. Records contained in both ARMS and Census are referred to as ‘All Matching Records’. A subset of All Matching Records are those records responding to ARMS, ‘Matching Respondents’. Nonresponse bias in the 2020 ARMS survey will be evaluated by inserting 2017 Census data into All Matching Records and calculating weighted means with ARMS sample weights for both All Matching Records and Matching Respondents. Three weighted means of 2017 Census data will be computed and compared across twenty ARMS regions: 1) means for All Matching Records, computed using ARMS sample weights, 2) means for Matching Respondents, using ARMS sample weights, and 3) means for Matching Respondents using ARMS sample weights, adjusted by calibration, referred to as ‘Matching Respondents Calibrated’.
Relative biases will be calculated, and statistically evaluated, for select ARMS variables using OMB’s Guideline 3.2.9 equation. Research results suggest significant persistent biases are exhibited in select variables when Matching Respondents are compared to All Matching Records. Results also suggest the comparison of Matching Respondents Calibrated to All Matching Records produces statistically insignificant biases (p > .05) for a majority of select variables. This research reaffirms a conclusion from two precedents (Earp, McCarthy, Schauer, & Kott, 2008), i.e., calibration is an effective tool for mitigating nonresponse biases.
RECOMMENDATIONS
ARMS Phase III nonresponse bias should be reevaluated when the 2022 Census data are available.
Continue ARMS Phase III target records estimation process and the adaptive data collection strategies that maximize response.
Search for biases at levels other than region.
Reassessing Nonresponse Bias and Calibration in 2020 ARMS Phase III
Fatou Thiam1

Abstract
The United States Department of Agriculture’s National Agricultural Statistics Service (NASS) conducts the annual Agricultural Resource Management Survey (ARMS) in three phases. The third ARMS phase collects sensitive economic statistics. According to the 2006 Office of Management and Budget Standards and Guidelines for Statistical Surveys, response rates lower than 80 percent must be evaluated for nonresponse bias. Since 2002, NASS has employed calibration of survey weights to mitigate nonresponse bias. This research will evaluate nonresponse biases through specifications provided by OMB, data from 2017 Census of Agriculture, and modern survey calibration processes.
Results suggest calibration processes decreased biases to levels no longer significantly different from zero (P<= 0.05) for 95.8 percent of select variables.

Key
Words:
Nonresponse; bias;
calibration.
1 Fatou Thiam, Mathematical Statistician, USDA’s National Agricultural Statistics Service (NASS) – Methodology Division (MD).
INTRODUCTION
On September 22, 2006, the Office of Management and Budget published Office of Management and Budget Standards and Guidelines for Statistical Surveys which was founded on recommendations from the Federal Committee on Statistical Methodology’s (FCSM) Subcommittee on Standards for Statistical Surveys. The Office of Management and Budget’s (OMB) standards and guidelines for statistical surveys apply to all surveys conducted by federal statistical agencies.
Federal statistical agencies, such as the United States Department of Agriculture’s (USDA) National Agricultural Statistics Service (NASS), are subject to OMB’s standards and guidelines for statistical surveys. Standard 3.2 provides specifications for analysis of response rates and nonresponse bias. According to Standard 3.2,
Agencies must appropriately measure, adjust for, report, and analyze unit and item nonresponse to assess their effects on data quality and to inform users. Response rates must be computed using standard formulas to measure the proportion of the eligible sample that is represented by the responding units in each study, as an indicator of potential nonresponse bias. (Office of Management and Budget, 2006, p. 14)
The 2020 ARMS Phase III usable response rate was 34.9 percent (n = 33,892), well below the OMB response rate threshold of 80 percent referenced in Guideline 3.2.9; therefore, NASS will reevaluate nonresponse bias with similar methods employed for two previous investigations published in 2008 (Earp, McCarthy, Schauer, & Kott, 2008). Table 1 illustrates recent response rates for ARMS Phase III.
Table 1. US ARMS Phase III Response Rates.
Year |
Usable Response Rate |
2005* |
70.5 |
2006* |
67.6 |
2016 |
52.6 |
2017 |
60.6 |
2018 |
45.1 |
2019 |
42.6 |
2020 |
34.9 |
* indicates years associated with Earp, McCarthy, Schauer, & Kott, 2008
OMB’s Guideline 3.2.9 states:
“Given a survey with an overall unit response rate of less than 80 percent, conduct an analysis of nonresponse bias using unit response rates as defined above, with an assessment of whether the data are missing completely at random. As noted above, the degree of nonresponse bias is a function of not only the response rate but also how much the respondents and nonrespondents differ on the survey variables of interest. For a sample mean, an estimate of the bias of the sample respondent mean is given by:
![]()
where,

For a multistage (or wave) survey, focus the nonresponse bias analysis on each stage, with particular attention to the “problem” stages. A variety of methods can be used to examine nonresponse bias, for example, make comparisons between respondents and nonrespondents across subgroups using available sample frame variables. In the analysis of unit nonresponse, consider a multivariate modeling of response using respondent and nonrespondent frame variables to determine if nonrespondent bias exists.” (Office of Management & Budget, 2006, p. 16)
NASS calculates unweighted unit response rates (RRU) for ARMS based on the expression provided in Guideline 3.2.2 of the Office of Management and Budget Standards and Guidelines for Statistical Surveys:

where,
C = the number of completed cases or sufficient partials
R = the number of refused cases
NC = the number of noncontacted sample units known to be eligible
O = the number of eligible sample units not responding for reason other than refusal
U = the number of sample units of unknown eligibility, not completed
e = the estimated proportion of sample units of unknown eligibility that are eligible
ARMS is conducted in three phases. Phase I screens for qualifying agricultural operations for Phases II and III. Phase II collects data on cropping practices and agricultural chemical usage, while Phase III collects detailed economic information about the agricultural operation as well as the operator’s household.
NASS weights ARMS Phase III respondents such that a subset of summary variable totals match specific “targets” determined from external sources. This weighting process is called “calibration.” Calibration adjusts survey weights in a manner that summary direct expansions match, or are close to, a specified target’s value.
Calibration in ARMS Phase III targets official statistical estimates for farm numbers, farm numbers by economic sales classes, corn, soybean, wheat, rice, cotton, hay, peanut, sugarcane, sugar beet, tobacco, fruit and vegetable acres, floriculture crops, cattle, cattle on feed, hog, broilers, layer, milk, turkey inventories, and egg production. Calibration weighted sums of survey data will equal, or be close to, the targeted values listed above. An important benefit under calibration weighting is a reduction in nonresponse biases (Earp, McCarthy, Schauer, & Kott, 2008). The current research will evaluate 2020 ARMS nonresponse biases, and their mitigation through calibration, using 2017 Census of Agriculture data.
Calibration, as expressed by Davies, G., J. Gillard, and A. Zhigljavsky. 2016, is as follows: suppose m sampling units in a survey have been assigned initial weights di for i=1,…,m, and furthermore, there are n auxiliary variables whose values in the sample are known. Calibration seeks to improve the initial weights di by finding new weights wi that incorporate this auxiliary information while perturbing the initial weights as little as possible, the ratio gi = wi /di must be close to one.
Let X ∈ Rm×n be the matrix of survey samples, with each column corresponding to an auxiliary variable. Reweighting can be expressed as the optimization problem (see Davies, Gillard, and Zhigljavsky, 2016):


with respect to g ∈ Rm.
where ϕ: R→R is a strictly convex function with ϕ(1)=0, r ∈ Rn are the known population totals of the auxiliary variables, and A ∈ Rm×n is related to X by Aij = diXij for i=1,…,m and j=1,…,n.
The Census of Agriculture is a mandatory data collection from all known U.S. agricultural operations. Some data concepts measured in the 2017 Census of Agriculture are exact matches to those measured on the 2020 ARMS, therefore, comparisons can be constructed. The Census of Agriculture is not a complete enumeration, and comparisons cannot be constructed for nonrespondent operations. An estimated 15.1 percent of all farms were missing from the 2017 Census Mailing List, and 13.9 percent of farms on the Census Mail List were nonrespondents to the Census. Furthermore, ARMS sample operations may not match those in the 2017 Census of Agriculture. Nevertheless, a difference calculation will be constructed that contrasts 2017 Census data values of All Matching Records (19,257) to Matching Respondents (8,755). This research will evaluate the difference, as well as changes in the difference under calibration weighting.
METHODS
The analytical data set contains 2017 Census of Agriculture respondent data values for operations sampled for the 2020 ARMS. Sample weights for each agricultural operation are those from the 2020 ARMS sample selection, before calibration. Targets for calibration are established by computing the ARMS sample weighted direct expansions of All Matching Records, using 2017 Census of Agriculture data, for twenty ARMS regions. These direct expansions are used as calibration targets to adjust ARMS sample weights for Matching Respondents. The twenty ARMS regions include the fifteen largest cash receipts states (Arkansas, California, Florida, Georgia, Illinois, Indiana, Iowa, Kansas, Minnesota, Missouri, Nebraska, North Carolina, Texas, Washington, and Wisconsin) and the remaining thirty-three states (Alaska and Hawaii are not sampled for the ARMS) which are grouped using five production regions: 1) Atlantic, 2) South, 3) Midwest, 4) Plains, and 5) West.
Calibration targets employed in this research are farm numbers, farm numbers by economic sales classes, corn, soybean, wheat, cotton, peanut, sugarcane, sugar beet, tobacco, fruit and vegetable acres, cattle, cattle on feed, hog, broiler, layer, dairy cow, and turkey inventories. Egg production is not included due to 2017 Census of Agriculture questionnaire design.
This research focuses on sixteen survey variables collected on both ARMS and the Census of Agriculture, which are not calibration targets:
Total Acres
Total Sales
Acres Rented
Cropland Acres
Total Production Expenses
Seed Expenses
Fertilizer Expenses
Chemical Expenses
Livestock Purchases
Feed Purchases
Hired Labor Expenses
Machinery and Equipment Value
Government Payments
Operator’s Age
Operator’s Race
Farm Type.
These select variables were also used in previous research; however, crop expenses are not present as in Earp et. al., 2008 due to lack of clear survey definition.
Let
 represent the ARMS sample or calibration weighted mean, for Matching
Respondents or Matching Respondents Calibrated, respectively,
and
 represent the ARMS sample weighted mean for All Matching Records.
Relative bias, a trivial variation of OMB’s expression 3.2.9,
is defined as:
The statistical significance of relative bias is difficult to
evaluate with traditional survey metrics since elements in
 and
and
 overlap. Fortunately, a test for persistent biases across twenty ARMS
regions can be computed with the following measure, referred to as
regional relative bias:


This measure is symmetric,
 ,
and retains the scale-invariance property of relative bias, i.e.,
multiplying the reported Census data value for each operation by a
fixed factor, a weight, does not affect the overall regional
relative bias.
The regional relative bias measure, M, for a select study
variable is treated as an independent
random variable. The mean
of all twenty regional relative biases,
 will be evaluated for location through corrected sum of squares. The
null hypothesis of no regional relative bias,
 will be tested against an alternative hypothesis of persistent
regional relative bias (p>.05%).
In as much as a conventional
t test,
based on
twenty observations, is
asymptotically normal under both the null and alternative
hypotheses, M
values will approximate a Student t
with nineteen degrees of freedom.
This approximation could lead to liberal inferences (the
inappropriate rejection
of the null hypothesis when it is true) since M values for
select study variables
may not
be normally
distributed nor possess a
common variance
across regions.
Nevertheless, by taking logarithms, M values will be
more normal and homoscedastic
than absolute relative biases.
A sign and a signed-rank test for the twenty observations will also
be computed. The sign
test is not as powerful as the other two tests
(i.e., it more often fails to find that
 is significantly different from 0 when, in fact, there
is a persistent bias across the regions), but it assumes
neither normality nor
homoscedasticity of M.
The signed-rank test assumes homoscedasticity, but not
normality. Both will be included for
comparison. A paired t test is included evaluating the null
hypothesis of no mean bias reduction for each study variable:

RESULTS AND DISCUSSION
Results are presented in Table 2. National Estimates are included
for reference. All sixteen study
variables exhibited unanimous persistent regional relative
biases across all three statistics comparing Matching Respondents
to All Matching Records.
The comparisons of Matching
Respondents Calibrated to
All Matching Records
indicate thirteen of the sixteen study variables unanimously
retained the null hypothesis of “no persistent regional
relative bias”. The three remaining study variables, Farm
Type, Chemical and Fertilizer Expenses returned a mixture of
results. Table 3 illustrates forty-eight statistical tests of “no
persistent regional relative bias” considering all sixteen
study variables and the t, sign, and sign rank (three) statistics.
In these forty-eight tests, regional relative biases of Matching
Respondents,
 ,
compared to All Matching Records,
 ,
95.8 percent of the null hypotheses are rejected. After calibrating
ARMS sample weights to obtain Matching
Respondents Calibrated,
the “no persistent regional relative bias” null
hypotheses rejection rate falls to 10.4 percent, an 85.4 percent
difference. Comparative rejection rate declines of 47.1 and 34.4
percent were produced for 2005 and 2006, respectively (see Table 3).
Paired t tests suggest the null hypotheses of “No Mean Bias Reductions” are rejected for fifteen of the sixteen study variables. The current rate of significant Mean Bias Reductions of 93.8 is well above the 29.4 and 76.5 percent found in 2005 and 2006, respectively. A possible explanation for the improvements in paired t test may be that a richer set of calibration targets were used in 2020 relative to the previous studies. Over time, NASS has evolved the targeted data set from about twelve targets in 2002, to about thirty targets in 2020. The 2005 and 2006 studies used twelve targets.
Additional analyses of the 2020 ARMS thirty replicate regional relative biases are available and computed via:

where i = 1 to 30. Results for all sixteen variables across all three statistics and thirty replicates are displayed in Table 4. Paired t tests for Mean Bias Reductions are also calculated and presented. The percentage of significance replicate regional relative biases are comparable to results obtain on the full replicate presented in Table 2. Significant Mean Bias Reductions across replicates are also comparable to the full replicate.
Table 2. Significance of Regional Relative Biases, 2020 ARMS Study Variables
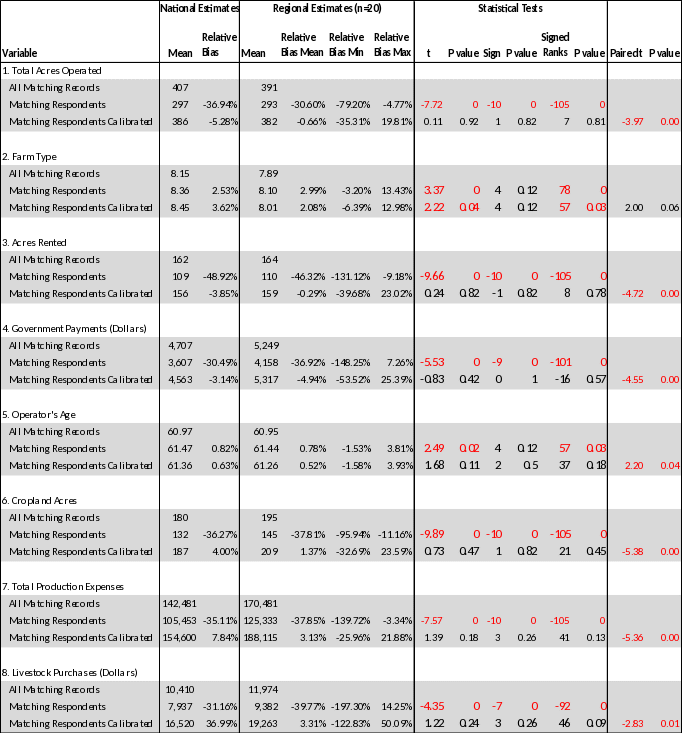
Table 2 continued
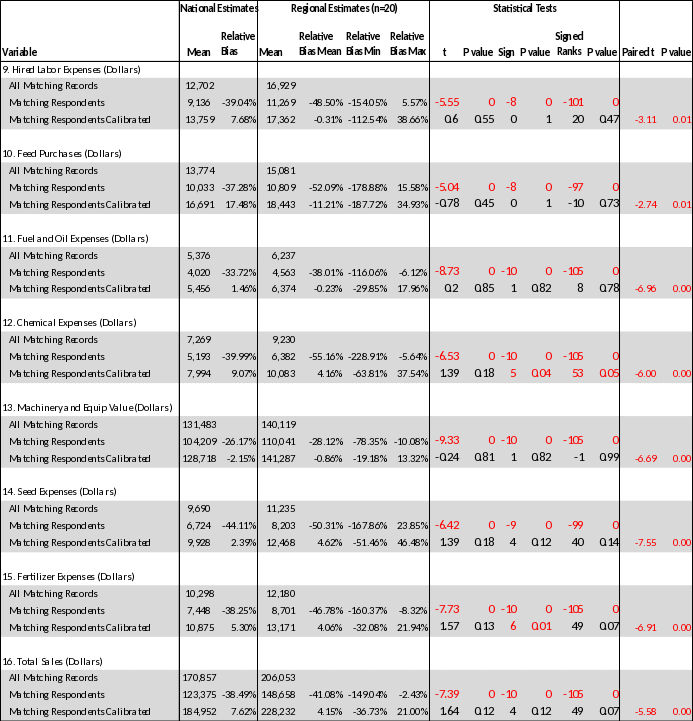
Table 3. 2020 ARMS Regional Relative Biases Comparisons to 2005 and 2006 Results
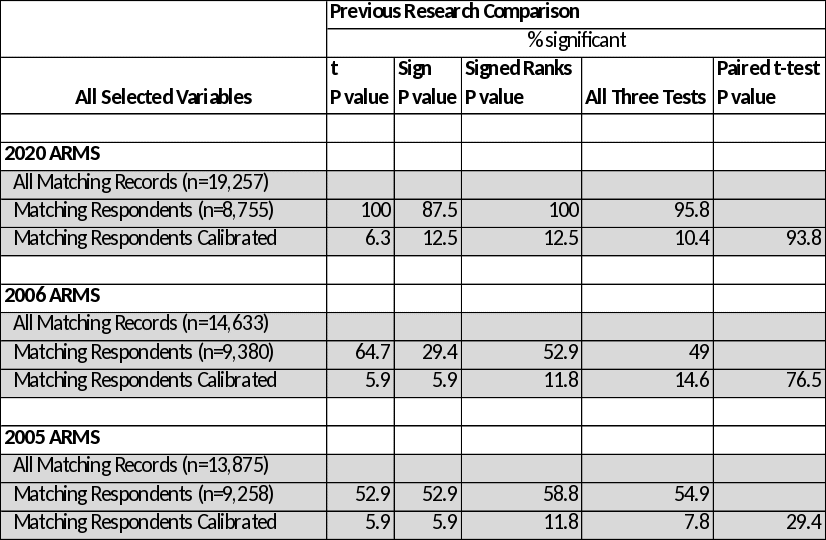
Table 4. Significance of Regional Relative Mean Biases for 2020 ARMS using 2017 Census Data Across 30 Replicates

Beginning in 2016, NASS defined ARMS High Impact Records for customized data collection strategies and statistician estimation. High Impact records were defined as those contributing a large percentage of control data, relative to calibration target totals. During the 2020 ARMS III cycle, NASS statisticians estimated for sixty-two High Impact Records. The estimation process was accomplished through comparisons of nonrespondent control data with respondent control data relative to reported values. Ratios, administrative data, and other data sources are then applied to a nonrespondent’s control data producing an estimated response. These estimated responses are typically consistent across state, farm type, and sales class.
To evaluate the consequences of removing High Impact Records on regional relative mean biases, the same statistical tests were conducted after removing the NASS estimated High Impact Records from the dataset. The results are displayed in Table 5.
Table 5. Significance of Regional Relative Mean Biases for 2020 ARMS using 2017 Census Data After Removal of High Impact Records
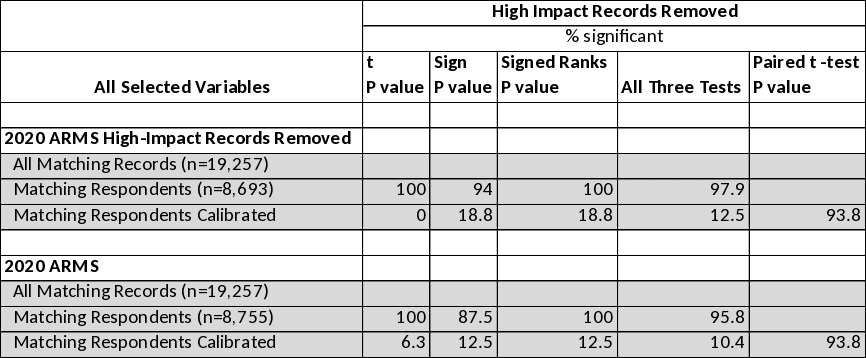
These results indicate removal of High Impact Records did not produce questionably adverse impacts to the tested hypotheses. No comparisons to previous studies are made since High Impact Records process began in 2016. For the 2020 ARMS cycle, the sixty-two High Impact Records were not impactful enough to alter the original calibration result when viewed from the perspective of percent significant of selected statistical tests.
CONCLUSION
ARMS data are used by farm organizations, commodity groups, agribusiness, Congress, State Departments of Agriculture, and the USDA. USDA uses ARMS data to evaluate farm financial performance which influences agricultural policies. USDA also uses ARMS data to objectively evaluate other agriculture and rural community issues, therefore, survey actions minimizing ARMS nonresponse bias are essential to establish and maintain USDA credibility.
This research reassessed NASS’s calibration process as a mitigant of nonresponse biases in 2020 ARMS Phase III. 2017 Census of Agriculture weighted mean estimates of total production expenses, livestock purchases, hired labor expenses, feed purchases, fuel and oil expenses, chemical expenses, machinery and equipment value, and seed and fertilizer expenses exhibited significant persistent biases using ARMS sample weights. Although the magnitude of the relative bias of the mean estimate remained high for livestock purchases using the calibrated weights, calibration reduced the magnitude of this bias to statistical insignificance (see Table 2). Egg and milk production were not included as calibration targets, because these data items collected for the 2017 Census did not match those in ARMS. This may help to explain why the magnitude of the estimated relative bias of the mean for livestock purchases. Calibration of ARMS sample weights produced relative biases that accepted the null hypothesis of ‘no persistent bias’ for a majority of select study variables. Additionally, mean bias reductions were found to be significant for the majority of select study variables.
According to Guideline 3.2.13 of the Office of Management and Budget Standards and Guidelines for Statistical Surveys, NASS should:
Base decisions regarding whether or not to adjust or impute data for item nonresponse on how the data will be used, the assessment of nonresponse bias that is likely to be encountered in the review of collections, prior experience with this collection, and the nonresponse analysis discussed in this section. When used, imputation and adjustment procedures should be internally consistent, sampled on theoretical and empirical considerations, appropriate for the analysis, and make use of the most relevant data available. If multivariate analysis is anticipated, care should be taken to use imputations that minimize the attenuation of underlying relationships.
Since the ARMS Phase III data user community is large, and the survey has influence on agricultural policy, NASS’s calibration process must be an effective mitigant of nonresponse biases. This research demonstrates that effectiveness through relative bias and bias reduction measures that, overall, support survey calibration practice. Regular ARMS production cycles are likely improved further than this research suggests when calibration targets are given appropriate attention in questionnaire design, enumeration, and editing. Based on the calibration targets used in research, calibration is demonstrated to be an effective statistical process for addressing persistent regional ARMS nonresponse biases.
Limitations of this analysis include: 1) Slight calibration target mismatches between production ARMS and this research, namely egg and milk production; 2) Statistical tests in this research are based on matching farms responding to the 2017 Census of Agriculture; and 3) no statistical tests produced for subregional relative biases.
RECOMMENDATIONS
Based on the current research results, the following recommendations are made:
ARMS Phase III nonresponse bias should be reevaluated when the 2022 Census data are available.
Continue ARMS Phase III target records estimation process and the adaptive data collection strategies that maximize response.
Search for biases at levels other than region.
REFERENCES
Davies, G., J. Gillard, and A. Zhigljavsky. 2016. “Comparative Study of Different Penalty Functions and Algorithms in Survey Calibration.” In Advances in Stochastic and Deterministic Global Optimization, 87–127. Cham: Springer International Publishing. https://doi.org/10.1007/978-3-319-29975-4_6.
Earp, M.S., McCarthy, J.S., Shauer, N.D., & Kott, P.S. (2008), Assessing the Effect of Calibration on Nonresponse Bias in the 2005 ARMS Phase III Sample Using 2002 Census of Agriculture Data. Research and Development Division Staff Report RDD-08-06, United States Department of Agriculture, National Agricultural Statistics Service.
Earp, M.S., McCarthy, J.S., Shauer, N.D., & Kott, P.S. (2008), Assessing the Effect of Calibration on Nonresponse Bias in the 2006 ARMS Phase III Sample Using Census 2002 Data. Research and Development Division Staff Report RDD-08-01, United States Department of Agriculture, National Agricultural Statistics Service.
Kott, P.S. (2005), “Using Calibration Weighting to Adjust for Nonresponse and Coverage Errors” Survey Methodology 32: 133-142.
United States. Department of Agriculture. (2002). 2002 Census of Agriculture, Vol. 1, Appendix C. Washington, DC: U.S. Department of Agriculture.
United States. Department of Agriculture. 2007. 2006 Agricultural Resource Management Survey (ARMS) Phase III Survey Administration Analysis. Washington, DC: U.S. Department of Agriculture.
United States. Department of Education. 2003. National Center for Education Statistics Statistical Standards. Washington, DC: U.S. Department of Education.
United States. Executive Office of the President. 2006. Office of Management and Budget Standards and Guidelines for Statistical Surveys. Washington, DC: U.S. Executive Office of the President.
Weber, J. (2021). 2020 Agricultural Resource Management Survey (ARMS) Phase III Survey Administration Analysis. Census and Survey Division Staff Report SAB-20- 14, United States Department of Agriculture, National Agricultural Statistics Service.
| File Type | application/vnd.openxmlformats-officedocument.wordprocessingml.document |
| Author | earpmo |
| File Modified | 0000-00-00 |
| File Created | 2023-09-26 |
© 2026 OMB.report | Privacy Policy
