V. Site-specific Intervention Design Diagrams
V. Site-specific Intervention Design Diagrams.docx
Rapid Cycle Evaluation of Operational Improvements in Supplemental Nutrition Assistance Program (SNAP) Employment & Training (E&T) Programs
V. Site-specific Intervention Design Diagrams
OMB: 0584-0680
Appendix V. Site-specific Intervention Design Diagrams
This page has been left blank for double-sided copying.
Appendix V. Figure B1.1.a. Colorado intervention design
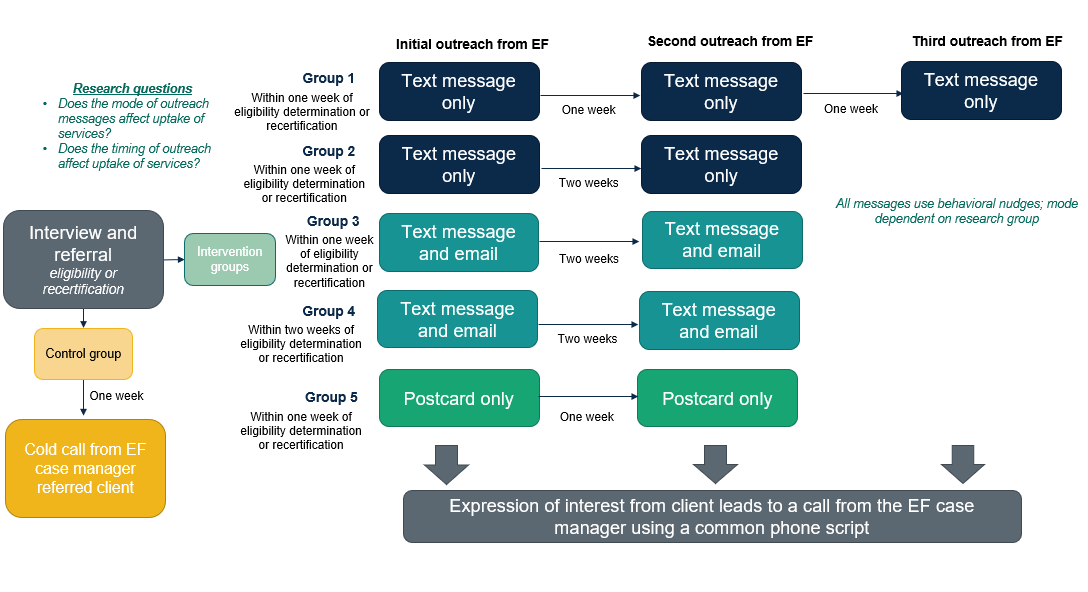
Note: EF = SNAP Employment First program
Appendix V. Figure B1.1.b. Connecticut community colleges intervention design

Appendix V. Figure B1.1.c. District of Columbia intervention design
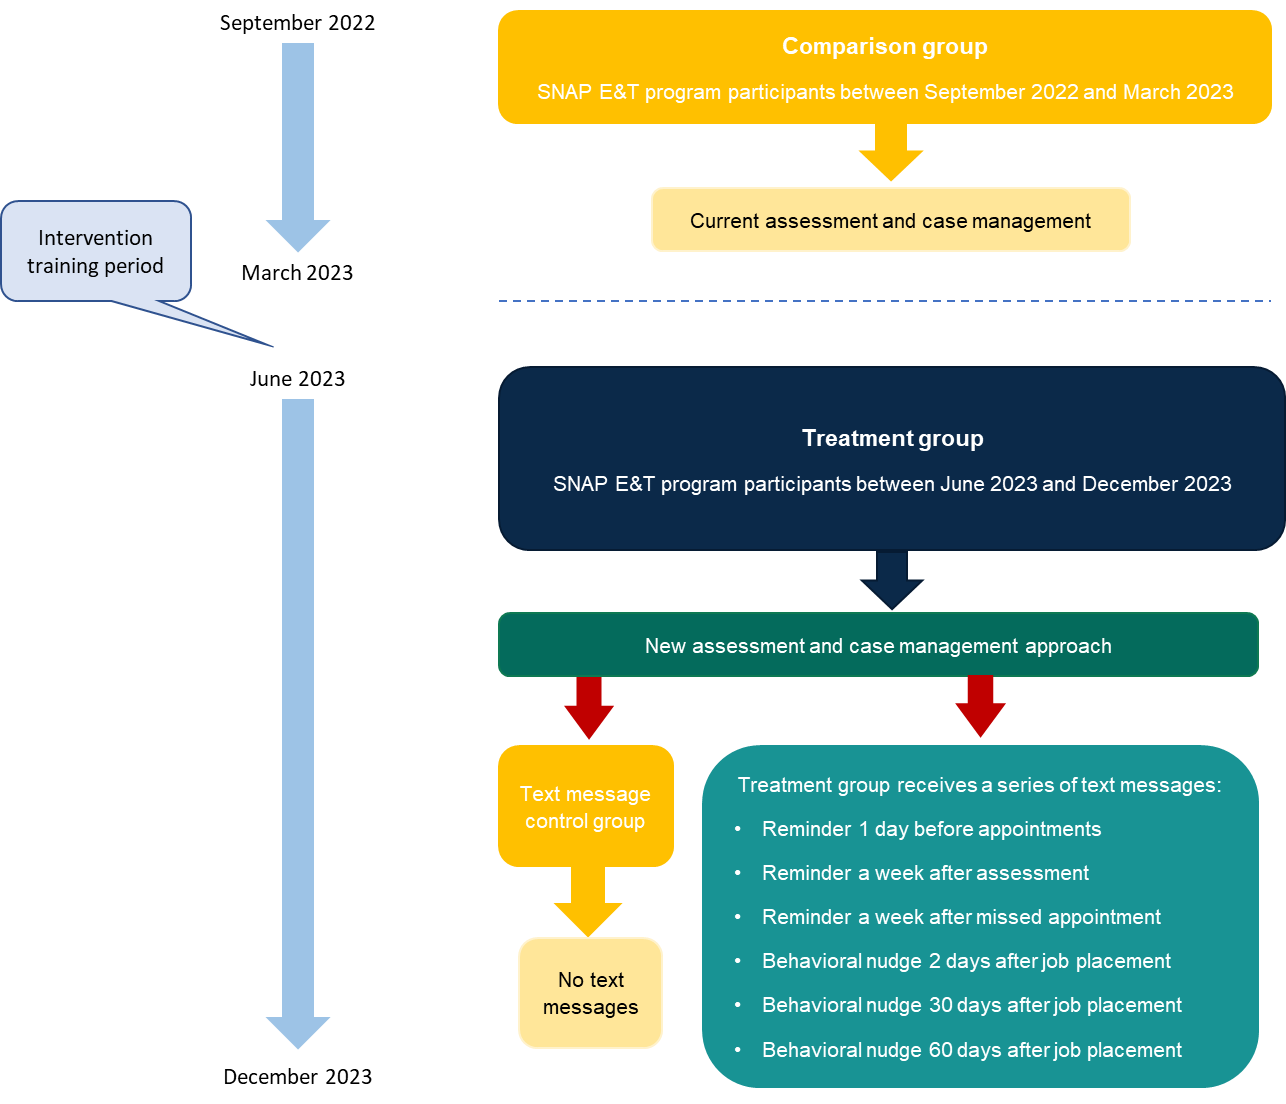
Note: Red arrows indicate points of random assignment
Appendix V. Figure B1.1.d. Kansas intervention design
A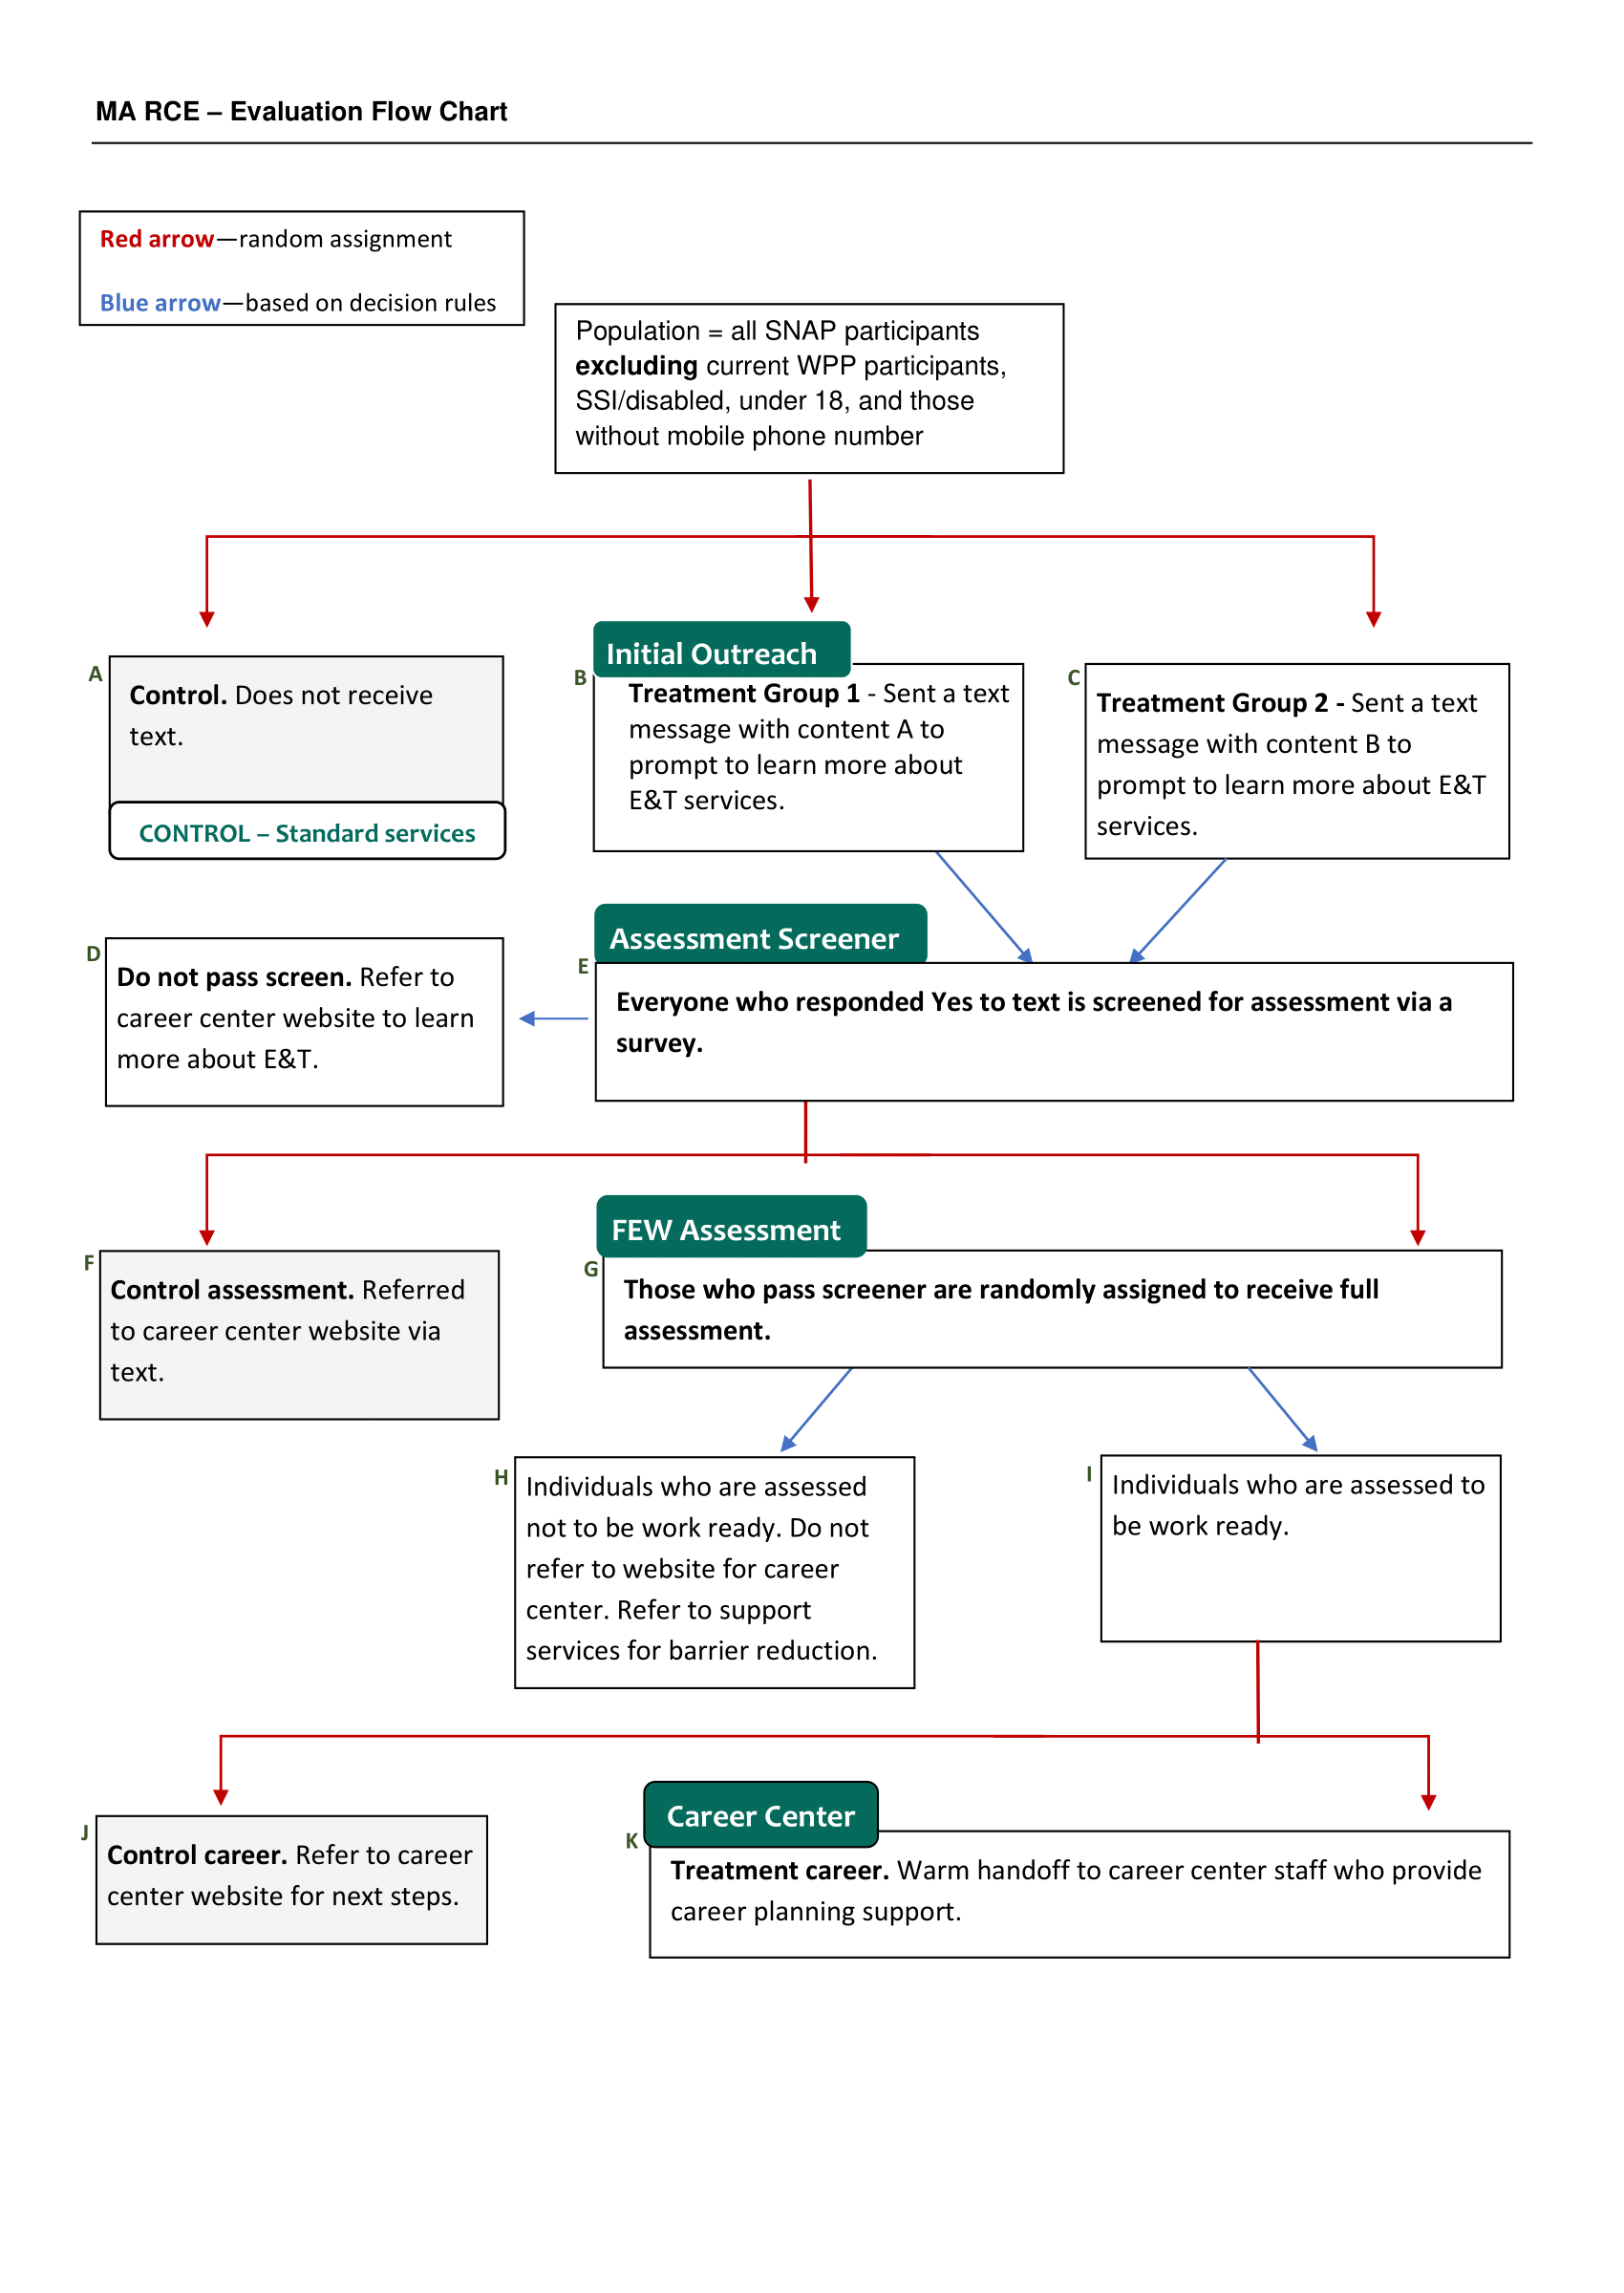 ppendix
V. Figure B1.1.e. Massachusetts intervention design
Note: RCE = rapid cycle evaluation; WPP = Work Participant Program
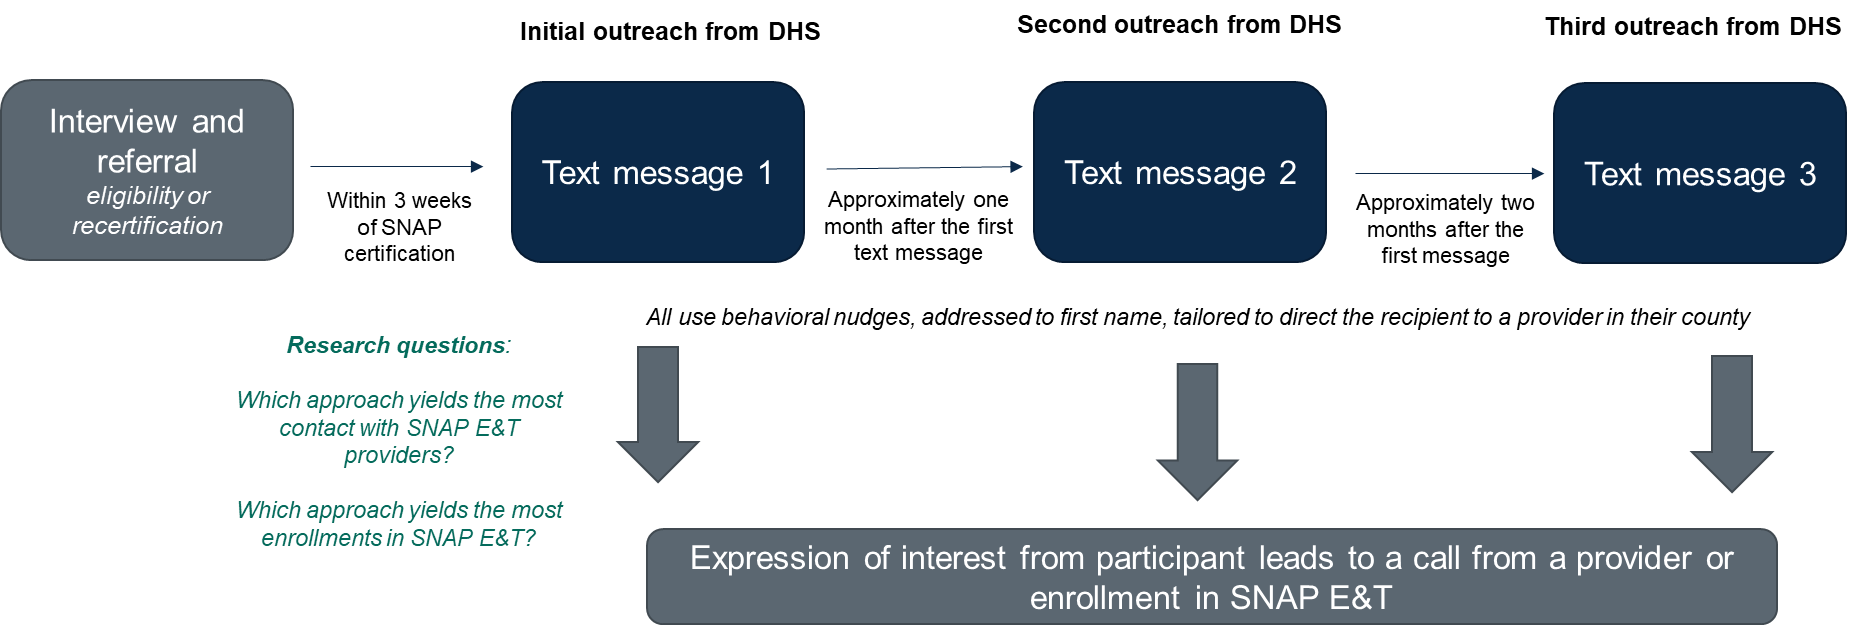
Appendix Q. Figure B1.1.f. Minnesota Hennepin intervention design
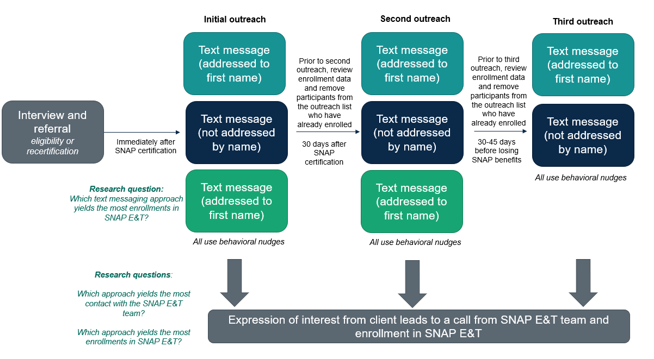
Appendix Q. Figure B1.1.g. Minnesota-Rural intervention design
Note: DHS = Minnesota Department of Human Services
Appendix
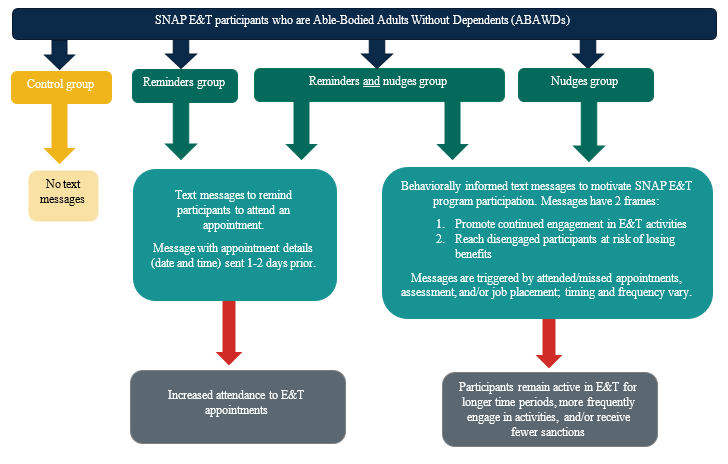
Q. Figure B1.1.h. Rhode Island intervention design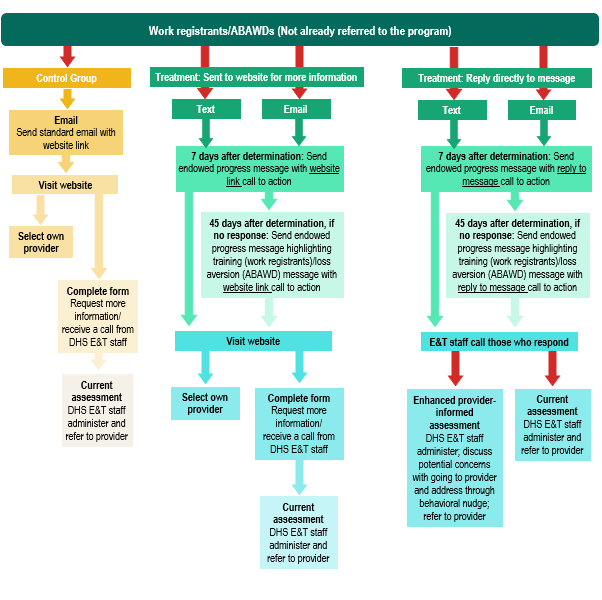
Notes: ABAWD = able-bodied adults without dependents; Red arrows represent random assignment. If sample sizes are large enough, the intervention flow chart will apply separately for work registrants and for ABAWDs.
| File Type | application/vnd.openxmlformats-officedocument.wordprocessingml.document |
| File Title | Mathematica Report |
| Author | James Mabli |
| File Modified | 0000-00-00 |
| File Created | 2023-10-25 |
© 2026 OMB.report | Privacy Policy
