SBIC Management Assessment Questionnaire & License Application; Exhibits to SBIC License App./Mgmt. Assessement Questionnaire
SBIC Management Assessment Questionnaire & License Application; Exhibits to SBIC License App./Mgmt. Assessment Questionnaire
3245-0062 F2-Template.xls
SBIC Management Assessment Questionnaire & License Application; Exhibits to SBIC License App./Mgmt. Assessement Questionnaire
OMB: 3245-0062
⚠️ Notice: This form may be outdated. More recent filings and information on OMB 3245-0062 can be found here:
Document [xlsx]
Download: xlsx | pdf
Table 2.1
Table 2.2 (a)
Table 2.2 (b)
Table 2.2 (c)
Table 2.2 (d)
Table 2.2 (e)
Table 2.3
Table 2.4 (a)
Table 2.4 (b)
Table 2.4 (c)
Table 2.4 (d)
Table 2.4 (e)
File Name Help








Overview
InstructionsTable 2.1
Table 2.2 (a)
Table 2.2 (b)
Table 2.2 (c)
Table 2.2 (d)
Table 2.2 (e)
Table 2.3
Table 2.4 (a)
Table 2.4 (b)
Table 2.4 (c)
Table 2.4 (d)
Table 2.4 (e)
File Name Help
Sheet 1: Instructions
| Exhibit F2: Complete Fund Workbook Instructions | ||||
| V1.1.b - May 24, 2006 | ||||
| General Instructions: | ||||
| You will have one Excel workbook (file) for each Complete fund you are presenting. | ||||
| Save the name of this file as "F2-" + 10 character (or less) acronym that identifies your applicant name + "; " + "Complete" + year of first investment + "; " + the first and last name initials for each principal for which this workbook pertains separated by commas + "; " +date when this report was prepared in YYYYMMDD format. | ||||
| For assistance in creating the correct file name, click on the link to the right. | File Name Help | |||
| Example: | ||||
| Applicant Name: Southern Ventures Fund | ||||
| Principal Name: John Browning, Mary Jones | ||||
| Year of First Investment: 1995 | ||||
| Date Report Prepared: September 30, 2003 | ||||
| File Name for Workbook: F2-SouthernVF; Complete1995; JB,MJ; 20030930 |
||||
| Follow the step by step instructions below, referring to Exhibit F for detailed instructions on each table. | ||||
| Click on tables to go to associated worksheets. | ||||
| Instruction | Worksheet | |||
| 1. Enter General Fund Information | Table F2.1 | |||
| 2. Enter Portfolio Information | ||||
| a. Enter List of Portfolio Companies | Table F2.2 ( a ) | |||
| b. Enter Portfolio Financing Information | Table F2.2 ( b ) | |||
| c. Enter Portfolio Company Realized Events | Table F2.2 ( c ) | |||
| d. Current Status and Unrealized Portfolio Company Information | Table F2.2 ( d ) | |||
| e. Describe Your Involvement with Company | Table F2.2 ( e ) | |||
| 3. Enter Fund Cashflow Information | Table F2.3 | |||
| 4. Review Fund Statistics | ||||
| e. Review Portfolio Summary | Table F2.4 ( a ) | |||
| b. Review Financing Statistics | Table F2.4 ( b ) | |||
| c. Review Investment Performance Statistics | Table F2.4 ( c ) | |||
| d. Review Graphics | Table F2.4 ( d ) | |||
| e. Review Fund Statistics | Table F2.4 ( e) | |||
Sheet 2: Table 2.1
| i | Next Step | ||||||||||||||||||
| Table F2.1 General Fund Information | |||||||||||||||||||
| 1. SBIC Applicant: |
|
||||||||||||||||||
| 2. Principal (s): |
|
||||||||||||||||||
| 3. Fund Name |
|
||||||||||||||||||
| 4. Fund Location | |||||||||||||||||||
| (a) Street Address |
|
||||||||||||||||||
| (b) City, State |
|
||||||||||||||||||
| (c) Phone Number (include area code) |
|
||||||||||||||||||
| 5. Job Title(s) at This Fund |
|
||||||||||||||||||
| 6. General Fund Information | |||||||||||||||||||
| (a) Fund Status |
|
||||||||||||||||||
| (b) Date of First Portfolio Investment Closing |
|
12 | 1899 | ||||||||||||||||
| (c) Is this fund ended? (Y/N) |
|
||||||||||||||||||
| (d) Enter the date the fund was ended OR the "as of" date for |
|
2021 | |||||||||||||||||
| which the fund information will be reported, if the fund is ongoing. | |||||||||||||||||||
| (e) Except for contingent or follow-on investments, final year expected for making new |
|
||||||||||||||||||
| investments. | |||||||||||||||||||
| (f) Number of Companies Financed to Date |
|
||||||||||||||||||
| (g) Total committed capital (including participating securities leverage , if an SBIC) |
|
||||||||||||||||||
| (h) Total capital commitments released |
|
||||||||||||||||||
| 8. Very short narrative on investment strategy of prior fund, including lifecycle stages of investments | |||||||||||||||||||
| and industry sectors | |||||||||||||||||||
|
|
|||||||||||||||||||
| 9. Footnotes | |||||||||||||||||||
|
|
|||||||||||||||||||
| Next Step | |||||||||||||||||||
Sheet 3: Table 2.2 (a)
| i | #N/A | Next Step | ||||||
| Table F2.2 (a) Portfolio Data | ||||||||
| SBIC Applicant/Principal: ; | ||||||||
| Number of Investments: | ||||||||
|
|
||||||||
|
|
|
|
|
|
|
|
||
| 1 | ||||||||
| N/A | ||||||||
| N/A | ||||||||
| N/A | ||||||||
| N/A | ||||||||
| N/A | ||||||||
| N/A | ||||||||
| N/A | ||||||||
| N/A | ||||||||
| N/A | ||||||||
| N/A | ||||||||
| N/A | ||||||||
| N/A | ||||||||
| N/A | ||||||||
| N/A | ||||||||
| N/A | ||||||||
| N/A | ||||||||
| N/A | ||||||||
| N/A | ||||||||
| N/A | ||||||||
| N/A | ||||||||
| N/A | ||||||||
| N/A | ||||||||
| N/A | ||||||||
| N/A | ||||||||
| N/A | ||||||||
| N/A | ||||||||
| N/A | ||||||||
| N/A | ||||||||
| N/A | ||||||||
| N/A | ||||||||
| N/A | ||||||||
| N/A | ||||||||
| N/A | ||||||||
| N/A | ||||||||
| N/A | ||||||||
| N/A | ||||||||
| N/A | ||||||||
| N/A | ||||||||
| N/A | ||||||||
| N/A | ||||||||
| N/A | ||||||||
| N/A | ||||||||
| N/A | ||||||||
| N/A | ||||||||
| N/A | ||||||||
| N/A | ||||||||
| N/A | ||||||||
| N/A | ||||||||
| N/A | ||||||||
| N/A | ||||||||
| N/A | ||||||||
| N/A | ||||||||
| N/A | ||||||||
| N/A | ||||||||
| N/A | ||||||||
| N/A | ||||||||
| N/A | ||||||||
| N/A | ||||||||
| N/A | ||||||||
| N/A | ||||||||
| N/A | ||||||||
| N/A | ||||||||
| N/A | ||||||||
| N/A | ||||||||
| N/A | ||||||||
| N/A | ||||||||
| N/A | ||||||||
| N/A | ||||||||
| N/A | ||||||||
| N/A | ||||||||
| N/A | ||||||||
| N/A | ||||||||
| N/A | ||||||||
| N/A | ||||||||
| N/A | ||||||||
| N/A | ||||||||
| N/A | ||||||||
| N/A | ||||||||
| N/A | ||||||||
| N/A | ||||||||
| N/A | ||||||||
| N/A | ||||||||
| N/A | ||||||||
| N/A | ||||||||
| N/A | ||||||||
| N/A | ||||||||
| N/A | ||||||||
| N/A | ||||||||
| N/A | ||||||||
| N/A | ||||||||
| N/A | ||||||||
| N/A | ||||||||
| N/A | ||||||||
| N/A | ||||||||
| N/A | ||||||||
| N/A | ||||||||
| N/A | ||||||||
| N/A | ||||||||
| N/A | ||||||||
| N/A | ||||||||
| N/A | ||||||||
| N/A | ||||||||
| N/A | ||||||||
| N/A | ||||||||
| N/A | ||||||||
| N/A | ||||||||
| N/A | ||||||||
| N/A | ||||||||
| N/A | ||||||||
| N/A | ||||||||
| N/A | ||||||||
| N/A | ||||||||
| N/A | ||||||||
| N/A | ||||||||
| N/A | ||||||||
| N/A | ||||||||
| N/A | ||||||||
| N/A | ||||||||
| N/A | ||||||||
| N/A | ||||||||
| N/A | ||||||||
| N/A | ||||||||
| N/A | ||||||||
| N/A | ||||||||
| N/A | ||||||||
| N/A | ||||||||
| N/A | ||||||||
| N/A | ||||||||
| N/A | ||||||||
| N/A | ||||||||
| N/A | ||||||||
| N/A | ||||||||
| N/A | ||||||||
| N/A | ||||||||
| N/A | ||||||||
| N/A | ||||||||
| N/A | ||||||||
| N/A | ||||||||
| N/A | ||||||||
| N/A | ||||||||
| N/A | ||||||||
| N/A | ||||||||
Sheet 4: Table 2.2 (b)
| i | #N/A | Next Step | ||||||||||
| Table F2.2 (b) Portfolio Company Financing Rounds | ||||||||||||
| SBIC Applicant/Principal: ; | ||||||||||||
| You must use the same company names as those in Table F2.2. | Total Financing | $- | ||||||||||
|
|
|
|
|
Round ($) |
|
|
|
|
|
|||
Sheet 5: Table 2.2 (c)
| i | #N/A | Next Step | |||||||||
| Table F2.2 (c) Portfolio Company Realized Events (Including Write-offs) | |||||||||||
| SBIC Applicant/Principal: | |||||||||||
| Enter a separate line item for each exit/liquidation. If you had 3 separate liquidations (at separate times) of a company, then you will have 3 line items. You must use the same company names as those in Table F2.2 (a). Please note: All gross investment IRRs and multiples are calculations under Table 2.4 (a). | |||||||||||
| Totals | $- | $- | $- | $- | |||||||
|
|
of Exit |
|
|
|
|
|
|
|
Total | ||
| $- | |||||||||||
| $- | |||||||||||
| $- | |||||||||||
| $- | |||||||||||
| $- | |||||||||||
| $- | |||||||||||
| $- | |||||||||||
| $- | |||||||||||
| $- | |||||||||||
| $- | |||||||||||
| $- | |||||||||||
| $- | |||||||||||
| $- | |||||||||||
| $- | |||||||||||
| $- | |||||||||||
| $- | |||||||||||
| $- | |||||||||||
| $- | |||||||||||
| $- | |||||||||||
| $- | |||||||||||
| $- | |||||||||||
| $- | |||||||||||
| $- | |||||||||||
| $- | |||||||||||
| $- | |||||||||||
| $- | |||||||||||
| $- | |||||||||||
| $- | |||||||||||
| $- | |||||||||||
| $- | |||||||||||
| $- | |||||||||||
| $- | |||||||||||
| $- | |||||||||||
| $- | |||||||||||
| $- | |||||||||||
| $- | |||||||||||
| $- | |||||||||||
| $- | |||||||||||
| $- | |||||||||||
| $- | |||||||||||
| $- | |||||||||||
| $- | |||||||||||
| $- | |||||||||||
| $- | |||||||||||
| $- | |||||||||||
| $- | |||||||||||
| $- | |||||||||||
| $- | |||||||||||
| $- | |||||||||||
| $- | |||||||||||
| $- | |||||||||||
| $- | |||||||||||
| $- | |||||||||||
| $- | |||||||||||
| $- | |||||||||||
| $- | |||||||||||
| $- | |||||||||||
| $- | |||||||||||
| $- | |||||||||||
| $- | |||||||||||
| $- | |||||||||||
| $- | |||||||||||
| $- | |||||||||||
| $- | |||||||||||
| $- | |||||||||||
| $- | |||||||||||
| $- | |||||||||||
| $- | |||||||||||
| $- | |||||||||||
| $- | |||||||||||
| $- | |||||||||||
| $- | |||||||||||
| $- | |||||||||||
| $- | |||||||||||
| $- | |||||||||||
| $- | |||||||||||
| $- | |||||||||||
| $- | |||||||||||
| $- | |||||||||||
| $- | |||||||||||
| $- | |||||||||||
| $- | |||||||||||
| $- | |||||||||||
| $- | |||||||||||
| $- | |||||||||||
| $- | |||||||||||
| $- | |||||||||||
| $- | |||||||||||
| $- | |||||||||||
| $- | |||||||||||
| $- | |||||||||||
| $- | |||||||||||
| $- | |||||||||||
| $- | |||||||||||
| $- | |||||||||||
| $- | |||||||||||
| $- | |||||||||||
| $- | |||||||||||
| $- | |||||||||||
| $- | |||||||||||
| $- | |||||||||||
| $- | |||||||||||
| $- | |||||||||||
| $- | |||||||||||
| $- | |||||||||||
| $- | |||||||||||
| $- | |||||||||||
| $- | |||||||||||
| $- | |||||||||||
| $- | |||||||||||
| $- | |||||||||||
| $- | |||||||||||
| $- | |||||||||||
| $- | |||||||||||
| $- | |||||||||||
| $- | |||||||||||
| $- | |||||||||||
| $- | |||||||||||
| $- | |||||||||||
| $- | |||||||||||
| $- | |||||||||||
| $- | |||||||||||
| $- | |||||||||||
| $- | |||||||||||
| $- | |||||||||||
| $- | |||||||||||
| $- | |||||||||||
| $- | |||||||||||
| $- | |||||||||||
| $- | |||||||||||
| $- | |||||||||||
| $- | |||||||||||
| $- | |||||||||||
| $- | |||||||||||
| $- | |||||||||||
| $- | |||||||||||
| $- | |||||||||||
| $- | |||||||||||
| $- | |||||||||||
| $- | |||||||||||
| $- | |||||||||||
| $- | |||||||||||
| $- | |||||||||||
| $- | |||||||||||
| $- | |||||||||||
| $- | |||||||||||
| $- | |||||||||||
| $- | |||||||||||
| $- | |||||||||||
| $- | |||||||||||
| $- | |||||||||||
| $- | |||||||||||
| $- | |||||||||||
| $- | |||||||||||
| $- | |||||||||||
| $- | |||||||||||
| $- | |||||||||||
| $- | |||||||||||
| $- | |||||||||||
| $- | |||||||||||
| $- | |||||||||||
| $- | |||||||||||
| $- | |||||||||||
| $- | |||||||||||
| $- | |||||||||||
| $- | |||||||||||
| $- | |||||||||||
| $- | |||||||||||
| $- | |||||||||||
| $- | |||||||||||
| $- | |||||||||||
| $- | |||||||||||
| $- | |||||||||||
| $- | |||||||||||
| $- | |||||||||||
| $- | |||||||||||
| $- | |||||||||||
| $- | |||||||||||
| $- | |||||||||||
| $- | |||||||||||
| $- | |||||||||||
| $- | |||||||||||
| $- | |||||||||||
| $- | |||||||||||
| $- | |||||||||||
| $- | |||||||||||
| $- | |||||||||||
| $- | |||||||||||
| $- | |||||||||||
| $- | |||||||||||
| $- | |||||||||||
| $- | |||||||||||
| $- | |||||||||||
| $- | |||||||||||
| $- | |||||||||||
| $- | |||||||||||
| $- | |||||||||||
| $- | |||||||||||
| $- | |||||||||||
| $- | |||||||||||
Sheet 6: Table 2.2 (d)
| i | #N/A | #N/A | Next Step | ||||||||||||||||||||
| Table F2.2 (d) Current Status and Unrealized Portfolio Company Information | |||||||||||||||||||||||
| SBIC Applicant/Principal: ; | |||||||||||||||||||||||
| Number of Investments: | |||||||||||||||||||||||
| Enter data for each of the companies you listed in Table 2.2 (a) | |||||||||||||||||||||||
| Status of Company |
Information |
|
|
||||||||||||||||||||
| Total | $- | Total | $- | $- | Total | $- | |||||||||||||||||
|
|
|
|
|
|
|
|
|
|
|
|
|
|
|
|
|
|
|
|
|||||
| 0 | 1 | 0 | |||||||||||||||||||||
| 0 | N/A | 0 | |||||||||||||||||||||
| 0 | N/A | 0 | |||||||||||||||||||||
| 0 | N/A | 0 | |||||||||||||||||||||
| 0 | N/A | 0 | |||||||||||||||||||||
| 0 | N/A | 0 | |||||||||||||||||||||
| 0 | N/A | 0 | |||||||||||||||||||||
| 0 | N/A | 0 | |||||||||||||||||||||
| 0 | N/A | 0 | |||||||||||||||||||||
| 0 | N/A | 0 | |||||||||||||||||||||
| 0 | N/A | 0 | |||||||||||||||||||||
| 0 | N/A | 0 | |||||||||||||||||||||
| 0 | N/A | 0 | |||||||||||||||||||||
| 0 | N/A | 0 | |||||||||||||||||||||
| 0 | N/A | 0 | |||||||||||||||||||||
| 0 | N/A | 0 | |||||||||||||||||||||
| 0 | N/A | 0 | |||||||||||||||||||||
| 0 | N/A | 0 | |||||||||||||||||||||
| 0 | N/A | 0 | |||||||||||||||||||||
| 0 | N/A | 0 | |||||||||||||||||||||
| 0 | N/A | 0 | |||||||||||||||||||||
| 0 | N/A | 0 | |||||||||||||||||||||
| 0 | N/A | 0 | |||||||||||||||||||||
| 0 | N/A | 0 | |||||||||||||||||||||
| 0 | N/A | 0 | |||||||||||||||||||||
| 0 | N/A | 0 | |||||||||||||||||||||
| 0 | N/A | 0 | |||||||||||||||||||||
| 0 | N/A | 0 | |||||||||||||||||||||
| 0 | N/A | 0 | |||||||||||||||||||||
| 0 | N/A | 0 | |||||||||||||||||||||
| 0 | N/A | 0 | |||||||||||||||||||||
| 0 | N/A | 0 | |||||||||||||||||||||
| 0 | N/A | 0 | |||||||||||||||||||||
| 0 | N/A | 0 | |||||||||||||||||||||
| 0 | N/A | 0 | |||||||||||||||||||||
| 0 | N/A | 0 | |||||||||||||||||||||
| 0 | N/A | 0 | |||||||||||||||||||||
| 0 | N/A | 0 | |||||||||||||||||||||
| 0 | N/A | 0 | |||||||||||||||||||||
| 0 | N/A | 0 | |||||||||||||||||||||
| 0 | N/A | 0 | |||||||||||||||||||||
| 0 | N/A | 0 | |||||||||||||||||||||
| 0 | N/A | 0 | |||||||||||||||||||||
| 0 | N/A | 0 | |||||||||||||||||||||
| 0 | N/A | 0 | |||||||||||||||||||||
| 0 | N/A | 0 | |||||||||||||||||||||
| 0 | N/A | 0 | |||||||||||||||||||||
| 0 | N/A | 0 | |||||||||||||||||||||
| 0 | N/A | 0 | |||||||||||||||||||||
| 0 | N/A | 0 | |||||||||||||||||||||
| 0 | N/A | 0 | |||||||||||||||||||||
| 0 | N/A | 0 | |||||||||||||||||||||
| 0 | N/A | 0 | |||||||||||||||||||||
| 0 | N/A | 0 | |||||||||||||||||||||
| 0 | N/A | 0 | |||||||||||||||||||||
| 0 | N/A | 0 | |||||||||||||||||||||
| 0 | N/A | 0 | |||||||||||||||||||||
| 0 | N/A | 0 | |||||||||||||||||||||
| 0 | N/A | 0 | |||||||||||||||||||||
| 0 | N/A | 0 | |||||||||||||||||||||
| 0 | N/A | 0 | |||||||||||||||||||||
| 0 | N/A | 0 | |||||||||||||||||||||
| 0 | N/A | 0 | |||||||||||||||||||||
| 0 | N/A | 0 | |||||||||||||||||||||
| 0 | N/A | 0 | |||||||||||||||||||||
| 0 | N/A | 0 | |||||||||||||||||||||
| 0 | N/A | 0 | |||||||||||||||||||||
| 0 | N/A | 0 | |||||||||||||||||||||
| 0 | N/A | 0 | |||||||||||||||||||||
| 0 | N/A | 0 | |||||||||||||||||||||
| 0 | N/A | 0 | |||||||||||||||||||||
| 0 | N/A | 0 | |||||||||||||||||||||
| 0 | N/A | 0 | |||||||||||||||||||||
| 0 | N/A | 0 | |||||||||||||||||||||
| 0 | N/A | 0 | |||||||||||||||||||||
| 0 | N/A | 0 | |||||||||||||||||||||
| 0 | N/A | 0 | |||||||||||||||||||||
| 0 | N/A | 0 | |||||||||||||||||||||
| 0 | N/A | 0 | |||||||||||||||||||||
| 0 | N/A | 0 | |||||||||||||||||||||
| 0 | N/A | 0 | |||||||||||||||||||||
| 0 | N/A | 0 | |||||||||||||||||||||
| 0 | N/A | 0 | |||||||||||||||||||||
| 0 | N/A | 0 | |||||||||||||||||||||
| 0 | N/A | 0 | |||||||||||||||||||||
| 0 | N/A | 0 | |||||||||||||||||||||
| 0 | N/A | 0 | |||||||||||||||||||||
| 0 | N/A | 0 | |||||||||||||||||||||
| 0 | N/A | 0 | |||||||||||||||||||||
| 0 | N/A | 0 | |||||||||||||||||||||
| 0 | N/A | 0 | |||||||||||||||||||||
| 0 | N/A | 0 | |||||||||||||||||||||
| 0 | N/A | 0 | |||||||||||||||||||||
| 0 | N/A | 0 | |||||||||||||||||||||
| 0 | N/A | 0 | |||||||||||||||||||||
| 0 | N/A | 0 | |||||||||||||||||||||
| 0 | N/A | 0 | |||||||||||||||||||||
| 0 | N/A | 0 | |||||||||||||||||||||
| 0 | N/A | 0 | |||||||||||||||||||||
| 0 | N/A | 0 | |||||||||||||||||||||
| 0 | N/A | 0 | |||||||||||||||||||||
| 0 | N/A | 0 | |||||||||||||||||||||
| 0 | N/A | 0 | |||||||||||||||||||||
| 0 | N/A | 0 | |||||||||||||||||||||
| 0 | N/A | 0 | |||||||||||||||||||||
| 0 | N/A | 0 | |||||||||||||||||||||
| 0 | N/A | 0 | |||||||||||||||||||||
| 0 | N/A | 0 | |||||||||||||||||||||
| 0 | N/A | 0 | |||||||||||||||||||||
| 0 | N/A | 0 | |||||||||||||||||||||
| 0 | N/A | 0 | |||||||||||||||||||||
| 0 | N/A | 0 | |||||||||||||||||||||
| 0 | N/A | 0 | |||||||||||||||||||||
| 0 | N/A | 0 | |||||||||||||||||||||
| 0 | N/A | 0 | |||||||||||||||||||||
| 0 | N/A | 0 | |||||||||||||||||||||
| 0 | N/A | 0 | |||||||||||||||||||||
| 0 | N/A | 0 | |||||||||||||||||||||
| 0 | N/A | 0 | |||||||||||||||||||||
| 0 | N/A | 0 | |||||||||||||||||||||
| 0 | N/A | 0 | |||||||||||||||||||||
| 0 | N/A | 0 | |||||||||||||||||||||
| 0 | N/A | 0 | |||||||||||||||||||||
| 0 | N/A | 0 | |||||||||||||||||||||
| 0 | N/A | 0 | |||||||||||||||||||||
| 0 | N/A | 0 | |||||||||||||||||||||
| 0 | N/A | 0 | |||||||||||||||||||||
| 0 | N/A | 0 | |||||||||||||||||||||
| 0 | N/A | 0 | |||||||||||||||||||||
| 0 | N/A | 0 | |||||||||||||||||||||
| 0 | N/A | 0 | |||||||||||||||||||||
| 0 | N/A | 0 | |||||||||||||||||||||
| 0 | N/A | 0 | |||||||||||||||||||||
| 0 | N/A | 0 | |||||||||||||||||||||
| 0 | N/A | 0 | |||||||||||||||||||||
| 0 | N/A | 0 | |||||||||||||||||||||
| 0 | N/A | 0 | |||||||||||||||||||||
| 0 | N/A | 0 | |||||||||||||||||||||
| 0 | N/A | 0 | |||||||||||||||||||||
| 0 | N/A | 0 | |||||||||||||||||||||
| 0 | N/A | 0 | |||||||||||||||||||||
| 0 | N/A | 0 | |||||||||||||||||||||
| 0 | N/A | 0 | |||||||||||||||||||||
Sheet 7: Table 2.2 (e)
| i | #N/A | Next Step | |||||||||||||||||
| Table F2.2 (e) Company Involvement | |||||||||||||||||||
| SBIC Applicant/Principal: ; | SBIC Applicant/Principal: ; | ||||||||||||||||||
| Number of Investments: | Number of Investments: | ||||||||||||||||||
|
|
|
||||||||||||||||||
| Count | 0 | 0 | 0 | 0 | 0 | 0 | 0 | 0 | 0 | 0 | 0 | 0 | 0 | 0 | 0 | ||||
|
|
|
|
|
|
|
|
|
|
|
Pre-Investment Role |
|
|
|
|
|
|
Post-Investment Role |
||
| N/A | - | ||||||||||||||||||
| N/A | - | ||||||||||||||||||
| N/A | - | ||||||||||||||||||
| N/A | - | ||||||||||||||||||
| N/A | - | ||||||||||||||||||
| N/A | - | ||||||||||||||||||
| N/A | - | ||||||||||||||||||
| N/A | - | ||||||||||||||||||
| N/A | - | ||||||||||||||||||
| N/A | - | ||||||||||||||||||
| N/A | - | ||||||||||||||||||
| N/A | - | ||||||||||||||||||
| N/A | - | ||||||||||||||||||
| N/A | - | ||||||||||||||||||
| N/A | - | ||||||||||||||||||
| N/A | - | ||||||||||||||||||
| N/A | - | ||||||||||||||||||
| N/A | - | ||||||||||||||||||
| N/A | - | ||||||||||||||||||
| N/A | - | ||||||||||||||||||
| N/A | - | ||||||||||||||||||
| N/A | - | ||||||||||||||||||
| N/A | - | ||||||||||||||||||
| N/A | - | ||||||||||||||||||
| N/A | - | ||||||||||||||||||
| N/A | - | ||||||||||||||||||
| N/A | - | ||||||||||||||||||
| N/A | - | ||||||||||||||||||
| N/A | - | ||||||||||||||||||
| N/A | - | ||||||||||||||||||
| N/A | - | ||||||||||||||||||
| N/A | - | ||||||||||||||||||
| N/A | - | ||||||||||||||||||
| N/A | - | ||||||||||||||||||
| N/A | - | ||||||||||||||||||
| N/A | - | ||||||||||||||||||
| N/A | - | ||||||||||||||||||
| N/A | - | ||||||||||||||||||
| N/A | - | ||||||||||||||||||
| N/A | - | ||||||||||||||||||
| N/A | - | ||||||||||||||||||
| N/A | - | ||||||||||||||||||
| N/A | - | ||||||||||||||||||
| N/A | - | ||||||||||||||||||
| N/A | - | ||||||||||||||||||
| N/A | - | ||||||||||||||||||
| N/A | - | ||||||||||||||||||
| N/A | - | ||||||||||||||||||
| N/A | - | ||||||||||||||||||
| N/A | - | ||||||||||||||||||
| N/A | - | ||||||||||||||||||
| N/A | - | ||||||||||||||||||
| N/A | - | ||||||||||||||||||
| N/A | - | ||||||||||||||||||
| N/A | - | ||||||||||||||||||
| N/A | - | ||||||||||||||||||
| N/A | - | ||||||||||||||||||
| N/A | - | ||||||||||||||||||
| N/A | - | ||||||||||||||||||
| N/A | - | ||||||||||||||||||
| N/A | - | ||||||||||||||||||
| N/A | - | ||||||||||||||||||
| N/A | - | ||||||||||||||||||
| N/A | - | ||||||||||||||||||
| N/A | - | ||||||||||||||||||
| N/A | - | ||||||||||||||||||
| N/A | - | ||||||||||||||||||
| N/A | - | ||||||||||||||||||
| N/A | - | ||||||||||||||||||
| N/A | - | ||||||||||||||||||
| N/A | - | ||||||||||||||||||
| N/A | - | ||||||||||||||||||
| N/A | - | ||||||||||||||||||
| N/A | - | ||||||||||||||||||
| N/A | - | ||||||||||||||||||
| N/A | - | ||||||||||||||||||
| N/A | - | ||||||||||||||||||
| N/A | - | ||||||||||||||||||
| N/A | - | ||||||||||||||||||
| N/A | - | ||||||||||||||||||
| N/A | - | ||||||||||||||||||
| N/A | - | ||||||||||||||||||
| N/A | - | ||||||||||||||||||
| N/A | - | ||||||||||||||||||
| N/A | - | ||||||||||||||||||
| N/A | - | ||||||||||||||||||
| N/A | - | ||||||||||||||||||
| N/A | - | ||||||||||||||||||
| N/A | - | ||||||||||||||||||
| N/A | - | ||||||||||||||||||
| N/A | - | ||||||||||||||||||
| N/A | - | ||||||||||||||||||
| N/A | - | ||||||||||||||||||
| N/A | - | ||||||||||||||||||
| N/A | - | ||||||||||||||||||
| N/A | - | ||||||||||||||||||
| N/A | - | ||||||||||||||||||
| N/A | - | ||||||||||||||||||
| N/A | - | ||||||||||||||||||
| N/A | - | ||||||||||||||||||
| N/A | - | ||||||||||||||||||
| N/A | - | ||||||||||||||||||
| N/A | - | ||||||||||||||||||
| N/A | - | ||||||||||||||||||
| N/A | - | ||||||||||||||||||
| N/A | - | ||||||||||||||||||
| N/A | - | ||||||||||||||||||
| N/A | - | ||||||||||||||||||
| N/A | - | ||||||||||||||||||
| N/A | - | ||||||||||||||||||
| N/A | - | ||||||||||||||||||
| N/A | - | ||||||||||||||||||
| N/A | - | ||||||||||||||||||
| N/A | - | ||||||||||||||||||
| N/A | - | ||||||||||||||||||
| N/A | - | ||||||||||||||||||
| N/A | - | ||||||||||||||||||
| N/A | - | ||||||||||||||||||
| N/A | - | ||||||||||||||||||
| N/A | - | ||||||||||||||||||
| N/A | - | ||||||||||||||||||
| N/A | - | ||||||||||||||||||
| N/A | - | ||||||||||||||||||
| N/A | - | ||||||||||||||||||
| N/A | - | ||||||||||||||||||
| N/A | - | ||||||||||||||||||
| N/A | - | ||||||||||||||||||
| N/A | - | ||||||||||||||||||
| N/A | - | ||||||||||||||||||
| N/A | - | ||||||||||||||||||
| N/A | - | ||||||||||||||||||
| N/A | - | ||||||||||||||||||
| N/A | - | ||||||||||||||||||
| N/A | - | ||||||||||||||||||
| N/A | - | ||||||||||||||||||
| N/A | - | ||||||||||||||||||
| N/A | - | ||||||||||||||||||
| N/A | - | ||||||||||||||||||
| N/A | - | ||||||||||||||||||
| N/A | - | ||||||||||||||||||
| N/A | - | ||||||||||||||||||
| N/A | - | ||||||||||||||||||
| N/A | - | ||||||||||||||||||
Sheet 8: Table 2.3
| i | Next Step | |||||||||||||||
| Table F2.3 Overall Fund Cashflows | ||||||||||||||||
| SBIC Applicant/Principal: ; | ||||||||||||||||
| 1. Calculate Residual Value | ||||||||||||||||
| + Value of Investments | $- | Totaled from Table 2.2 (d) | ||||||||||||||
| + a. Cash and Cash Equivalents | ||||||||||||||||
| - b. Liabilities | Enter as a positive number. Include any SBA Leverage, money owed for management/fund expenses and carried interest. | |||||||||||||||
| Gross Residual Value | $- | |||||||||||||||
| - c. Residual Value Going to Carry | Enter the amount of carried interest as a positive number you would receive if you were to exit your investments at the current value of your holdings, as identified in Table 2.2 (d) |
|||||||||||||||
| Net Residual Value | $- | |||||||||||||||
| 2. By Year Investor Cash Flows, Expenses, and Other Revenues | ||||||||||||||||
| Non-released Commitments | $- | From Table 2.1, calculated as 6(g) Total Capital Commitments - 6(h) Total Capital Commitments Released | ||||||||||||||
| (a) Investor Cashflows and Residual Value | (b) Other Items | |||||||||||||||
| i) Amount of Takedown/ Paid-in Capital | ii) Distribution Information | i) Mgt and Fund Expenses | ii) Carried Interest on Distributions | iii) Other Revenues | ||||||||||||
| Year | Amount of Distribution | Cash | Non-cash | Net Residual Value | Investor Net Cashflows | Company Financing $ | Total Proceeds | Balance sheet cost of investments | ||||||||
| Total | $- | $- | $- | $- | $- | $- | $- | $- | $- | $- | ||||||
| 1899 | $- | $- | $- | $- | $- | $- | ||||||||||
| 1900 | $- | $- | $- | $- | $- | $- | ||||||||||
| 1901 | $- | $- | $- | $- | $- | $- | ||||||||||
| 1902 | $- | $- | $- | $- | $- | $- | ||||||||||
| 1903 | $- | $- | $- | $- | $- | $- | ||||||||||
| 1904 | $- | $- | $- | $- | $- | $- | ||||||||||
| 1905 | $- | $- | $- | $- | $- | $- | ||||||||||
| 1906 | $- | $- | $- | $- | $- | $- | ||||||||||
| 1907 | $- | $- | $- | $- | $- | $- | ||||||||||
| 1908 | $- | $- | $- | $- | $- | $- | ||||||||||
| 1909 | $- | $- | $- | $- | $- | $- | ||||||||||
| 1910 | $- | $- | $- | $- | $- | $- | ||||||||||
| 1911 | $- | $- | $- | $- | $- | $- | ||||||||||
| 1912 | $- | $- | $- | $- | $- | $- | ||||||||||
| 1913 | $- | $- | $- | $- | $- | $- | ||||||||||
| 1914 | $- | $- | $- | $- | $- | $- | ||||||||||
| 1915 | $- | $- | $- | $- | $- | $- | ||||||||||
| 1916 | $- | $- | $- | $- | $- | $- | ||||||||||
| 1917 | $- | $- | $- | $- | $- | $- | ||||||||||
| 1918 | $- | $- | $- | $- | $- | $- | ||||||||||
| 1919 | $- | $- | $- | $- | $- | $- | ||||||||||
| Commitments Not Drawn | $- | |||||||||||||||
| 3. Cash Remaining for Follow-on, New Investments, and Management Expenses = | ||||||||||||||||
| + Investor Commitments Not Drawn | $- | |||||||||||||||
| + a. Cash and Cash Equivalents | $- | |||||||||||||||
| - b. Liabilities | $- | |||||||||||||||
| Cash and Commitments Remaining | $- | |||||||||||||||
| Amount | Cash Balance | |||||||||||||||
| 4. Commitments outstanding to portfolio companies not yet funded | $- | |||||||||||||||
| 5. Reserves for follow-on investments not committed | $- | |||||||||||||||
| 6. Reserves for future management fees | $- | |||||||||||||||
| Capital Available for New investments | $- | |||||||||||||||
| 7. Fund Performance Calculations | ||||||||||||||||
| Your Fund | Venture Avg for VY 1899 | |||||||||||||||
| FUND IRR | Err:523 | #N/A | ||||||||||||||
| RESIDUAL VALUE TO PAID IN CAPITAL | #DIV/0! | |||||||||||||||
| DISTRIBUTIONS TO PAID IN CAPITAL | #DIV/0! | #N/A | ||||||||||||||
| TOTAL VALUE TO PAID IN CAPITAL | #DIV/0! | |||||||||||||||
Sheet 9: Table 2.4 (a)
| i | Next Step | IRR Guess | -90% | Next Step | ||||||||||||||||||||||||||||
| Table F2.4 (a) Portfolio Summary | ||||||||||||||||||||||||||||||||
| SBIC Applicant/Principal: ; | ||||||||||||||||||||||||||||||||
| Number of Investments: | ||||||||||||||||||||||||||||||||
| Portfolio Company Overview | Gains (Loss) | Performance Metrics based on Current Values | Net Cashflows with residual values | |||||||||||||||||||||||||||||
| Company |
|
|
Fund Lead Status | Total Financing Costs | Percent of Cost | Total Cash & Non-Cash Proceeds | Cost Basis of Proceeds | Residual Value | Residual Cost | Realized | Unrealized | Total | Realized Gains | Realized Losses | IRR | Residual Value to Residual Cost | Distributions to Total Cost | Residual Value to Total Cost | Total Value to Cost Multiple | Year of Initial Investment | Last Year Exited | Projected/Actual year to Exit | Years to Exit | |||||||||
| TOTALS | $- | 0% | $- | $- | $- | $- | $- | $- | $- | Gross Pool | Err:523 | #DIV/0! | 0.00 | 0.00 | 0.00 | 0 | 0 | 0 | 0.00 | |||||||||||||
| Average | #DIV/0! | #DIV/0! | #DIV/0! | #DIV/0! | #DIV/0! | #DIV/0! | #DIV/0! | #DIV/0! | ||||||||||||||||||||||||
| Cpt Wgt Avg | 0.0% | 0.00 | 0.00 | 0.00 | 0.00 | |||||||||||||||||||||||||||
| Median | #VALUE! | #VALUE! | #VALUE! | #VALUE! | #VALUE! | #VALUE! | #VALUE! | #VALUE! | ||||||||||||||||||||||||
Sheet 10: Table 2.4 (b)
| i | Next Step | |||||||||||||||||||||||||||
| Table F2.4 (b) Portfolio Financing Statistics | ||||||||||||||||||||||||||||
| SBIC Applicant/Principal: ; | ||||||||||||||||||||||||||||
| Gross Financing/Investment Statistics (Before Expenses) | ||||||||||||||||||||||||||||
| Number of Portfolio Companies | 0 | |||||||||||||||||||||||||||
| Number of Financings | #VALUE! | |||||||||||||||||||||||||||
| Total Cost of Investments | $- | |||||||||||||||||||||||||||
| Distribution of Individual Financings by Dollar Size | ||||||||||||||||||||||||||||
| From | To | Total Financing Dollars | % of Financing Dollars | Number of Financings | % of Financings | |||||||||||||||||||||||
| 1 | $- | #VALUE! | #VALUE! | #VALUE! | #VALUE! | #VALUE! | ||||||||||||||||||||||
| 2 | #VALUE! | #VALUE! | #VALUE! | #VALUE! | #VALUE! | #VALUE! | ||||||||||||||||||||||
| 3 | #VALUE! | #VALUE! | #VALUE! | #VALUE! | #VALUE! | #VALUE! | ||||||||||||||||||||||
| 4 | #VALUE! | $- | #VALUE! | #VALUE! | #VALUE! | #VALUE! | ||||||||||||||||||||||
| Total | #VALUE! | #VALUE! | #VALUE! | #VALUE! | ||||||||||||||||||||||||
| Median Financing Size | #VALUE! | Maximum | $- | Smallest | $- | |||||||||||||||||||||||
| Distribution of Company Financings by Dollar Size | ||||||||||||||||||||||||||||
| From | To | Total Financing Dollars | % of Financing Dollars | Number of Companies | % of Companies | |||||||||||||||||||||||
| 1 | $- | #VALUE! | #VALUE! | #VALUE! | #VALUE! | #VALUE! | ||||||||||||||||||||||
| 2 | #VALUE! | #VALUE! | #VALUE! | #VALUE! | #VALUE! | #VALUE! | ||||||||||||||||||||||
| 3 | #VALUE! | #VALUE! | #VALUE! | #VALUE! | #VALUE! | #VALUE! | ||||||||||||||||||||||
| 4 | #VALUE! | $- | #VALUE! | #VALUE! | #VALUE! | #VALUE! | ||||||||||||||||||||||
| Total | #VALUE! | #VALUE! | #VALUE! | #VALUE! | ||||||||||||||||||||||||
| Median Company Financing Size | #VALUE! | Maximum | $- | Smallest | $- | |||||||||||||||||||||||
| Distribution of Exit Mechanisms Utilized | ||||||||||||||||||||||||||||
| Exit Mechanism | Total Financing Dollars (Cost) | % of Financing Dollars | Number of Exit Events | % of Exits | Total Proceeds | % of Proceeds | ||||||||||||||||||||||
| 1 | Sale | $- | #DIV/0! | 0 | #DIV/0! | $- | #DIV/0! | |||||||||||||||||||||
| 2 | IPO | $- | #DIV/0! | 0 | #DIV/0! | $- | #DIV/0! | |||||||||||||||||||||
| 3 | Write-off | $- | #DIV/0! | 0 | #DIV/0! | $- | #DIV/0! | |||||||||||||||||||||
| 4 | Merger/Acquisition | $- | #DIV/0! | 0 | #DIV/0! | $- | #DIV/0! | |||||||||||||||||||||
| 5 | Distress | $- | #DIV/0! | 0 | #DIV/0! | $- | #DIV/0! | |||||||||||||||||||||
| 6 | Recap | $- | #DIV/0! | 0 | #DIV/0! | $- | #DIV/0! | |||||||||||||||||||||
| 7 | MBO (including ESOPs) | $- | #DIV/0! | 0 | #DIV/0! | $- | #DIV/0! | |||||||||||||||||||||
| 8 | Loan Repayment | $- | #DIV/0! | 0 | #DIV/0! | $- | #DIV/0! | |||||||||||||||||||||
| Total | $- | #DIV/0! | 0 | #DIV/0! | $- | #DIV/0! | ||||||||||||||||||||||
| Total | ||||||||||||||||||||||||||||
| Distribution of Company Financings by Stage/Life Cycle | ||||||||||||||||||||||||||||
| Stage | Total Financing Dollars | % of Financing Dollars | Number of Companies | % of Companies | Proceeds ($) | % of Proceeds | Residual Values ($) | Residual Cost ($) | Multiple of Cost | Basis of Cost of Proceeds | Realized Gains (Losses) | Unrealized Gains (Losses) | Total Gains (Losses) | Realized Gains | Realized Losses | |||||||||||||
| 1 | Later | $- | #DIV/0! | 0 | #DIV/0! | $- | #DIV/0! | $- | $- | - | $- | $- | $- | $- | Later | $- | $- | |||||||||||
| 2 | Early | $- | #DIV/0! | 0 | #DIV/0! | $- | #DIV/0! | $- | $- | - | $- | $- | $- | $- | Early | $- | $- | |||||||||||
| 3 | Expansion | $- | #DIV/0! | 0 | #DIV/0! | $- | #DIV/0! | $- | $- | - | $- | $- | $- | $- | Expansion | $- | $- | |||||||||||
| 4 | Seed | $- | #DIV/0! | 0 | #DIV/0! | $- | #DIV/0! | $- | $- | - | $- | $- | $- | $- | Seed | $- | $- | |||||||||||
| 5 | Change of Control | $- | #DIV/0! | 0 | #DIV/0! | $- | #DIV/0! | $- | $- | - | $- | $- | $- | $- | Change of Control | $- | $- | |||||||||||
| 6 | Turn Around | $- | #DIV/0! | 0 | #DIV/0! | $- | #DIV/0! | $- | $- | - | $- | $- | $- | $- | Turn Around | $- | $- | |||||||||||
| Total | $- | #DIV/0! | 0 | #DIV/0! | $- | #DIV/0! | $- | $- | - | $- | $- | $- | $- | |||||||||||||||
| By Industry | ||||||||||||||||||||||||||||
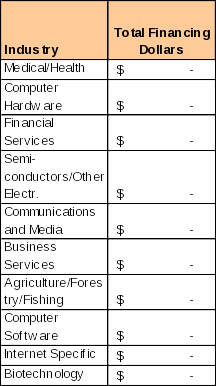
| Industry | Total Financing Dollars | % of Financing Dollars | Number of Companies | % of Companies | Proceeds ($) | % of Proceeds | Residual Values ($) | Residual Cost ($) | Multiple of Cost | Basis of Cost of Proceeds | Realized Gains (Losses) | Unrealized Gains (Losses) | Total Gains (Losses) | Realized Gains | Realized Losses | |||||||||||||
| 1 | Medical/Health | $- | #DIV/0! | 0 | #DIV/0! | $- | #DIV/0! | $- | $- | - | $- | $- | $- | $- | Medical/Health | $- | $- | |||||||||||
| 2 | Computer Hardware | $- | #DIV/0! | 0 | #DIV/0! | $- | #DIV/0! | $- | $- | - | $- | $- | $- | $- | Computer Hardware | $- | $- | |||||||||||
| 3 | Financial Services | $- | #DIV/0! | 0 | #DIV/0! | $- | #DIV/0! | $- | $- | - | $- | $- | $- | $- | Financial Services | $- | $- | |||||||||||
| 4 | Semi-conductors/Other Electr. | $- | #DIV/0! | 0 | #DIV/0! | $- | #DIV/0! | $- | $- | - | $- | $- | $- | $- | Semi-conductors/Other Electr. | $- | $- | |||||||||||
| 5 | Communications and Media | $- | #DIV/0! | 0 | #DIV/0! | $- | #DIV/0! | $- | $- | - | $- | $- | $- | $- | Communications and Media | $- | $- | |||||||||||
| 6 | Business Services | $- | #DIV/0! | 0 | #DIV/0! | $- | #DIV/0! | $- | $- | - | $- | $- | $- | $- | Business Services | $- | $- | |||||||||||
| 7 | Agriculture/Forestry/Fishing | $- | #DIV/0! | 0 | #DIV/0! | $- | #DIV/0! | $- | $- | - | $- | $- | $- | $- | Agriculture/Forestry/Fishing | $- | $- | |||||||||||
| 8 | Computer Software | $- | #DIV/0! | 0 | #DIV/0! | $- | #DIV/0! | $- | $- | - | $- | $- | $- | $- | Computer Software | $- | $- | |||||||||||
| 9 | Internet Specific | $- | #DIV/0! | 0 | #DIV/0! | $- | #DIV/0! | $- | $- | - | $- | $- | $- | $- | Internet Specific | $- | $- | |||||||||||
| 10 | Biotechnology | $- | #DIV/0! | 0 | #DIV/0! | $- | #DIV/0! | $- | $- | - | $- | $- | $- | $- | Biotechnology | $- | $- | |||||||||||
| 11 | Manufacturing | $- | #DIV/0! | 0 | #DIV/0! | $- | #DIV/0! | $- | $- | - | $- | $- | $- | $- | Manufacturing | $- | $- | |||||||||||
| 12 | Computer Other | $- | #DIV/0! | 0 | #DIV/0! | $- | #DIV/0! | $- | $- | - | $- | $- | $- | $- | Computer Other | $- | $- | |||||||||||
| 13 | Consumer Related | $- | #DIV/0! | 0 | #DIV/0! | $- | #DIV/0! | $- | $- | - | $- | $- | $- | $- | Consumer Related | $- | $- | |||||||||||
| 14 | Industrial/Energy | $- | #DIV/0! | 0 | #DIV/0! | $- | #DIV/0! | $- | $- | - | $- | $- | $- | $- | Industrial/Energy | $- | $- | |||||||||||
| 15 | Transportation | $- | #DIV/0! | 0 | #DIV/0! | $- | #DIV/0! | $- | $- | - | $- | $- | $- | $- | Transportation | $- | $- | |||||||||||
| 16 | Construction | $- | #DIV/0! | 0 | #DIV/0! | $- | #DIV/0! | $- | $- | - | $- | $- | $- | $- | Construction | $- | $- | |||||||||||
| 17 | Utilities | $- | #DIV/0! | 0 | #DIV/0! | $- | #DIV/0! | $- | $- | - | $- | $- | $- | $- | Utilities | $- | $- | |||||||||||
| 18 | Other | $- | #DIV/0! | 0 | #DIV/0! | $- | #DIV/0! | $- | $- | - | $- | $- | $- | $- | Other | $- | $- | |||||||||||
| $- | #DIV/0! | 0 | #DIV/0! | $- | #DIV/0! | $- | $- | - | $- | $- | $- | $- | ||||||||||||||||
| By Geographic Region | ||||||||||||||||||||||||||||
| Region | Total Financing Dollars | % of Financing Dollars | Number of Companies | % of Companies | Proceeds ($) | % of Proceeds | Residual Values ($) | Residual Cost ($) | Multiple of Cost | Basis of Cost of Proceeds | Realized Gains (Losses) | Unrealized Gains (Losses) | Total Gains (Losses) | Realized Gains | Realized Losses | |||||||||||||
| 1 | Southeast | $- | #DIV/0! | 0 | #DIV/0! | $- | #DIV/0! | $- | $- | - | $- | $- | $- | $- | Southeast | $- | $- | |||||||||||
| 2 | Mid-Atlantic | $- | #DIV/0! | 0 | #DIV/0! | $- | #DIV/0! | $- | $- | - | $- | $- | $- | $- | Mid-Atlantic | $- | $- | |||||||||||
| 3 | Southwest | $- | #DIV/0! | 0 | #DIV/0! | $- | #DIV/0! | $- | $- | - | $- | $- | $- | $- | Southwest | $- | $- | |||||||||||
| 4 | Northwest | $- | #DIV/0! | 0 | #DIV/0! | $- | #DIV/0! | $- | $- | - | $- | $- | $- | $- | Northwest | $- | $- | |||||||||||
| 5 | MidCentral | $- | #DIV/0! | 0 | #DIV/0! | $- | #DIV/0! | $- | $- | - | $- | $- | $- | $- | MidCentral | $- | $- | |||||||||||
| 5 | Northeast | $- | #DIV/0! | 0 | #DIV/0! | $- | #DIV/0! | $- | $- | - | $- | $- | $- | $- | Northeast | $- | $- | |||||||||||
| 7 | Other/Non-US | $- | #DIV/0! | 0 | #DIV/0! | $- | #DIV/0! | $- | $- | - | $- | $- | $- | $- | Other/Non-US | $- | $- | |||||||||||
| $- | #DIV/0! | 0 | #DIV/0! | $- | #DIV/0! | $- | $- | - | $- | $- | $- | $- | ||||||||||||||||
| By Fund Lead Status | ||||||||||||||||||||||||||||
| Fund Lead Status | Total Financing Dollars | % of Financing Dollars | Number of Companies | % of Companies | Proceeds ($) | % of Proceeds | Residual Values ($) | Residual Cost ($) | Multiple of Cost | Basis of Cost of Proceeds | Realized Gains (Losses) | Unrealized Gains (Losses) | Total Gains (Losses) | Realized Gains | Realized Losses | |||||||||||||
| 1 | Sole VC Investor | $- | #DIV/0! | 0 | #DIV/0! | $- | #DIV/0! | $- | $- | - | $- | $- | $- | $- | Sole VC Investor | $- | $- | |||||||||||
| 2 | Syndicate Lead | $- | #DIV/0! | 0 | #DIV/0! | $- | #DIV/0! | $- | $- | - | $- | $- | $- | $- | Syndicate Lead | $- | $- | |||||||||||
| 3 | Syndicate Participant | $- | #DIV/0! | 0 | #DIV/0! | $- | #DIV/0! | $- | $- | - | $- | $- | $- | $- | Syndicate Participant | $- | $- | |||||||||||
| 4 | Syndicate Co-Lead | $- | #DIV/0! | 0 | #DIV/0! | $- | #DIV/0! | $- | $- | - | $- | $- | $- | $- | Syndicate Co-Lead | $- | $- | |||||||||||
| 5 | Other | $- | #DIV/0! | 0 | #DIV/0! | $- | #DIV/0! | $- | $- | - | $- | $- | $- | $- | Other | $- | $- | |||||||||||
| $- | #DIV/0! | 0 | #DIV/0! | $- | #DIV/0! | $- | $- | - | $- | $- | $- | $- | ||||||||||||||||
| By Financial Status | ||||||||||||||||||||||||||||
| Financial Status | Total Financing Dollars | % of Financing Dollars | Number of Companies | % of Companies | Proceeds ($) | % of Proceeds | Residual Values ($) | Residual Cost ($) | Multiple of Cost | Basis of Cost of Proceeds | Realized Gains (Losses) | Unrealized Gains (Losses) | Total Gains (Losses) | Realized Gains | Realized Losses | |||||||||||||
| 1 | Above | $- | #DIV/0! | 0 | #DIV/0! | $- | #DIV/0! | $- | $- | - | $- | $- | $- | $- | $- | $- | ||||||||||||
| 2 | Loss | $- | #DIV/0! | 0 | #DIV/0! | $- | #DIV/0! | $- | $- | - | $- | $- | $- | $- | $- | $- | ||||||||||||
| 3 | Total Loss | $- | #DIV/0! | 0 | #DIV/0! | $- | #DIV/0! | $- | $- | - | $- | $- | $- | $- | $- | $- | ||||||||||||
| 4 | Flat | $- | #DIV/0! | 0 | #DIV/0! | $- | #DIV/0! | $- | $- | - | $- | $- | $- | $- | $- | $- | ||||||||||||
| $- | #DIV/0! | 0 | #DIV/0! | $- | #DIV/0! | $- | $- | - | $- | $- | $- | $- | ||||||||||||||||
Sheet 11: Table 2.4 (c)
| i | Next Step | |||||||||||||||||||||||||
| Table F2.4 (c) Portfolio Company Performance Statistics | ||||||||||||||||||||||||||
| SBIC Applicant/Principal: ; | ||||||||||||||||||||||||||
| Gross Financing/Investment Statistics (Before Expenses) | ||||||||||||||||||||||||||
| Total Cost of Investments | $- | Gross IRR (Includes Residual Value) | Err:523 | |||||||||||||||||||||||
| Total Distributions/Proceeds from Investments | $- | |||||||||||||||||||||||||
| Total Residual Value of Investments | $- | Distributions to Total Cost/Financing | 0.00 | |||||||||||||||||||||||
| Distributions + Residual Value - Cost | $- | Residual Value to Total Cost | 0.00 | |||||||||||||||||||||||
| Total Value to Total Cost | 0.00 | |||||||||||||||||||||||||
| Cost Basis for Investment Proceeds | $- | |||||||||||||||||||||||||
| Total Realized Gains (Losses) | $- | Residual Value to Residual Cost | #DIV/0! | |||||||||||||||||||||||
| By Stage/Life Cycle | ||||||||||||||||||||||||||
| Averages | ||||||||||||||||||||||||||
| Stage | Realized Gains (Losses) | Unrealized Gains | Total Realized & Unrealized Gains | IRR | Distributions to Total Costs | Residual Value to Total Cost | Total Value to Total Cost | Residual Value to Residual Costs | Years to Exit | |||||||||||||||||
| 1 | Seed | $- | $- | $- | 0.0% | - | - | - | - | - | ||||||||||||||||
| 2 | Early | $- | $- | $- | 0.0% | - | - | - | - | - | ||||||||||||||||
| 3 | Expansion | $- | $- | $- | 0.0% | - | - | - | - | - | ||||||||||||||||
| 4 | Later | $- | $- | $- | 0.0% | - | - | - | - | - | ||||||||||||||||
| 5 | Change of Control | $- | $- | $- | 0.0% | - | - | - | - | - | ||||||||||||||||
| 6 | Turn Around | $- | $- | $- | 0.0% | - | - | - | - | - | ||||||||||||||||
| Total | $- | $- | $- | |||||||||||||||||||||||
| By Industry | ||||||||||||||||||||||||||
| Averages | ||||||||||||||||||||||||||
| Industry | Realized Gains (Losses) | Unrealized Gains (Losses) | Total Gains (Losses) | IRR | Distributions to Total Costs | Residual Value to Total Cost | Total Value to Total Cost | Residual Value to Residual Costs | Years to Exit | |||||||||||||||||
| 1 | Communications and Media | $- | $- | $- | 0.0% | - | - | - | - | - | ||||||||||||||||
| 2 | Internet Specific | $- | $- | $- | 0.0% | - | - | - | - | - | ||||||||||||||||
| 3 | Computer Hardware | $- | $- | $- | 0.0% | - | - | - | - | - | ||||||||||||||||
| 4 | Computer Software | $- | $- | $- | 0.0% | - | - | - | - | - | ||||||||||||||||
| 5 | Computer Other | $- | $- | $- | 0.0% | - | - | - | - | - | ||||||||||||||||
| 6 | Semi-conductors/Other Electr. | $- | $- | $- | 0.0% | - | - | - | - | - | ||||||||||||||||
| 7 | Biotechnology | $- | $- | $- | 0.0% | - | - | - | - | - | ||||||||||||||||
| 8 | Medical/Health | $- | $- | $- | 0.0% | - | - | - | - | - | ||||||||||||||||
| 9 | Consumer Related | $- | $- | $- | 0.0% | - | - | - | - | - | ||||||||||||||||
| 10 | Industrial/Energy | $- | $- | $- | 0.0% | - | - | - | - | - | ||||||||||||||||
| 11 | Transportation | $- | $- | $- | 0.0% | - | - | - | - | - | ||||||||||||||||
| 12 | Financial Services | $- | $- | $- | 0.0% | - | - | - | - | - | ||||||||||||||||
| 13 | Business Services | $- | $- | $- | 0.0% | - | - | - | - | - | ||||||||||||||||
| 14 | Manufacturing | $- | $- | $- | 0.0% | - | - | - | - | - | ||||||||||||||||
| 15 | Agriculture/Forestry/Fishing | $- | $- | $- | 0.0% | - | - | - | - | - | ||||||||||||||||
| 16 | Construction | $- | $- | $- | 0.0% | - | - | - | - | - | ||||||||||||||||
| 17 | Utilities | $- | $- | $- | 0.0% | - | - | - | - | - | ||||||||||||||||
| 18 | Other | $- | $- | $- | 0.0% | - | - | - | - | - | ||||||||||||||||
| $- | $- | $- | ||||||||||||||||||||||||
| By Geographic Region | ||||||||||||||||||||||||||
| Averages | ||||||||||||||||||||||||||
| Region | Realized Gains (Losses) | Unrealized Gains (Losses) | Total Gains (Losses) | IRR | Distributions to Total Costs | Residual Value to Total Cost | Total Value to Total Cost | Residual Value to Residual Costs | Years to Exit | |||||||||||||||||
| 1 | Northeast | $- | $- | $- | 0.0% | - | - | - | - | - | ||||||||||||||||
| 2 | Northwest | $- | $- | $- | 0.0% | - | - | - | - | - | ||||||||||||||||
| 3 | Mid-Atlantic | $- | $- | $- | 0.0% | - | - | - | - | - | ||||||||||||||||
| 4 | Southeast | $- | $- | $- | 0.0% | - | - | - | - | - | ||||||||||||||||
| 5 | Southwest | $- | $- | $- | 0.0% | - | - | - | - | - | ||||||||||||||||
| 6 | MidCentral | $- | $- | $- | 0.0% | - | - | - | - | - | ||||||||||||||||
| 7 | Other/Non-US | $- | $- | $- | 0.0% | - | - | - | - | - | ||||||||||||||||
| $- | $- | $- | ||||||||||||||||||||||||
| By Fund Lead Status | ||||||||||||||||||||||||||
| Averages | ||||||||||||||||||||||||||
| Fund Lead Status | Realized Gains (Losses) | Unrealized Gains (Losses) | Total Gains (Losses) | IRR | Distributions to Total Costs | Residual Value to Total Cost | Total Value to Total Cost | Residual Value to Residual Costs | Years to Exit | |||||||||||||||||
| 1 | Syndicate Lead | $- | $- | $- | 0.0% | - | - | - | - | - | ||||||||||||||||
| 2 | Syndicate Co-Lead | $- | $- | $- | 0.0% | - | - | - | - | - | ||||||||||||||||
| 3 | Syndicate Participant | $- | $- | $- | 0.0% | - | - | - | - | - | ||||||||||||||||
| 4 | Sole VC Investor | $- | $- | $- | 0.0% | - | - | - | - | - | ||||||||||||||||
| 5 | Other | $- | $- | $- | 0.0% | - | - | - | - | - | ||||||||||||||||
| $- | $- | $- | ||||||||||||||||||||||||
| By Financial Status | ||||||||||||||||||||||||||
| Averages | ||||||||||||||||||||||||||
| Financial Status | Realized Gains (Losses) | Unrealized Gains (Losses) | Total Gains (Losses) | IRR | Distributions to Total Costs | Residual Value to Total Cost | Total Value to Total Cost | Residual Value to Residual Costs | Years to Exit | |||||||||||||||||
| 1 | Above | $- | $- | $- | 0.0% | - | - | - | - | - | ||||||||||||||||
| 2 | Flat | $- | $- | $- | 0.0% | - | - | - | - | - | ||||||||||||||||
| 3 | Loss | $- | $- | $- | 0.0% | - | - | - | - | - | ||||||||||||||||
| 4 | Total Loss | $- | $- | $- | 0.0% | - | - | - | - | - | ||||||||||||||||
| $- | $- | $- | Average | |||||||||||||||||||||||
Sheet 12: Table 2.4 (d)
| i | Next Step | |||||||||||||||||||||||||
| Table F2.4 (d) Graphics | ||||||||||||||||||||||||||
| SBIC Applicant/Principal: ; | ||||||||||||||||||||||||||
| PORTFOLIO INVESTMENTS BY FINANCIAL STATUS | ||||||||||||||||||||||||||

|
||||||||||||||||||||||||||
| Total Number of Investments | 0 | Total Financing Costs to Date | $- | |||||||||||||||||||||||
|
|
|||||||||||||||||||||||||
| PORTFOLIO COMPANIES BY REGION | 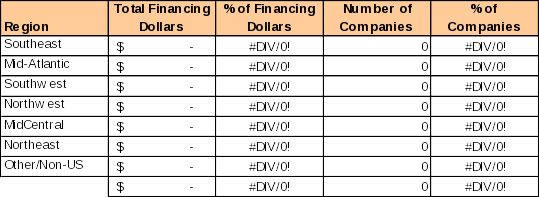
|
|||||||||||||||||||||||||
| Total Number of Investments | 0 | Total Financing Costs to Date | $- | |||||||||||||||||||||||
|
|
|||||||||||||||||||||||||
| PORTFOLIO INVESTMENTS BY COMPANY | ||||||||||||||||||||||||||
| Total Financing Costs to Date | $- | Total Proceeds | $- | Total Realized Gains (Losses) | $- | |||||||||||||||||||||
|
|
|||||||||||||||||||||||||
| Legend of top 14 companies by cost. | ||||||||||||||||||||||||||
|
||||||||||||||||||||||||||
| PORTFOLIO INVESTMENTS BY INDUSTRY | ||||||||||||||||||||||||||
| Total Financing Costs to Date | $- | Total Proceeds | $- | Total Realized Gains (Losses) | $- | |||||||||||||||||||||
|
|
|||||||||||||||||||||||||
| PORTFOLIO INVESTMENTS BY STAGE | ||||||||||||||||||||||||||
|
|
|
||||||||||||||||||||||||
| PORTFOLIO INVESTMENTS BY FUND LEAD STATUS | ||||||||||||||||||||||||||
|
|
|
||||||||||||||||||||||||
| Legend of Stages | ||||||||||||||||||||||||||

|
||||||||||||||||||||||||||


Sheet 13: Table 2.4 (e)
| i | |||||||||||||||||||||||||||||
| Table F2.4(e) - Overall Fund Statistics | As of Date: | 12/1899 | |||||||||||||||||||||||||||
| SBIC Applicant/Principal: ; | Number of Investments: | 0 | |||||||||||||||||||||||||||
| FUND SUMMARY STATISTICS | |||||||||||||||||||||||||||||
| Net Financing/Investment Statistics (After Management Expenses) | |||||||||||||||||||||||||||||
| Total Takedowns/Paid-In Capital | $- | ||||||||||||||||||||||||||||
| Total Distributions (After Carry) | $- | ||||||||||||||||||||||||||||
| Total Residual Value | $- | ||||||||||||||||||||||||||||
| Distributions + Residual - Take-downs | $- | ||||||||||||||||||||||||||||
| Venture Comparison | |||||||||||||||||||||||||||||
| Net IRR (Includes Residual Value) | Err:523 | #N/A | |||||||||||||||||||||||||||
| Distributions to Paid In Capital | #DIV/0! | #N/A | |||||||||||||||||||||||||||
| Residual Value to Paid in Capital | #DIV/0! | ||||||||||||||||||||||||||||
| Total Value to Paid in Capital | #DIV/0! | ||||||||||||||||||||||||||||
| Vintage Year of Fund | |||||||||||||||||||||||||||||
| Age of Fund (Years After Start or until closed) | #VALUE! | ||||||||||||||||||||||||||||
| Years to Payback | #DIV/0! | ||||||||||||||||||||||||||||
| Total Management Fees and Carry | |||||||||||||||||||||||||||||
| Management Fees | $- | ||||||||||||||||||||||||||||
| Carried Interest | $- | ||||||||||||||||||||||||||||
| Residual Value Carry | $- | ||||||||||||||||||||||||||||
| Total | $- | ||||||||||||||||||||||||||||
| Principal's Activity | |||||||||||||||||||||||||||||
| Pre-Investment | Post-Investment | ||||||||||||||||||||||||||||
| Deal Lead | Top Ranking Officer Replaced | ||||||||||||||||||||||||||||
| Deal Co-Lead | Board of Directors | ||||||||||||||||||||||||||||
| Deal Source | Committees | ||||||||||||||||||||||||||||
| Financial Analysis | Exit Process | ||||||||||||||||||||||||||||
| Market Research | Workouts, etc.. | ||||||||||||||||||||||||||||
| Lead Due Diligence | Officer of the company | ||||||||||||||||||||||||||||
| Investment Committee | |||||||||||||||||||||||||||||
| Negotiation | |||||||||||||||||||||||||||||
| Closing | |||||||||||||||||||||||||||||
Sheet 14: File Name Help
| File Name Help | Return to Instructions | ||||||||||||
| Select type of Exhibit | 2 |
F2 | Complete | Complete | Exhibit F2 - Complete.xls | If you were with a venture fund for the entire fund's life or if fund is still ongoing. | |||||||
| F3 | Partial | Partial | Exhibit F3 - Partial.xls | If you were with a venture fund for only part of the fund's timeframe. | |||||||||
| 10 character name acronym identifying your applicant name | New Ven II | F4 | Synthesized | Syn | Exhibit F4 - Synthesized.xls | Groups of separate investments not done within a single venture fund. Investments must be at least $250,000 by total company financing OR a minimum of $100,000 with a board seat. | |||||||
| F5 | Other | Other | Exhibit F5 - Other.xls | All other investments. | |||||||||
| First Year of Investment for this Fund or Group | 1994 | ||||||||||||
| First and last name initials for each principal for which the workbook applies (separated by commas) | |||||||||||||
| TJ | |||||||||||||
| Date when this report was prepared | 9/30/2003 | ||||||||||||
| Resulting File Name: | F3-New Ven II; Partial1994; TJ; 20030930.xls | ||||||||||||
| F3-New Ven II; Partial1994; TJ; 20030930.xls | |||||||||||||
| File Type | application/vnd.ms-excel |
| Author | TMJamers |
| Last Modified By | CBRich |
| File Modified | 2007-04-04 |
| File Created | 2003-10-20 |
© 2026 OMB.report | Privacy Policy