Label Comp Study Power Analysis
Label Comp. Study Power Analysis ( Revision).DOC
Label Comprehension Study
LABEL COMP STUDY POWER ANALYSIS
OMB: 0910-0612
Power Analysis
The power of the study will be determined to detect a significant difference in the “proportion of correct response” for each of the 2 primary questions on the 2 independent surveys that will be compared. First question 1 of Questionnaire 1.a with question 1 of Questionnaire 1.b will be compared. After revisions to the proposed labeling based on the results of Questionnaires 1.b and other comments received on the proposed labeling, a new survey will be conducted using Questionnaire 2. After the results are obtained, questions 1 and 7 of Questionnaires 1.b and 2 will be compared. These comparisons on the primary questions will be performed using 2-sample comparisons of proportions using Fisher Exact Test. Since the power will be more conservative (lower) for the 2nd comparison with 2 questions, the power will be determined for this comparison.
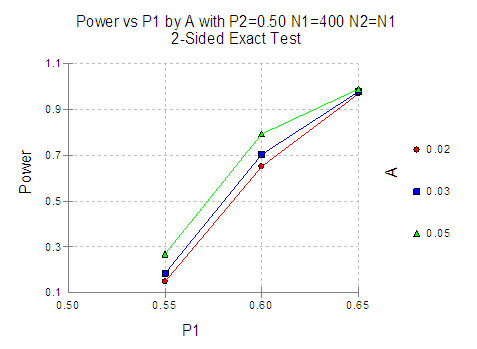
To obtain the approximate power of the study comparing the 2 questions for the 2 independent surveys for Questionnaires 1b. and 2., the following information is needed: estimates for the proportions of correct response, sample size of the study (400 per survey questionnaire), the test used to analyze the data (Fisher’s Exact test), two-sided significance level of the test (0.05), and a multiple comparison approach (Bonferroni since it is most conservative and will give lowest power). Since we don’t have “estimates” for the proportions of correct response for these 2 questions, we will assume a proportion of 50% for the 2 questions and we will use the Bonferoni adjustment for multiplicity (i.e., the 2 questions). This will provide the most conservative situation for calculating the power, and thus, give a lower bound power estimate for a 2-sample test of proportions given a sample size of 400 per study arm. Given this particular situation (a 50% proportion), the lower bound on the power for detecting 10% and 15% differences in the 2 groups will be approximately 70% and 95%, respectively. If a less conservative and possibly more realistic correct proportion of 70% correct is used, then the power increases to 83% and 99%, respectively. Therefore, this study of 400 subjects per arm should have, for most situations, greater than 80% power to detect a 10% or greater difference in proportion of correct response. It will have even greater power to detect a difference of 10% for the first comparison (questionnaires 1.a and 1.b) since this comparison only involves 1 primary comparison. Note that that it has very little power to detect a 5% difference for any of the comparisons. Power curves for these situations are given below.
Power Curves for Control = 0.5


| File Type | application/msword |
| Author | Tamara Wirt |
| Last Modified By | DPresley |
| File Modified | 2007-10-09 |
| File Created | 2007-10-09 |
© 2026 OMB.report | Privacy Policy