Justification Part B
Justification Part B.doc
User Satisfaction with Access to Government Information and Services at Public Libraries and Public Access Computing Centers
OMB: 3137-0070
Supporting Statement for Paperwork Reduction Act Submissions
All methods adhere to the Office of Management and Budget’s Standards and Guidelines for Statistical Surveys (September 2006).
B. Collection of Information Employing Statistical Methods
The following offers a detailed explanation of the statistical methodology of data collection and analysis for three surveys: national telephone survey, library and public access computing center survey, and the trainers of trainers survey. All methods adhere to the Office of Management and Budget’s Standards and Guidelines for Statistical Surveys (September 2006), from here on referred to as the code.
National Sample Telephone Survey
The purpose of the national telephone survey is to provide information about users, access, and uses of government information at the federal, state, and local level. Only 22% of the general population is considered to be low-access, defined as those who have never used the Internet or e-mail and do not live in Internet-connected households.2 A special stratum of 450 pre-identified low-access individuals will be surveyed with an extended instrument in order to better meet the goals of the study, thereby over-sampling this special population of interest (Table 1). Any individuals who are determined to be low-access in the main instrument will also be given the extended instrument.
Table 1—National and Pre-Identified Low-Access Populations Sampling Frame
Survey |
Universe |
Sample |
Completed Interviews |
Expected Response Rate |
National Telephone Survey |
201,200,000 |
6,666 |
2,000 |
30% |
Low Access National Sample |
44,264,000 |
2,376 (including low-access obtained from national sample) |
900 |
38%* |
*The expected response rate is 55% for the pre-identified low-access sample and 30% for the low-access individuals in the general population.
The method of household selection used for the general population will be random digit dialing within the continental United States in order to obtain a representative random sample, including households with unlisted telephone numbers. In accordance with section 3.2 of the code, all response rates will be calculated using weighted and unweighted measures, and item response rates will also be calculated to account for item non-response. Since the projected response rates are less than 70%, an analysis to determine if non-respondents are random will be conducted on the whole and at the item-level by estimating bias of respondents using percentages from respondent demographics and census data. In accordance with section 4.1 of the code, and in order to reduce non-response bias and increase the value of survey data, the national sample will be post-stratified to match national parameters for sex, age, education, race, and Hispanic origin, as taken from the U.S. Census.3
The pre-identified sample of low-access individuals mentioned above will be derived from previously conducted Pew surveys that identified these respondents. Over-sampling this subgroup of interest will give the final analysis more power in regards to inter-group comparisons due to the larger sample size.
A degree of accuracy is needed in order to permit generalizations to the general population and to be able to compare those in the general population with access to those who are low-access. In compliance with section 1.3 of the code, we assume the national household survey will elicit a response equivalent to that which Pew usually receives for national surveys, 30% (Table 1). We expect that the response rate for the low-access sub-sample will be 55%, because these individuals have been previously contacted and agreeable in past surveys regarding Internet access (Table 1). These response estimates were suggested by Pew based on their success with national telephone surveys and telephone interviews with the pre-identified low-access population.
Table 2 shows 95 percent confidence intervals for sample proportions (50%, 70% or 30%, 90% or 10%) estimated from the national sample (n=2000) of the general population. Table 3 shows 95 percent confidence intervals for sample proportions (50%, 70% or 30%, 90% or 10%) estimated from the sub-sample (n=1,560) of the general population who are non-low access individuals. Assumptions necessary for the estimation calculations seen in Tables 2 and 3 include: a normal distribution, a large enough sample size, and homogeneity of variance between the two sample groups.
Table 2—National Sample Sampling Assumptions

Table 3—National Non Low-Access Sampling Assumptions

The sampling assumptions of the national sample (n=2000) include a confidence level of 95% and a response rate of 30%. Assuming a rate of occurrence in the sample of 50%, the standard error for whole universe estimates will not exceed 1.118% for the national sample (Table 2) and not exceed 1.266% for non-low access individuals in the general population (Table 3). These conditions afford a 95% confidence limit of ±2.191% for the general population (Table 2) and ±2.481% for non-low access users in the general population (Table 3). The sampling assumptions for rates of occurrence of 70% or 30% and 90% or 10% are also displayed in both Table 2 and 3.
Table 4 shows 95 percent intervals for sample proportions estimated from the combined low access samples, i.e., pre-identified low-access individuals (n=450) and those occurring in the national sample (n=440).
The sampling assumptions of low-access individuals in the national sample and the pre-identified low-access users sample include a confidence level of 95% and a response rate of 30% for the national survey and 50% for low-access user sub-sample. The worst possible scenario affords a standard error of 1.676% and a 95% confidence limit of ±3.285% (Table 4). The sampling assumptions for rates of occurrence of 70% or 30% and 90% or 10% are also displayed in Table 4.
Table 4—Pre-Identified Low-Access Populations Sampling Assumptions

In compliance with section 1.3 of the code, methods to maximize response rate for the national sample include the use of expertly trained interviewers as well as the over-sampling of our study population. We also chose to use a pre-identified list of cooperative low-access individuals for our specialized sample. The rate of response of these individuals should be greater than that of the general population since they were willing to provide information in the past. The sampling assumptions that define the differences between low-access users from the national sample and from the pre-identified sub-sample are defined in Table 5.
Table 5—Standard Error of the Difference Between Low-Access Users From National Sample and Low-Access Users From Pre-Identified Special Low-Access Users Sub-Sample.

The standard error of the difference between low-access users from the two samples affords a maximum of 3.352% in the worst case scenario of 50:50 (Table 5). As with the other charts, 30:70 and 10:90 distributions are also displayed.
The national survey instrument was carefully designed and refined through literature review and discussion with significant sources, in compliance with sections 1.1-1.2 of the code. The first of such sources was Randall Pinkett, who has worked extensively within Camfield Estates, a primarily African-American housing community, to set up high-speed Internet access and classes to develop computer skills. His advice was invaluable when it came to learning about how low-income people access information, and he also provided some insights into how he framed his user questionnaire for low-access individuals. Subsequently, roundtable discussions with local information providers (librarians, government officials, public health providers, etc.) were held to learn more about the information gathering strategies and referral processes that low-income persons employ and experience. We were also able to refine the specific categories of government information we had initially drafted based on the input from people in the field.
Once the preliminary instrument was designed, in compliance with section 1.4 of the code, it was put through a series of field tests. The instrument was put into a Web-based entry system to guide interviewers through the process. Interviewers at the Library Research Center (LRC) were trained how to properly administer the survey before telephoning a random sample of local phone numbers from the 2006 Champaign/St. Joseph/Savoy & Urbana Illinois Yellow pages. The interviewers successfully completed nine interviews for each instrument in order to stay within the OMB limits of testing before OMB approval. The feedback from the interviewers helped to further refine the structure and wording of the instrument in order to elicit more accurate results with a higher participation rate. After modification, the instrument was then sent on to Pew and Lee Rainie, Ph.D., for further testing which included another pretest with a sample of nine respondents. The pretest interviews were monitored by Pew staff and conducted using experienced interviewers who can best judge the quality of the answers given and the degree to which respondents understand the questions. After the pretest, Pew made the necessary alterations to the questionnaire. The main telephone survey will be administered by Pew and overseen by Lee Rainie, Ph.D., in consultation with Leigh Estabrook, Ph.D.
In compliance with section 2.3 and 3.3 of the code, data collection will utilize highly experienced and trained telephone interviewers that will use a computer assisted telephone interviewing (CATI) system in order to ensure valid and accurate collection of survey data. In compliance with section 3.4 of the code, the respondents’ phone number, the only individually identifying piece of information, will not be recorded or in any way attached to the respondents’ survey results.
The purpose of the national telephone survey is to provide information about users, access, and uses of government information at the federal, state, and local level. These measures will collectively describe the user needs and be used to evaluate whether or not these needs are being met by public access computing centers, public libraries, and trainers of instructors. The research being conducted is exploratory in nature and is groundbreaking in its investigation of user satisfaction with access to government information on a national scale.
The data obtained from the instrument fall into four major categories: descriptive information regarding the transaction, outcome perceptions of transaction, perceptions of government and community, and demographic information.
Information gathered regarding the government information transaction includes: type of government information sought (Q4, Q9, Q10, and Q43), sources of government information (Q3, Q11, Q12, Q13), modes of information retrieval (Q2, Q14, Q15, Q22, Q37, Q43, Q46, Q47), details about information retrieval from libraries (Q16, Q17, Q18, Q34, Q36a), and details about information retrieval from public access computing center (Q23, Q24, Q25, Q26, Q27, Q28, Q34, Q36).
Outcome perceptions of the transaction include satisfaction with the mode of retrieval (Q19, Q20, Q21) and success of search (Q29, Q30, Q31). Opinion of government and community include trust in government (Q39) and others (Q38), community perception (Q1), and privacy concerns (Q32, Q33). In addition to standard demographic information (D1-D12), Internet and computer use (Q5, Q6a, Q6b, Q7, Q8, Q8b, Q44a, Q44b, Q45a, Q45b, Q45c, Q45d, Q45e, Q45f, Q45g) and perception of technology (Q41, Q42) are addressed in this instrument.
Basic demographic information is included because the literature indicates they are significant predictors of Internet use.2 This study will be the first to define and quantify the types of government information the public is seeking,4 as well as the success of these searches. Satisfaction with government information is shown to be highly associated with demographic variables.4
Personal characteristics of the respondents will also be measured and used as independent variables in regard to our outcome measures of mode and type of information sought. The respondent characteristics used include trust in people, perception of information overloading, perception of computers, media modality preferences, community satisfaction, and trust in government.
Level of access will also be used as an indicator variable. The general description of low-access will be used to identify three different levels of access in users as defined by Pew. These three access levels will be used to test the validity of our instrument against past Pew instruments as well. Access definitions range from highly wired (those with a T1 line, wireless connection, or DSL-enabled phone lines or a cable modem who are Internet users) to moderate users (who have a dial-up connection in the house but may or may not be Internet users) to the truly off-line (who have never used the Internet/e-mail and are not Internet-connected at home).2 These categories are a starting point for describing the various levels of access and may be broken down further after data collection depending on the distribution of persons within those groups.
Analysis of the national survey will begin with frequency tables, appropriate univariate measures, and item response rate for the entire instrument. Then we will weight the sample based on census information and recreate the frequencies with weighting. These weights will allow our data take on parameters of a distribution much like the US census, thus allowing us to use parametric tests for hypotheses testing. Several of the questions within the instrument are Pew trends questions, specifically: Q1, Q2, Q3, Q5, Q6a, Q6b, Q8, Q8b, Q15, Q35, Q38, Q39, Q41, Q42, Q43, Q44a, Q45a, Q45b, Q45c, Q45e, Q45g, Q47, web-A and D1-D12. The trend data for the Pew trend questions will be given to the Library Research Center for trend analysis and comparison with the data collected via the national telephone survey. The trend measures will be used to discuss changes over time as well as to demonstrate the validity of the responses as compared to recent trends. FIPs codes will also be given to the researchers so geo-spatial analysis will be available to enrich the other results of the survey. One such example of use will be to determine the effect of distance from a public library on the respondents’ perceptions and use of public libraries.
The researchers hypothesize the following:
There will be significant differences between the three Internet access level groups.
There will be significant differences in the type of government information sought, demographics, Internet and computer use, perception of technology, community and government perceptions, and security opinions between groups that have different preferred modes of information delivery.
There will be significant differences in demographics, Internet and computer use, perception of technology, type of information sought, and mode of retrieval between groups that report different levels of successful information retrieval.
There will be significant differences in demographics, Internet and computer use, perception of technology, type of information sought, and mode of retrieval between groups that report different levels of satisfaction with information retrieval transaction.
There will be significant differences in demographics, Internet and computer use, perception of technology, type of information sought, and mode of retrieval between groups that report different types of government information sought.
There will be significant differences between low-access subgroups who use libraries and those that do not use libraries.
There will be significant differences between low-access subgroups who use public access computing centers and those that do not.
Low-access individuals are significantly less likely to use public access computing centers.
Low-access individuals are significantly less likely to use libraries.
The researchers hypothesize that demographic characteristics, including geographic location and “low-access,” will affect the type of information being accessed, the preferred and utilized mode of delivery, where the information is accessed, reasons for utilizing the specific mode and place of access, satisfaction with the information transaction, and success of search. In order to test these hypotheses, parametric and nonparametric statistical tests will be employed to determine if significant differences between the demographic groups exist. Most of the variables in the instrument are nominal or ordinal variables and thus will require non-parametric tests to test the significance of the differences between the groups. Since there is only one sample for the tests, contingency tables will be produced and a chi-square test will be used. There are no ratio measures. Age will be post-coded into four age-ranges in order to create an ordinal-level variable. Interval-level data will be tested using a t-test (z-test where K=2). We will not be able to reject the null hypotheses for all tests where p>.05 and we will reject the null hypothesis for all tests where p<=.05.
In order to test the hypotheses, parametric and nonparametric statistical tests and scatter plots will be employed to determine if significant differences between the groups exist. Most of the variables in the instrument are nominal or ordinal variables and thus will require non-parametric tests to test the significance of the differences between the groups. Since there is only one sample for the tests, a chi-square test will be used. Two-tailed tests will be used for hypotheses H1-H7 and one-tailed tests will be used for H8 and H9. For trend purposes, Pew’s age ranges of 18-29, 30-49, 50-64, and 65 and over will be used.2 Interval-level data will be tested using a t-test (z-test where K=2). All tests will use a significance level of .05 or less.
Due to the possibility of interaction between the significant covariates and a desire to test the directionality and strength of the variables, multivariate statistical analysis will be used to further test hypotheses that have two or more separately significant covariates. Since none of the hypotheses have more than one criterion variable, dependence analysis can be used for all multivariate analyses.
H1, H4, and H5 will utilize regression analysis with dummy variables. H1, H2, and H3 will utilize discriminate analysis. Hypotheses H6-H9 will utilize binomial logistic regression. H1, H3, and H4 will utilize Spearman’s Rank Correlation or binomial regression depending on the distribution of results. H2 and H5 will utilize discriminate analysis or binomial regression depending on the distribution of results.
It is hypothesized that the type of government information being accessed will affect the respondents’ success, satisfaction, and mode of delivery of the information retrieved. Questions have been pre-tested that identify user information in the context of a “major event,” where these major events will map back to the predefined categories of government information used in the librarian/public access computing center and trainers surveys for further analyses described in the Final Analyses section.
Many of the questions in the national phone survey will be enriched by the data gathered in the other surveys described in the following sections. Types of government information accessed, preferred and utilized mode of delivery of government information, use, satisfaction, and success of government information retrieval from a public library and/or public access computing center are some of the variables in the national survey which will be used to supplement analysis of the other surveys conducted.
This portion of the project was designed in consultation with or under the direct supervision of Edward Lakner, Ph.D. (LRC); Lee Rainie, Ph.D. (Pew); Leigh Estabrook, Ph.D. (LRC); and Megan Mustafoff, MS (LRC).
Public Access Computing Center/Public Library Survey
The primary purpose of the public access computing center/librarian survey is to determine the frequency and scope of training, formal or otherwise, available to the public from public access computing centers and public libraries. In addition, the instrument will assess the depth and frequency of program evaluations. Sources of training for trainers will also be surveyed in order to define the study population of the trainers of trainers survey discussed in the next section.
Table 6—Public Access Computing Center and Library Sampling Frame
Type of Provider |
Universe |
Sample |
Expected Response Rate |
Public Access Computing Sites |
3,066 |
1500 |
70% |
Public Libraries serving populations over 100,000 |
5085 |
508 |
70% |
Public Libraries serving populations 100,000 to 5,000 |
4,7135 |
692 |
70% |
Public Depository Libraries |
1,242 |
300 |
70% |
In accordance with section 2.1 of the code, the sample of public libraries will be stratified according to the size of the libraries’ legal service area.6 The universe listing used for this sample is the 2004 Federal State Cooperative System (FSCS) annual directory of public libraries published by the National Center for Education Statistics.5 The sample will include 100% (N=508) of libraries serving populations over 100,000 identified in the 2004 FSCS.5 Taking a census of these libraries is imperative to generalize results to the majority of the US population because 58.91% (N=286,720,441) of citizens in legal service areas are covered by these libraries which represent only 5.52% of the public library universe (N=9,208).
For medium-sized public libraries, those serving populations of between 5,000 and 100,000, a systematic random sample of 692 public libraries will be selected from the 2004 FSCS.5 Medium-sized libraries represent around 22% of the public library universe (Table 6).
Libraries serving populations under 5,000 are highly homogenous and serve only 2.86% of U.S. citizens. It is more efficient and informative to concentrate resources on larger libraries that offer more varied services and serve a collective 97% of the US population that live in a legal library service area.
The proposed sampling procedure6 of public libraries assures that a representative sample will be selected from the public library universe.
The sample of public depository libraries will be a random sample of 300 libraries, almost 25% of the 1,242 public depository libraries in the universe listing. The universal listing is taken from the Federal Depository Library Directory available from the Government Printing Office’s (GPO) Web site.7 For purposes of this study we will be taking a random sample of 300 federal depository libraries for inclusion in the public library survey.
Table 7—Public Library Sampling Assumptions


Table 7 describes the sampling assumptions, confidence limits, and standard error (for percentages) of the two strata of the public library sample, in accordance with section 5.1 of the code. Libraries serving over 100,000 persons will have a standard error of 1.454% in the worst case scenario, assuming a rate of occurrence of 50%. The 95% confidence limit in this same scenario is ± 2.849%. Rates of occurrence as high or low as 90% or 10% afford more favorable precision as demonstrated in Table 7. Overall the standard error will not exceed 1.454% for this stratum. Since this stratum is a census, issues of sample estimation should not be problematic; however, issues of non-response may come into play.
Medium-sized libraries serving populations 100,000 to 5,000 will have a maximum standard error of 2.152% and a 95% confidence limit of ± 4.218% in the worst theoretical case (using the sample portioning 50:50). Alternative scenarios are calculated in Table 7 for comparison; however, a rate of occurrence of 50% is used for calculation maximum values of standard error.
Table 8—Federal Depository Sampling Assumptions

Federal depository libraries will have a maximum standard error of 3.146%, and at most a 95% confidence limit of ± 6.167%. Again, alternative scenarios are calculated in Table 8 for scenario comparisons.
All libraries will be mailed a first-class paper invitation on Institute of Museum and Library Science (IMLS) letterhead as well as a pre-coded paper survey with a pre-paid return envelope. Administering a paper survey to public libraries is preferable to a Web-based survey because it matches their preferred modality. The letter will be addressed to the library director or current director as listed in the 2006 Public Library Data Service Directory (PLDS)8 and the 2005 American Library Directory9 for libraries not listed in the PLDS. The 2006 PLDS will be used for current library address and director information. The cover letter will include the Web address of the online version of the survey in order to give the respondent more response options in an effort to ease burden.
In compliance with section 2.3 and 3.3 of the code, all surveys returned by mail will be subject to “double data entry,” where responses from each paper survey questionnaire are entered and reviewed separately by independent coders. The files are then subject to an item-by-item comparison which lists the ID number and variable name for all items where the entered values do not match. By resolving data inconsistencies, survey data sets are produced that are virtually error-free.
In accordance with section 3.2 of the code, all response rates will be calculated using weighted and unweighted measures, and item response rates will also be calculated to account for item non-response. If the actual response rates are less than 70%, an analysis to determine if non-respondents are random will be conducted on the whole and at the item-level by estimating bias of respondents using percentages from respondent demographics and the 2004 Federal State Cooperative System (FSCS)5 annual directory of public libraries. In accordance with section 4.1 of the code, and in order to reduce non-response bias and increase the value of survey data, the national sample will be post-stratified to match national parameters for sex, age, education, race, and Hispanic origin, as taken from the U.S. Census.3
The testing of the library survey was conducted to comply with section 1.4 of the code. The survey was sent via first class mail to five public libraries in the state of Illinois. The library directors were contacted by phone within two weeks of the initial mailing in order to elicit suggestions and comments to help strengthen the instrument. Dr. Leigh Estabrook recommended these libraries based on her professional knowledge that these library directors would offer constructive feedback.
In compliance with section 2.1 of the code, it is proposed to draw a sample of 1,500 public access computing centers. The universe of public access computing centers is defined as all sites listed in the Community Technology Center Network (CTCnet)10 and in HUD’s Neighborhood Networks member directory.11 In total, there 3,303 public access computing sites listed between these two directories, and 3,066 are non-duplicated between the two lists. We propose to take all 1,292 non-duplicated sites listed in CTCnet and sample of 208 of the unduplicated sites from HUD’s Neighborhood Network because we are interested in CTCs in all locations, not just those found in housing developments. Therefore, HUD will be used to supplement the CTCnet list (Table 9). Duplicate sites were left out of the HUD’s Neighborhood Network population since the contact information was more timely and complete in CTCnet’s directory.
Table 9

This survey will be sent out electronically, and, due to the absence of e-mail addresses from HUD’s Neighborhood Network on-line directory, we will only take a sample of sites from that directory. The sample of Neighborhood Network sites requires extensive searches to find valid e-mail addresses. In addition, as invalid e-mail addresses are discarded from the CTCnet universe, after an attempt to find a valid e-mail address, the sample taken from Neighborhood Network sites will be proportionally increased to account for these lost cases. These two lists were chosen to represent the universe of public access computing centers after consultation with Randall Pinkett, Ph.D.; Paul Adams, Director of Prairienet; and a review of literature of current public access computing center member directories available. Due to lack of expert information at the time the proposal was developed, this methodology has been modified from what was originally proposed.
The public access computing center survey will only be administered as a Web-based survey. Due to the nature of public access computing centers, high turnover of volunteers is a strong possibility; thus, a double notification method is preferred. Public access computing center directors will be sent an e-mail invitation and mailed a first-class paper invitation on Library Research Center letterhead.
Administering a Web-based survey to computing centers is preferable to a paper survey because it matches their preferred modality. In compliance with section 2.3 and 3.1 of the code, this Web-based survey will minimize data entry errors and work as a data editing mechanism since only the respondent will be entering data. To minimize entry error from the respondent, validation rules have been applied where appropriate to survey fields. For example, only numbers are allowed in numeric fields. In addition to validation rules, logic checks and infallible skip patterns built into the Web collection system will increase valid and reliable reporting of data. For example, if a center indicates it does not offer any tutorials on finding government information, they will be unable to indicate the topics covered in the tutorials and the evaluation measures used for tutorials.
Table 10—Public Access Computing Center Sampling Assumptions

In compliance with section 2.1 of the code, Table 10 describes the sampling assumptions, confidence limits, and standard error for the public access computing center universe. A confidence limit of ±2.453% with a standard error of at most 1.251% can be expected for this sample.
In order to comply with section 1.4 of the code, the pre-testing of the public access computing center survey included sending the survey via e-mail to six public access computing sites. These public access computing centers were chosen based on the expert advice of Paul Adams, director of Prairienet. In compliance with section 1.4 of the code, these public access computing centers were chosen for pre-testing because they are very active in their communities and are located in different regions throughout the nation, which results in a more representative testing sample. The public access computing center directors were again contacted by phone within two weeks of the initial mailing in order to elicit further suggestions and comments to help strengthen the instrument.
The purpose of the public access computing center and public library survey is to provide information about the frequency and scope of training, and depth and frequency of program evaluations available within the U.S. These measures will collectively describe the current state of government information help provided to users of public access computing centers and public libraries.
Public Access Computing Center Analysis
The data obtained from these surveys will be analyzed separately for public libraries and for public access computing centers. The data obtained from the public access computing center instrument falls into several categories: mode of government information training available (Q12, Q15, Q16, Q17, Q18, Q19, Q20, Q21, Q22, and Q23), type of government information discussed in training (Q13), evaluation (Q14), and institutional demographic information (Q1-Q11).
Due to the fact that this information has never before been collected, there is no way for the results to be verified using trend questions or population estimates. Basic frequencies and univariate statistics will be run and, depending on the outcomes, additional hypotheses will be generated and tested.
H1: There will be significant differences between public access computing centers that train on different types of government information.
H2: There will be significant differences between public access computing centers that offer different modes of information retrieval.
H3: There will be significant differences between topics covered and modality of dissemination by community demographics.
Community demographics will be gathered from census data using the zip codes of the public access computing centers and their satellite locations. Although there is no literature available on public access computing centers user base by proximity, one assumption of this project is that public libraries and public access computing centers function similarly enough that the proximity of use theory12 can be applied to public access computing centers.
Public Library Analysis
The quantitative data obtained from the public library instrument falls into several categories: mode of government information training available (Q11, Q14, Q15, Q16, Q17, Q18, and Q19), type of government information discussed in training (Q10), evaluation (Q12), and institutional demographic information (Q1-Q9, Q20, and Q22). The qualitative data collected identifies promotion activities (Q25) and how training and collections developed over time (Q23 and Q24).
Due to the fact that this information has never before been collected, there is no way for the results to be verified using trend questions or population estimates. Basic frequencies and other appropriate univariate statistics will be run, and, depending on the outcomes, additional hypotheses will be generated and tested.
H1: There will be significant differences between public libraries that train on different types of government information.
H2: There will be significant differences between public libraries that offer different modes of information retrieval.
H3: There will be significant differences between topics covered and modality of dissemination by community demographics.
Community demographics will be gathered from census data using the zip codes of the public libraries and their branches. There is quite extensive and long standing literature regarding the increased use of public libraries with respect to proximity;12 thus, using community demographics should give a fairly accurate representation of the libraries’ user base.
Public Access Computing Center and Public Library Analysis
There are several items that are comparable between the public library and public access computing center in order to identify significant differences between training in public libraries and training in public access computing centers. The specific questions are noted in Table 11 below:
Table 11
Comparable Questions for the Public Library and Public Access Computing Center Surveys |
|
Question Number from the Public Access Computing Center Survey |
Question Number from the Public Library Survey |
1 |
2 |
2 |
8 |
8 |
3 |
9 |
4 |
6 |
5 |
7 |
6 |
8 |
7 |
12 |
11 |
13 |
12 |
14 |
13 |
15 |
18 |
16 |
19 |
17 |
14 |
18 |
15 |
19 |
16 |
20 |
17 |
21 |
18 |
These questions will be analyzed using contingency tables (chi-square) for nominal and ordinal variables and a t-test (z-test where K=2) for interval-level data (Q1, Q3, Q4, Q5, Q6, Q7, and Q8) from the public library survey.
Trainers of Trainers Survey
Note about trainers of trainers for public access computing centers: The researchers are not at this time including a survey of the trainers for CTC trainers in the request to OMB. In our work to date we have not been able to define a universe from which we could draw for such a survey. Moreover, based on information from Paul Adams, CTC administrator on our grant and member of CTC Net Board, we believe there is very low of incidence of train the trainer. We are still working to confirm whether or not such a survey will be possible. If not, we will not be able to conduct a comparison of CTCs and libraries regarding sources and types of training as originally stated in our methods section. If we are able to carry out such a survey, we will return to OMB with the necessary documentation.
The purpose of the trainers of trainers survey, hereafter called the “trainers survey,” is to learn more about where library and public access computing center staff get their training. Discovering how the trainers decide on what topics to cover may be a key to understanding who are the real gatekeepers of this knowledge and how they decide to dispense it.
Due to the absence of a definitive list of trainers, the researchers conducted a hand search of advertisements and notices for training in the professional literature and a Web/database search for information about education and training. The result of this search has lead the researchers to define the universe of trainers as all 50 national ALA-accredited library schools,13 all 50 state libraries, and all 50 state library associations (Table 12).
Table 12—Trainers of Trainers Sampling Frame
Survey |
Universe |
Sample |
Expected Response Rate |
ALA Accredited Library Schools |
50 accredited library schools13 |
50 accredited library schools |
100% |
State Libraries |
50 state libraries |
50 state libraries |
100% |
State Library Associations |
50 state library associations |
50 state library schools |
100% |
Due to the population size of the trainers, the researchers will endeavor to get complete coverage of the population through the use of persistent follow-ups via mailing and phone calls. Because of the complete coverage of this population, there are no sampling assumptions, as no sample is taken.
In compliance with section 1.4 of the code, pre-testing of the LIS schools survey was administered to a maximum of nine members of faculty/staff, including the dean, of the Graduate School of Library Information Science at the University of Illinois. Pre-testing of the State Library Associations and State Library survey was accomplished using the Washington State Library and the Illinois State Library. In all cases of testing, the respondents were asked to comment on difficulty of understanding, areas of improvement, and general observations.
In compliance with section 2.3 and 3.3 of the code, the trainers of trainers survey will be administered electronically. Electronic submission will decrease minimize respondent burden, maximize reporting accuracy due to the absence of coding and data entry, and minimize the cost due to the lack of expenses associated with paper mailings. To minimize entry error from the respondent, validation rules have been applied where appropriate to survey fields. Logic checks and infallible skip patterns have also been built into the Web collection system.
All trainers will be sent an electronic invitation addressed to the director or dean, respectively. The invitation will also ask that the respondent forward on the survey to the person at their institution with the most knowledge about training offered or course topics, respectively. Initially, there is no paper mailing with this survey due to the degree of technical abilities present in this population. However, in cases where electronic mail bounces back, IMLS letterhead will be used to send out a paper invitation via first-class mail.
Library Information Science (LIS) schools
Data obtained form LIS schools will be analyzed separately from state library/association data. The instrument for LIS schools assesses the optional and required coursework necessary for general graduation or specialization. Specifically, the instrument evaluates the degree to which courses address finding government information and instructing underserved populations (Q1-Q3) as this knowledge provides the basis for assistance. The instrument also evaluates business skills taught in library schools (Q4a and Q4b). It is important to evaluate the degree to which future librarians are being taught key business skills (e.g., communications, event planning/programming, budgeting, and public relations/marketing) because these are the skills needed to plan and execute training programs for the public. The instrument also covers the context of government information and service to underserved populations in any continuing education courses offered (Q5). Demographic information about the institution will be collected from the ALA directory that contains this information.13
In accordance with section 3.2 of the code, all response rates will be calculated using weighted and unweighted measures, and item response rates will also be calculated to account for item non-response. An analysis to determine if non-respondents are random will be conducted on the whole and at the item-level by estimating bias of respondents using percentages from responding institution demographics from ALA-accredited library schools registry.13 Weighted and unweighted frequency tables with univariate statistics will be created.
Most of the variables in the instrument are nominal or ordinal variables and thus will require non-parametric tests to test the significance of the differences between the groups. Since we are using only one sample for our tests, contingency tables will be produced and a chi-square test will be used. Interval-level data will be tested using a t-test (z-test where K=2). A significance level of .05 or less will be used.
State Library/Library Association
The state library/association instrument quantitatively covers basic institutional demographic information (Q1-Q6), perceptions of training (Q5 and Q6), mode of training (Q7-Q9, Q11-Q12, and Q14-Q15), and topics covered in training (Q10 and Q13). Qualitatively, the instrument covers how the state library/association determines which topics to cover (Q16).
In accordance with section 3.2 of the code, all response rates will be calculated using weighted measures; item response rates will also be calculated to account for item non-response. An analysis to determine if non-respondents are random will be conducted on the whole and at the item-level by estimating bias of respondents using percentages from responding institutions by Department of Education region.14 There are no pre-gathered data sets that offer descriptive measures to compare state library/associations on; since each state has only one of each institution type, regional analysis will be used instead. Weighted and unweighted frequency tables with univariate statistics will be created based on regional response weighting.
Most of the variables in the instrument are nominal or ordinal variables and thus will require non-parametric tests to test the significance of the differences between the groups. Since there is only one sample for our tests, contingency tables will be produced and a chi-square test will be used. Interval-level data will be tested using a t-test (z-test where K=2). A significance level of .05 or less will be used.
Final Analysis
In compliance with section 5.1 of the code, the purpose of the national telephone survey is to provide information about users, access, and uses of government information at the federal, state, and local level. These measures will collectively describe the user needs and be used to evaluate whether or not these needs are being met by public access computing centers, public libraries, and trainers of instructors.
In compliance with section 5.1 of the code, the analysis plan for the public access computing center/public library survey is to determine the frequency and scope of training, and depth and frequency of program evaluations available within the U.S. Significant geographic differences in regard to frequency and scope of training and evaluation throughout the U.S. will also be reported.
In compliance with section 5.1 of the code, the analysis plan for the trainers of trainers survey includes determining the overlap between what information citizens want (obtained from national telephone survey), the information distributed by libraries and public access computing centers, and the information offered to trainers. This will allow significant differences between the primary information providers (trainers and library schools), mid-level information providers (libraries and public access computing centers), and end-users (the public) to be identified.
These three surveys provide a unique perspective on the state of access to government information for the specific population they are targeting, (general population, providers, and trainers of providers). Together the data offered from these three data sets will create a three-dimensional image of the problems in the process of disseminating government information to the public. From the national survey we can determine what the public needs, how they currently get it, how they would like to get it, and their perception of the help provided by libraries and public access computing centers. The provider survey determines what government information topics are covered and the mode of delivery by libraries and public access computing centers. The trainers of providers survey illustrates what government information topics are being taught to future providers, how these topics are being decided upon, and the mode of delivery to the providers. Together, the information from the surveys moves from a static snapshot of three different populations to a dynamic illustration of information dissemination. An analysis of these three data sets can show us where the shortcomings and missing pieces fall when moving from what is taught to providers, to what the providers teach, to what the public needs.
Since there will be three different data sets, the first step will be to identify the relationship between the samples. That is, of those in the national sample going to libraries/public access computing centers, are the libraries/public access computing centers reporting the same topics and modes of information dissemination available as are reported by the libraries and public access computing centers themselves? Is the distribution of topics covered at libraries approximately the same as the topics being taught to the trainers? Contingency tables and a chi-square test will be able to identify if there are any significant differences between the samples based on these criterion.
If the three populations are not related based on these criteria, further tests will be employed to evaluate whether specific groups within those populations are responsible for the effect, or if one sub-group is particularly disjointed from the rest of their population. These tests are very exploratory because there is no literature on this information currently.
Once the literature review and mailing list gathering had been executed, it was clear some changes needed to be made to the budget in order to increase the success of the project. The budget drafted in the proposal was moved around slightly, within the 10% guideline, in order to accommodate the approved methodology change The public access computing center mailing lists may have many outdated e-mail addresses so an additional paper mailing is necessary to accommodate for bounced e-mails. Table 13 describes the revised cost estimates for this methodological change.
Table 13

References
Pew Internet and American Life Project. 2005. IRB Information. Available online: http://www.pewinternet.org/data_irb.asp. Accessed December 1, 2006.
Fox, S. 2005. Digital Divisions: There are clear differences among those with broadband connections, dial-up connections, and no connections at all to the internet. Pew Internet and American Life Project. Available online: http://www.pewinternet.org/pdfs/PIP_Digital_Divisions_Oct_5_2005.pdf. Date accessed: September 12, 2006.
US Department of Commerce: Economic and Statistics Administration: Bureau of the Census. Annual Demographic Survey: Annual Social and Economic Supplement 2005. Available online: http://www.bls.census.gov/cps/asec/adsmain.htm Date accessed: September 12, 2006.
Jaeger, P.T. 2003. The importance of measuring the accessibility of the federal e-government: What studies are missing and how these issues can be addressed. Information Technology and Disabilities 9(1).
Federal State Cooperative System Public Library Data File 2004. Available online: http://www.nclis.gov/statsurv/NCES/ncespls.html. Date accessed: October 12, 2006.
Lakner, E. 1998. Optimizing Samples for Surveys of Public Libraries: Alternatives and Compromises. Library & Information Science Research, 20:4; 321-342.
Federal Depository Library Directory as of October 11, 2006. Available online: http://www.gpoaccess.gov/libraries.html#all. Accessed on September 29, 2006.
Public Library Association. 2006. Public Library Data Service: Statistical Report 2006. Illinois: ABS Graphics.
American Library Directory. Available online: http://www.americanlibrarydirectory.com. Accessed on December 1, 2006.
Community Technology Center Network Directory. Available online: http://ctcnet.org/. Accessed on February 24, 2006.
US Department of Housing and Urban Development’s Neighborhood Network Directory. Available online: http://lnshhq05w.hud.gov/NN/contacts.nsf/centersearch?OpenForm. Accessed on September 21, 2006.
Koontz, C. 1992. Public Library Site Evaluation and Location: Past and Present Market-Based Modelling Tools for the Future[sic]. Library and Information Science Research, 14, 379-409.
American Library Associations Alphabetical List of Institutions with ALA-Accredited Programs. Available at: http://www.ala.org/ala/accreditation/lisdirb/Alphaaccred.htm. Accessed on October 12, 2006.
Department of Education: Department of Education Regional Offices. Available online: http://www.ed.gov/about/contacts/gen/regions.html. Date accessed November 9, 2006.
Consultant, contractor, grantee phone list
A list of telephone numbers and names of persons contributing technical expertise to this methodology as cited within the document:
Consultant, contractor, grantee phone list |
||
Name of Person’s Consulted |
Affiliation |
Phone Number |
Paul Adams, Ph.D. |
Prairienet |
(217) 333-5218 |
Leigh Estabrook, Ph.D. |
LRC |
(217) 333-4209 |
Edward Lakner, Ph.D. |
LRC |
(217) 244-3301 |
Mary Mallory, MLS |
UIUC Gov. Docs Library |
(217) 244-4621 |
Megan Mustafoff, MS |
LRC |
(217) 398-1028 |
Lee Rainie, Ph.D. |
PEW |
(202) 419-4500 |
Lauren Teffeau, MA |
LRC |
(217) 333-5881 |
Shells:
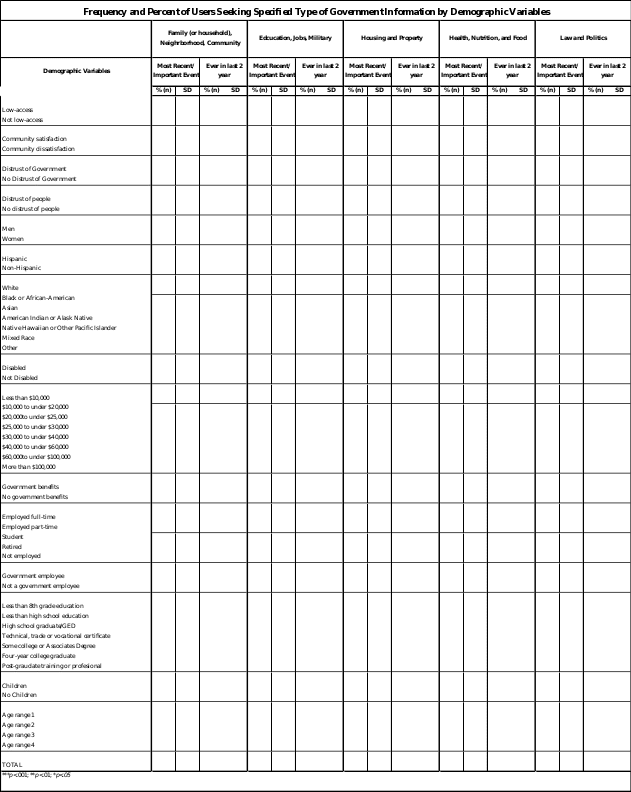
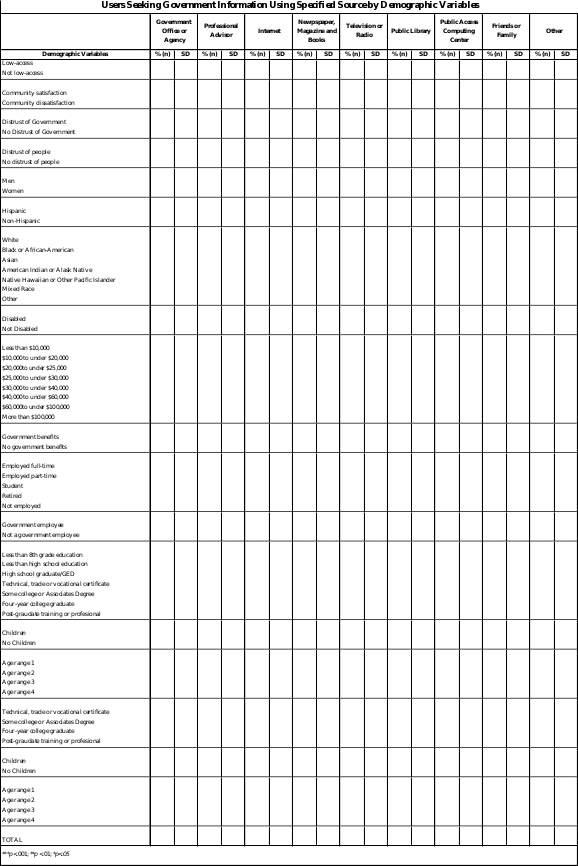
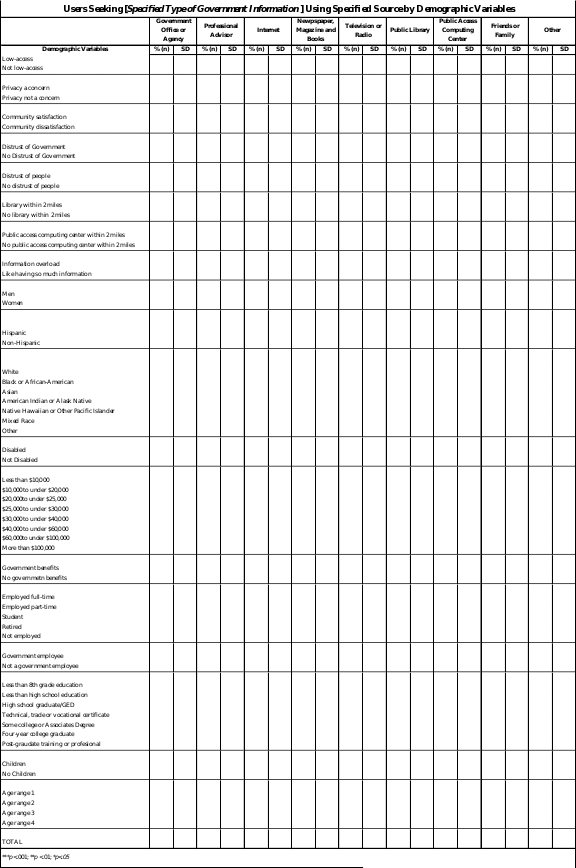
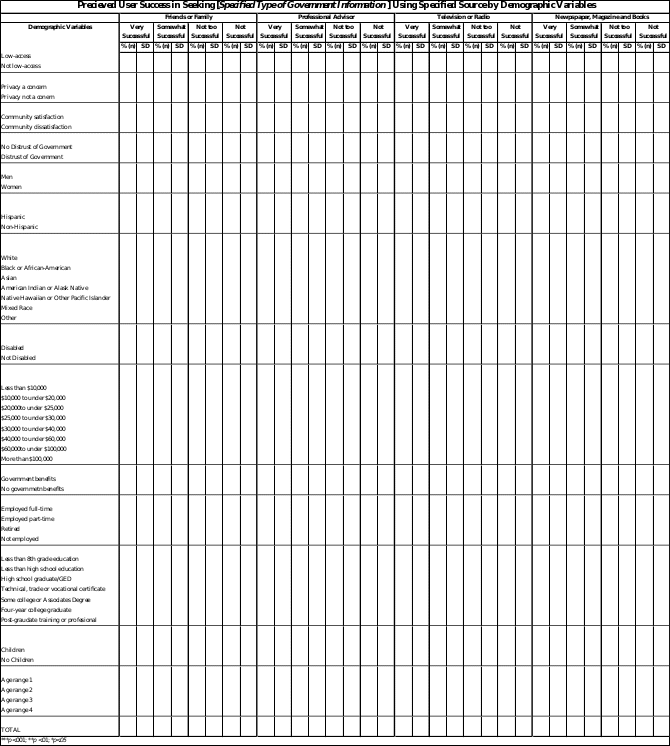
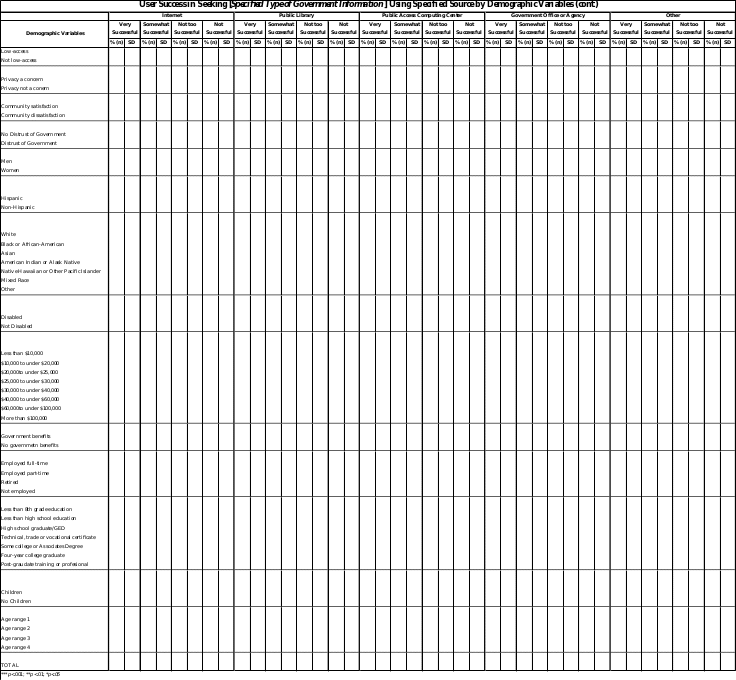
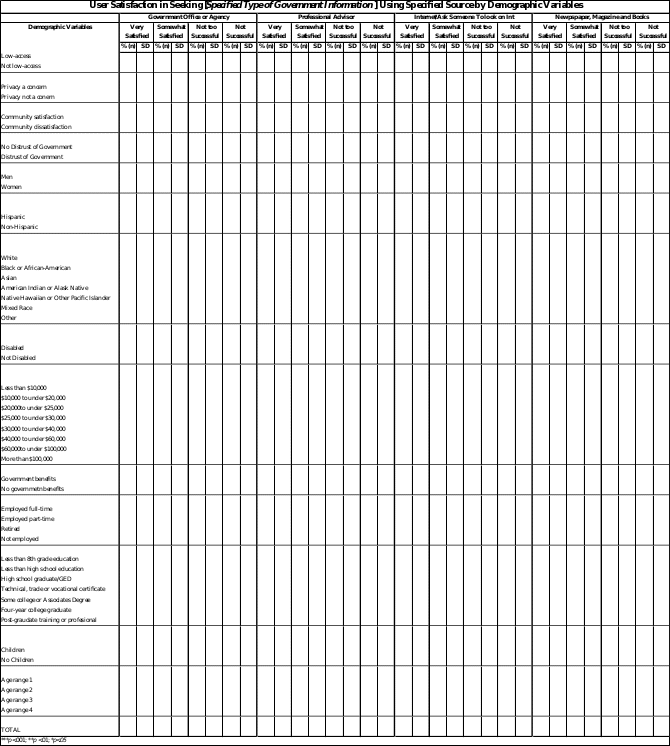
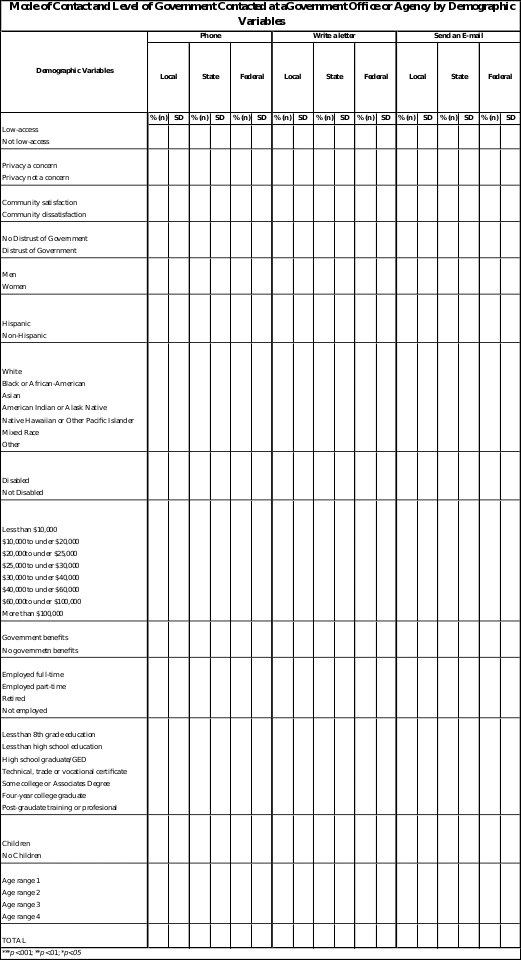
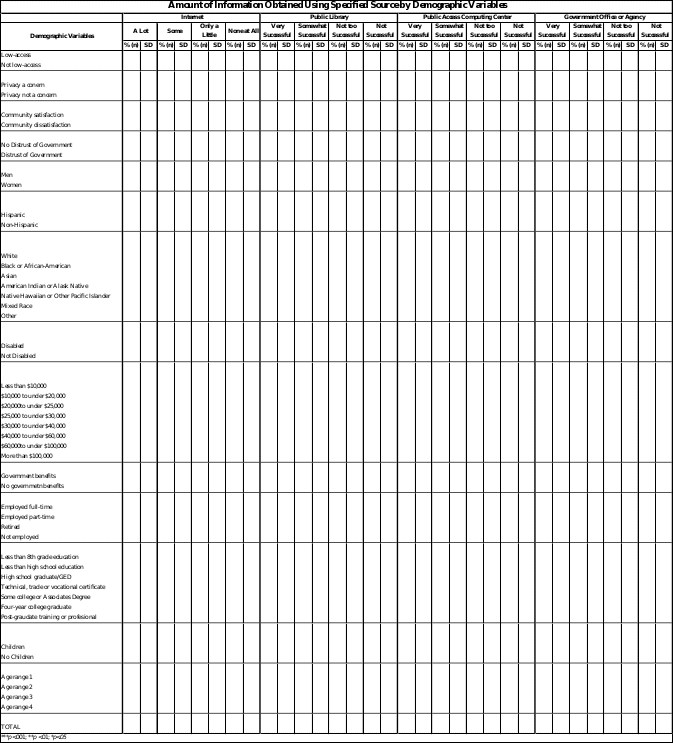
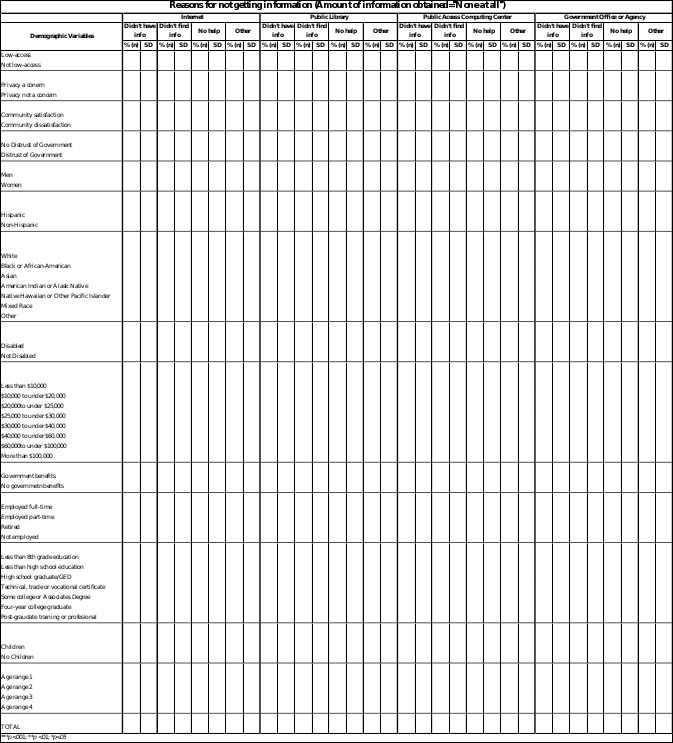
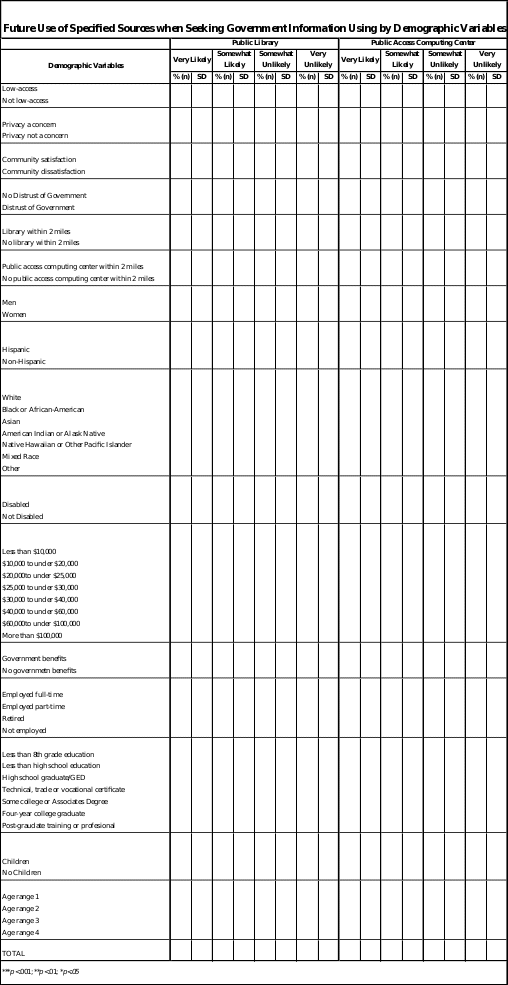
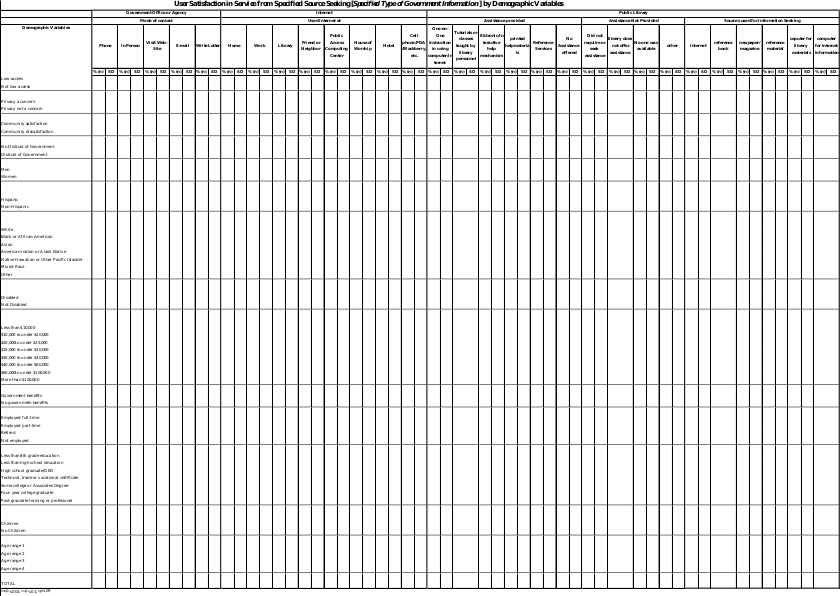
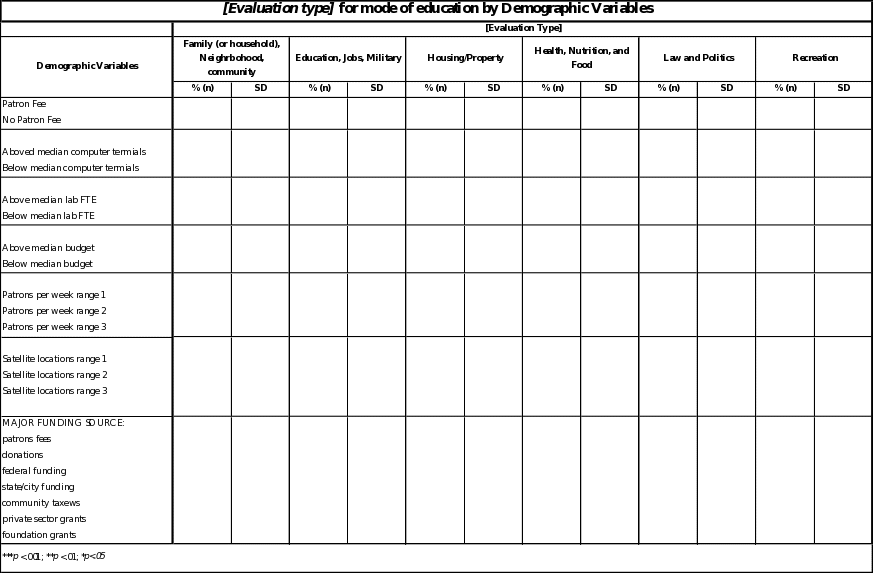
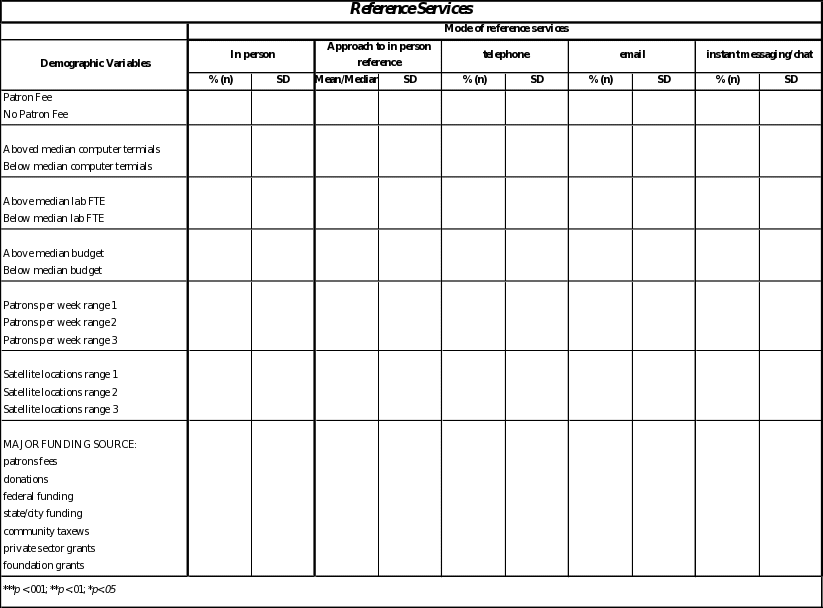
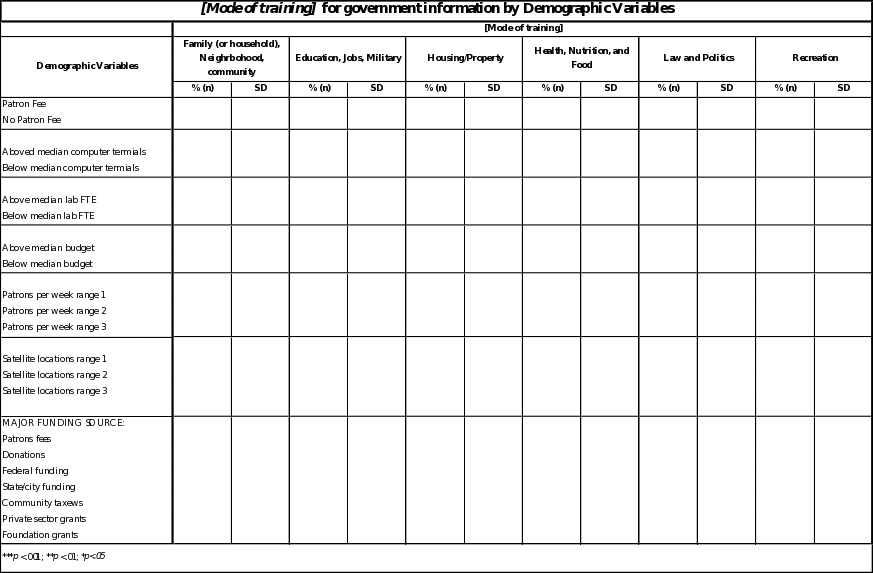
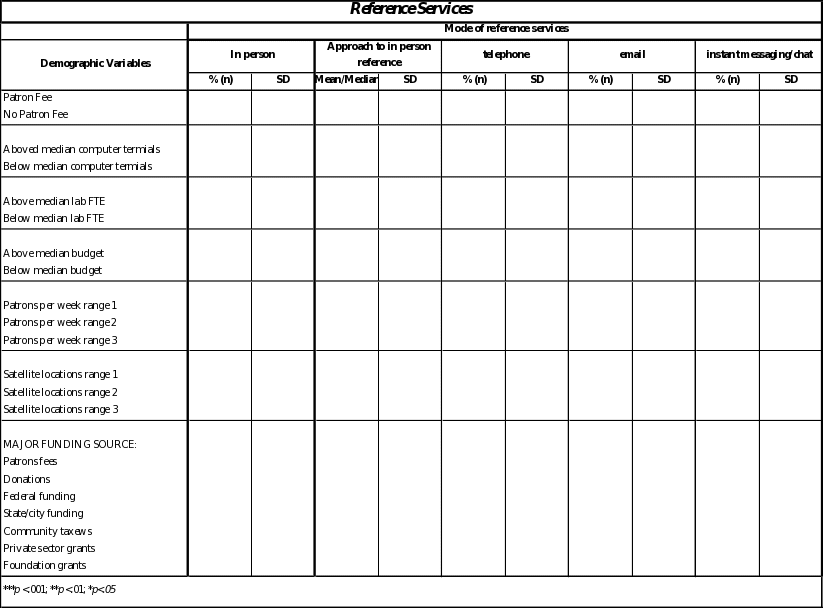
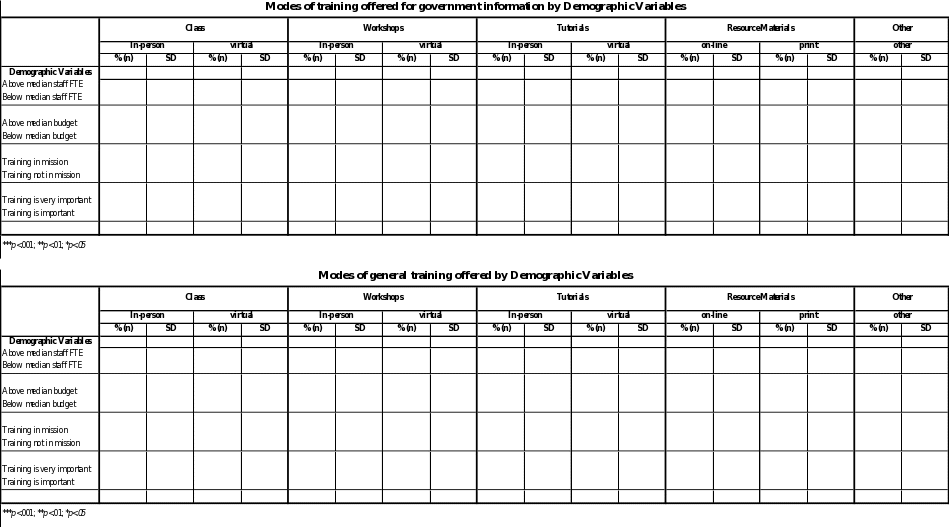
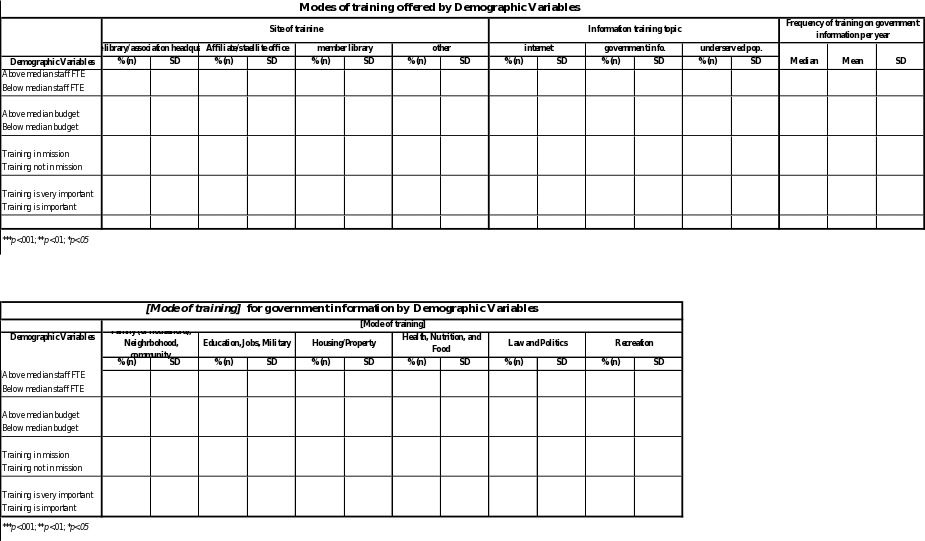
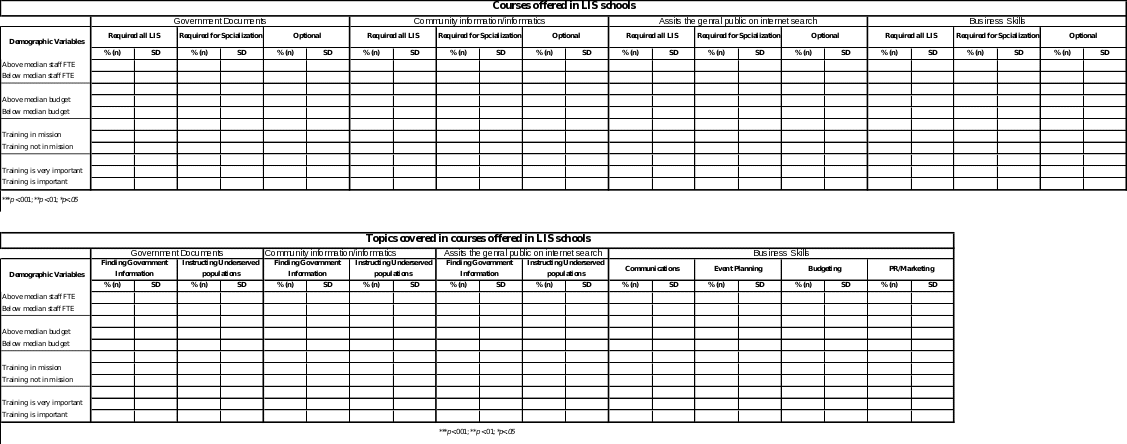
The following pages contain the shells of graphs that will be used to display results. The final tables will be readable in print version; however, for continuity, the larger charts have been used so that the zoom feature of Microsoft Word or Adobe Acrobat can be used to view the detail of the chart instead of breaking the chart into smaller subsections as will be done for printing of the larger tables.




| File Type | application/msword |
| File Title | Supporting Statement for Paperwork Reduction Act Submissions |
| Author | GSLIS |
| Last Modified By | Barbara Smith |
| File Modified | 2007-03-09 |
| File Created | 2007-02-25 |
© 2026 OMB.report | Privacy Policy