CCM GQ Coverage, Card Sorting Study, ACS Data Reliability Indicator
Generic Clearence for Questionnaire Pretesting Research
OMB0925ACSdatareliabililtyindicatorenc
CCM GQ Coverage, Card Sorting Study, ACS Data Reliability Indicator
OMB: 0607-0725
Attachment
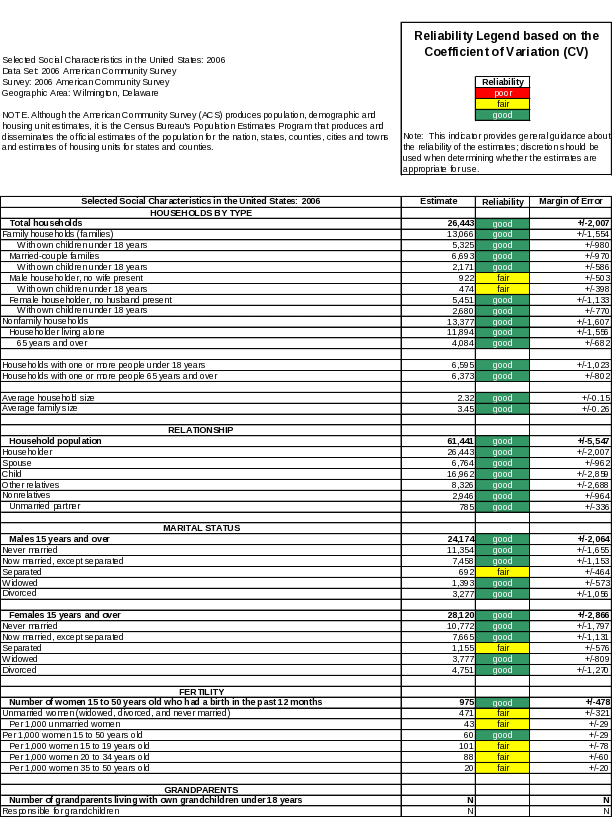
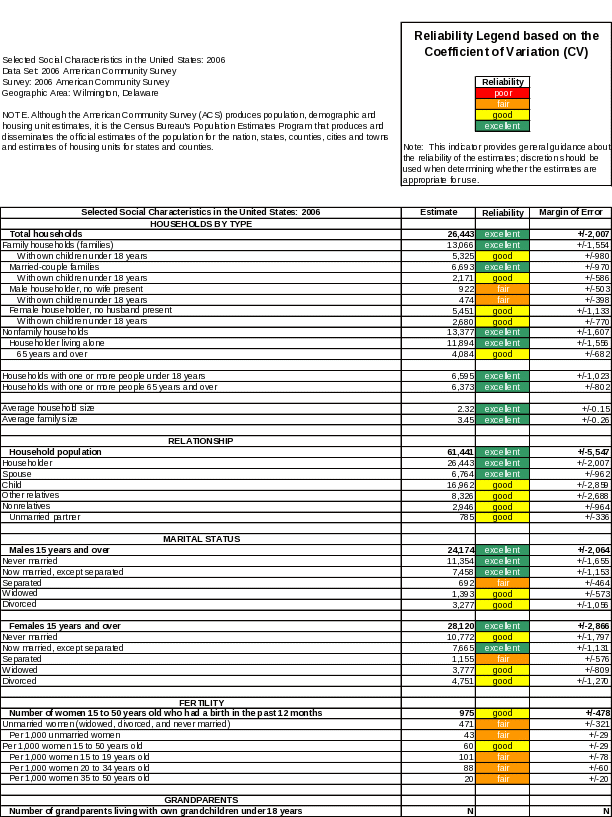
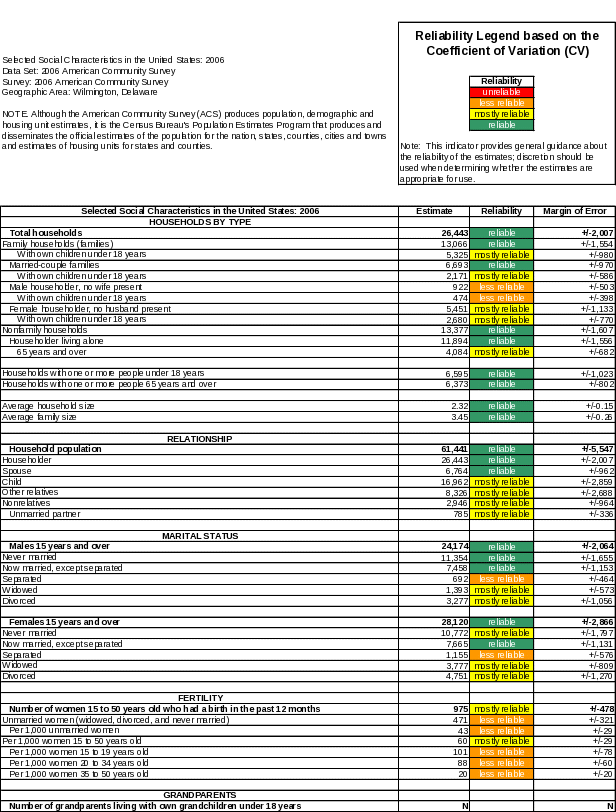
A: Prototypes of Current ACS Tables for Second Round of Testing
(
Baseline Table

Three-Level Indicator

Four-Level Indicator A

Four-Level Indicator B

Attachment B: Questionnaire on Statistical Background, Computer Use, Internet Experience
YOUR ANSWERS ARE CONFIDENTIAL
Demographics
1. What is your age? _______________
2. Are you male or female?_________________
3. What is your level of education?
___grade school
___some high school
___high school degree
___some college
___2-year college degree
___4-year college degree
___some postgraduate study (e.g., M.A., M.B.A., J.D., Ph.D., M.D., programs)
___postgraduate degree (e.g., M.A., M.B.A., J.D., Ph.D., M.D.)
4. How often do you use ACS data products?
_____Daily
_____Weekly
_____Monthly
_____Less than once a month
_____Do not use
5. What statistics courses have you completed?
_____Advanced graduate-level statistics
_____Advanced undergraduate/beginning level graduate
statistics courses only
_____Introductory statistics courses only
_____No statistics courses completed
6. Rate your level of expertise with statistics.
_____Novice (Just beginning to use statistics or rarely use them)
_____Intermediate (Moderate experience with statistics)
_____Expert (A great deal of experience with and/or frequent use
of statistics)
Computer Experience
1. Do you use a computer at home, at work, or both?
(Check all that apply.)
___Home
___Work
___Somewhere else, such as school, library, etc.
2. If you have a computer at home,
a. What kind of modem do you use at home?
___Dial-up
___Cable
___DSL
___Wireless (Wi-Fi)
___Other __________
___Don’t know _____
b. Which browser do you typically use at home? Please indicate the version if you can recall it.
___Firefox
___Internet Explorer
___Netscape
___Other ___________
___Don’t know
c. What operating system does your home computer run in?
___MAC OS
___Windows 95
___Windows 2000
___Windows XP
___Windows Vista
___Other ___________
___Don’t know
3. On average, about how many hours do you spend on the Internet per day?
___0 hours
___1-3 hours
___4-6 hours
___7or more hours
4. Please rate your overall experience with the following:
Circle one number.
No experience Very experienced
Computers 1 2 3 4 5 6 7 8 9
Internet 1 2 4 5 5 6 7 8 9
5. What computer applications do you use?
Mark (X) for all that apply
___E-mail
___Internet
___Word processing (MS-Word, WordPerfect, etc.)
___Spreadsheets (Excel, Lotus, Quattro, etc.)
___Accounting or tax software
___Engineering, scientific, or statistical software
___Other applications, please specify____________________________
For the following questions, please circle one number.
6. How comfortable are you in learning to navigate new Web sites?
|
Not Comfortable Comfortable
1 2 3 4 5 |
|
|
7. Computer windows can minimize, resized, and scrolled through. How comfortable are you in manipulating a window?
8. How comfortable are you using, and navigating through the Internet?
9. How often do you work with any type of data through a computer?
10. How often do you perform complex analyses of data through a computer?
11. How often do you use the Internet or Web sites to find information? (e.g., printed reports, news articles, data tables, blogs, etc.)
12. How familiar are you with the Census (terms, data, etc)?
13. How familiar are you with the current American Community Survey (ACS) and American FactFinder (AFF) sites (terms, data, etc.)? |
Not Comfortable Comfortable 1 2 3 4 5
1 2 3 4 5
Never Very Often
1 2 3 4 5
1 2 3 4 5
1 2 3 4 5
Not familiar Very familiar
1 2 3 4 5
1 2 3 4 5
|
||
Attachment C: Task list
Tasks for Table Evaluation
For this round of testing, each participant will use only one version of the table for all of the tasks. The tasks will be the same for all prototypes and for all participants. All of the tables will use the same small-area geography so that the results can be more readily compared across tables. They will be able to view all versions and indicate a “favorite” during the post-testing debriefing segment.
TO BE USED FOR ALL THREE PROTOTYPES AND BASELINE TABLE [Wilmington, DE]
1. What is the first thing that you noticed about this table?
[First-round results showed that color-coded column was noticed before the legend.]
Probe if indicator is mentioned: What do the colors represent?
IF quality/reliability: How is quality measured here or what measure is used to determine the level of quality?
What is the coefficient of variation?
Is a higher or lower coefficient of variation associated with better data quality/reliability?
How is the coefficient of variation different from a Margin of Error?
Do you have a preference?
If so, which would you prefer to use?
Probe if indicator is not mentioned:
Did you notice the colors in the tables? What do the colors represent?
IF quality: How is quality measured here or what measure is used to determine the level of quality?
What is a coefficient of variation?
Is a higher or lower coefficient of variation associated with better data quality/reliability?
How is the coefficient of variation different from a Margin of Error?
Do you have a preference?
If so, which would you prefer to use?
Task 1 Difficulty: Easy (report features of table noticed at first glance).
2. Your supervisor asks you to find some information about the number of women ages 15 to 50 who gave birth in the past 12 months for your hometown of Wilmington, DE [XX|975+/-478]. What information would you report to your supervisor?
Task 2 Difficulty: Medium (find information, make a judgment about acceptability of data reliability)
3. You are researching background information for a paper and need to find the number of people of West Indian descent in Wilmington, DE [XX|0+/-261]. What do you report in the paper based on your findings in the tables?
Task 3 Difficulty: Medium (find information, make a judgment about acceptability of data reliability)
4. Find the total number of people with German ancestry [XX|4,206|+/-1,083] and the total number of people with Slovak ancestry [XX|70|+/-116] for Wilmington, DE.
Which category of ancestry do you think is a better estimate in terms of data quality? [German]. Please explain why you think this is a better estimate of data quality.
Task 4 Difficulty: Hard (find information, compare 2 estimates and their associated reliability and make a judgment about acceptability of data reliability)
5. You work for a major corporation that sells children’s products, music, and videos. Your job is to organize a concert in the Wilmington, DE area and your boss wants you to find out:
A. How many family households in this area have children under 18 years old? Would you report this estimate? Why or why not?
B. What is the average family size in Wilmington, DE? Would you report this estimate? Why or why not?
C. How many nursery school, kindergarten, and elementary school students are enrolled in this area? Would you report this estimate? Why or why not?
D. Based on the information you found, your boss wants to know whether you think Wilmington, DE is a good place to hold this concert.
Task 5 Difficulty: Hard (find multiple pieces of information, and make a judgment about acceptability of data reliability, integrate information)
6. You are asked to report to state leaders the number of people of Italian descent living in California. What answer would you give them? [1,560,870|XX|+/- 24,224] Would you recommend using this number? [Yes] Why or why not? [XX reliability]
Task 6 Difficulty: Medium (find information, make a judgment about acceptability of data reliability)
7. The mayor of Wilmington said that if there are more than 1,500 people ages 5 to 15 with disabilities in Wilmington, the city might be eligible to receive some government funding to develop programs for the disabled. He asks you if the there are at least 1,500 people in this age group with disabilities in Wilmington. What would you tell him using ACS data?
[estimate of disabled ages 5-15 is 936 +/- 836. 1500 is in the confidence interval, but the estimate is “fair”]
Task 7 Difficulty: Hard (find information, and make a judgment about acceptability of data reliability and context of problem that involves money and impacts people (socially complex), integrate information)
8. The Danish embassy wants a listing of all cities with more than 2000 people of Danish descent. Would you include the city of Wilmington based on the ACS data?
[estimate is 657 +/- 993 and considered “poor.” 2000 is out of confidence interval].
Task 8 Difficulty: Medium (find information, and make a judgment about acceptability of data reliability)
9. Cities with less than 150 people of French Canadian descent will engage in an outreach program designed to attract more people of French Canadian descent. Does Wilmington qualify based on ACS data?
[estimate is 110 +/-133, but estimate is poor]
Task 9 Difficulty: Medium (find information, and make a judgment about acceptability of data reliability)
10. You are writing a news article about voter turnout in the 2008 presidential election and want to find out how many people are 18 or older in your home town of Wilmington, DE. What results do you find in the table?
[What year the estimates came from should also be relevant]
Task 9 Difficulty: Hard (find information, and make a judgment about acceptability of data reliability, consider the year that the data were collected; integrate all of this information)
Attachment D: Questionnaire for User Interaction Satisfaction (QUIS)
Please circle the numbers that most appropriately reflect your impressions about using the new ACS data tables.
1. Overall reaction to the new ACS data tables: |
terrible wonderful |
||||||||||
|
1 |
2 |
3 |
4 |
5 |
6 |
7 |
8 |
9 |
not applicable |
|
2. Definition of reliability: |
confusing clear |
||||||||||
|
1 |
2 |
3 |
4 |
5 |
6 |
7 |
8 |
9 |
not applicable |
|
3. Use of terminology throughout the tables: |
inconsistent consistent |
||||||||||
|
1 |
2 |
3 |
4 |
5 |
6 |
7 |
8 |
9 |
not applicable |
|
4. Information displayed in the tables: |
inadequate adequate |
||||||||||
|
1 |
2 |
3 |
4 |
5 |
6 |
7 |
8 |
9 |
not applicable |
|
5. Arrangement of information in the tables: |
illogical logical |
||||||||||
|
1 |
2 |
3 |
4 |
5 |
6 |
7 |
8 |
9 |
not applicable |
|
6. Tasks can be performed in a straight-forward manner: |
never always |
||||||||||
|
1 |
2 |
3 |
4 |
5 |
6 |
7 |
8 |
9 |
not applicable |
|
7. Color-coded reliability indicator for the tables: |
confusing clear |
||||||||||
|
1 |
2 |
3 |
4 |
5 |
6 |
7 |
8 |
9 |
not applicable |
|
8. Overall experience of finding information: |
difficult easy |
||||||||||
|
1 |
2 |
3 |
4 |
5 |
6 |
7 |
8 |
9 |
not applicable |
|
9. Additional Comments: |
|
||||||||||
|
|
|
|
|
|
|
|
|
|
|
|
|
|
||||||||||
|
|
|
|
|
|
|
|
|
|
|
|
Attachment E: Task Difficulty Rating Questionnaire
On a scale of 1-10 with 1 being extremely easy and 10 being extremely difficult, please rate the difficulty of each task.
1. What is the first thing that you noticed about this table?
Extremely Extremely
Easy Difficult
1 2 3 4 5 6 7 8 9 10
2. Your supervisor asks you to find some information about the number of women ages 15 to 50 who gave birth in the past 12 months for your hometown of Wilmington, DE. What information would you report to your supervisor?
Extremely Extremely
Easy Difficult
1 2 3 4 5 6 7 8 9 10
3. You are researching background information for a paper and need to find the number of people of West Indian descent in Wilmington, DE. What do you report in the paper based on your findings in the tables?
Extremely Extremely
Easy Difficult
1 2 3 4 5 6 7 8 9 10
4. Find the total number of people with German ancestry and the total number of people with Slovak ancestry for Wilmington, DE.
Which category of ancestry do you think is a better estimate in terms of data quality? Please explain why you think this is a better estimate of data quality.
Extremely Extremely
Easy Difficult
1 2 3 4 5 6 7 8 9 10
5. You work for a major corporation that sells children’s products, music, and videos. Your job is to organize a concert in the Wilmington, DE area and your boss wants you to find out:
A. How many family households in this area have children under 18 years old? Would you report this estimate? Why or why not?
B. What is the average family size in Wilmington, DE? Would you report this estimate? Why or why not?
C. How many nursery school, kindergarten, and elementary school students are enrolled in this area? Would you report this estimate? Why or why not?
D. Based on the information you found, your boss wants to know whether you think Wilmington, DE is a good place to hold this concert.
Extremely Extremely
Easy Difficult
1 2 3 4 5 6 7 8 9 10
6. You are asked to report to state leaders the number of people of Italian descent living in California. What answer would you give them? Would you recommend using this number? Why or why not?
Extremely Extremely
Easy Difficult
1 2 3 4 5 6 7 8 9 10
7. The mayor of Wilmington said that if there are more than 1,500 people ages 5 to 15 with disabilities in Wilmington, the city might be eligible to receive some government funding to develop programs for the disabled. He asks you if the there are at least 1,500 people in this age group with disabilities in Wilmington. What would you tell him using ACS data?
Extremely Extremely
Easy Difficult
1 2 3 4 5 6 7 8 9 10
8. The Danish embassy wants a listing of all cities with more than 2000 people of Danish descent. Would you include the city of Wilmington based on the ACS data?
Extremely Extremely
Easy Difficult
1 2 3 4 5 6 7 8 9 10
9. Cities with less than 150 people of French Canadian descent will engage in an outreach program designed to attract more people of French Canadian descent. Does Wilmington qualify based on ACS data?
Extremely Extremely
Easy Difficult
1 2 3 4 5 6 7 8 9 10
10. You are writing a news article about voter turnout in the 2008 presidential election and want to find out how many people are 18 or older in your home town of Wilmington, DE. What results do you find in the table?
Extremely Extremely
Easy Difficult
1 2 3 4 5 6 7 8 9 10
Attachment F: Debriefing Questions
1. Can you walk me through your thinking on why you marked (a particular QUIS item) especially low/high? (Do this for several low/high QUIS ratings; also, do this for easy/difficult ratings).
2. [Look at their answer for how often they use ACS data products. If they do not use them, skip this question.] What was the last real-world task that required you to consult ACS data products? For instance, what estimates did you need to look up for a news story, etc.?
3. How easy or difficult do you feel it was to complete the tasks? What made a task easy or difficult?
4. Do you think the new color-coding scheme for the ACS table helped you find accurate answers?
5. Do you think the new color-coded ACS table helped you to find information quickly? Did you think the color-coding made it take longer or seem more difficult to find information?
6. How satisfied are you with your experiences using the ACS data reliability indicators?
7. What did you like best about the table?
8. What did you like least about the table?
Open all prototypes.
9. Here are three versions of this color-coded reliability indicator. Some have different levels of indicator and some have different text to describe their meaning.
Which of these tables make it easiest or harder to find information about data quality/reliability? What about this table makes it the easiest to use?
Which of these tables do you most prefer (e.g., like best)?
Open one current table.
10. These are how the ACS data tables currently look. Do you prefer the new tables or the current tables? Please explain your answer.
11. Because of the color-coding used in these tables, they may appear differently to different people. In order to examine this issue, we are asking participants whether they are color-blind or not. Are you color-blind?
12. Please take a look at this image and tell me what you see in the image:

[This is an Ishihara colorblindness test. A 5 appears to individuals with normal vision, and a 2 appears to individuals with red-green colorblindness.]
13. Is there anything else about the tables that you would like to mention?
| File Type | application/msword |
| File Title | Attachment A: Prototypes of Current ACS Tables for Second Round of Testing (Wilmington, DE) |
| Author | Kathleen |
| Last Modified By | mom |
| File Modified | 2009-05-29 |
| File Created | 2009-05-29 |
© 2026 OMB.report | Privacy Policy