Additional Analyses and Power and Precision Estimates
Attachment 18 Additional Analyses.docx
Research to support the National Crime Victimization Survey (NCVS)
Additional Analyses and Power and Precision Estimates
OMB: 1121-0325
Additional Analyses and Accompanying Power and Precision Estimates
The remaining research questions involve examination of the survey results and the effects of different experimentally manipulated characteristics. In the remainder of this section, we discuss the analyses to address the remaining research questions discussed in the memorandum.
What are the response rates for the IVR and how do these rates vary the mode used to contact sampled respondents – mail or telephone? What mode of interview yields the highest response rate?
This question addresses what the response rate is for an IVR survey, how it compares to a telephone interview and whether there are differences by mode of contact. With respect to comparing the mail and telephone modes of contact, the analysis will collapse all of the mail IVR into a single group (n = 10,000) and the telephone IVR into a single group (n =2000). The point estimates for the response rates for these two groups have half-width 95% confidence intervals of 0.9% for the mail IVR (assuming a 30% response rate) and 1.7% for the telephone IVR (assuming a 20% response rate). The response rate for the telephone interview sample has a half-width 95% confidence interval of 2.4%. These response rate estimates will thus provide reasonably reliable estimates of the level of response for each of these methods.
Is it possible to effectively encourage sampled households to complete the interview when the initial mode of contact is the mail?
This analysis will focus on the effectiveness of the different methods intended to increase the response rate to the mail IVR. The experimental design has four conditions representing a crossing of two incentive conditions ($0, $10) and two insert conditions (with insert, without insert). Each of these cells has 2500 sample cases. Ignoring the insert treatment yields 5000 sample cases for each incentive condition, providing 80% power to detect a 2.4 percentage point difference. The power for the insert is identical to this. If one tests within conditions (e.g., incentive effect for the “no insert” condition), the design can detect a 3.5 percentage point difference in response rate with 80% power.
Are there differences in respondent acceptance between speech IVR and touchtone IVR?
The first part of this analysis will analyze the response rate across voice and TDE IVR treatments. Those contacted by mail have 5000 in each of the two conditions (speech vs. touchtone), which allows detection of a 2.6 percentage point difference with 80% power. The telephone contacts have 1000 in each condition. This analysis can detect a 5.1 percentage point difference with 80% power.
User acceptance will also be measured from the debriefing interview that asks about satisfaction and from the para-data (e.g., backing up, asking for help, break-offs). One question will be whether there is a difference in satisfaction between the speech and TDE methods of entry. These analyses are based on completed interviews and will be split between those contacted by telephone (n=200 per group) and those by mail (n=1500 per group). When computing the power for these analyses, a 10% and a 40% level of satisfaction (or dissatisfaction) were used. For the 10% level, the telephone will not be able to detect anything but a very large effect of 8.5 percentage points. The mail, however, will be able to detect an effect of 3.1 percentage points. For the 40% level of satisfaction, the power is 13.9 and 5.1 percentage points for the telephone and mail respectively.
Does IVR lead to different victimization rates from a telephone interview?
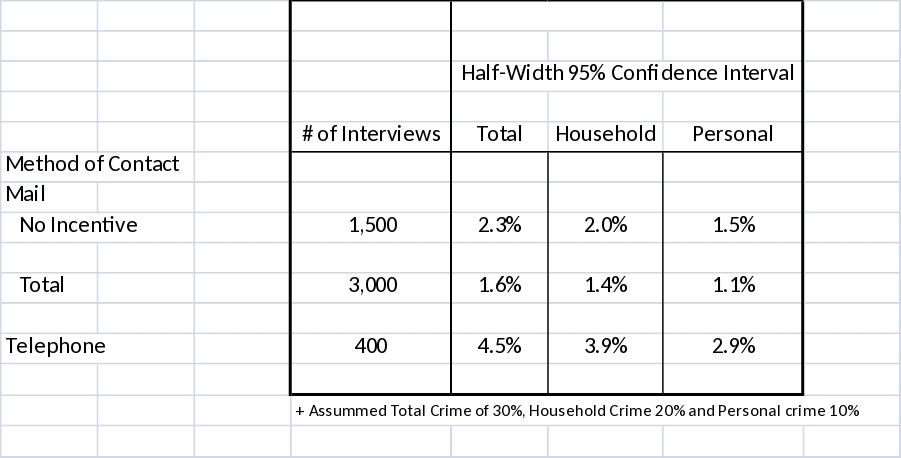
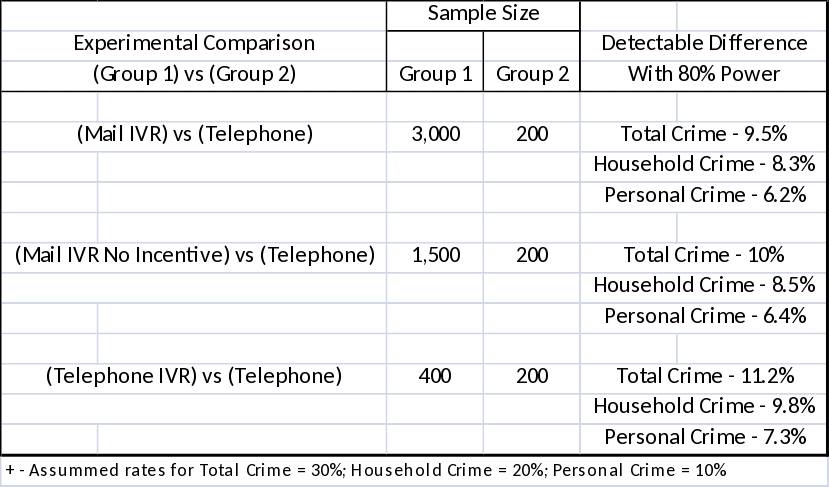
This analysis will evaluate whether victimization rates differ between the IVR and the telephone. To calculate the precision and power, it was assumed that the sample would yield, on average, a victimization rate of 30%, 20% and 10% for Total, Household and Personal crimes, respectively. These rates were estimated using reporting rates observed in prior victim surveys using police records (Murphy, 1981).
Table 7 provides the precision of the three different crime estimates for each of the three IVR conditions. The half-width confidence interval is between 1.5% to 4.9%, depending on the type of crime and condition.
Table 7. Half-Width Confidence Intervals for Victimization Rates for IVR by Contact Methods

Table 8. Power of Comparisons of Victimization Rates by Mode of Contact
Victimization rates for each of these IVR conditions will be compared to the rates from telephone interviews. The power for these comparisons will detect differences of around 10 percentage points for total crime, 8 percentage points for household crime and 6 percentage points for personal crimes (Table 8). While this is not a highly rigorous test, it will detect large differences by mode. For example, with a 30% total rate, a 10 percentage point difference is an effect of approximately 33%. This type of difference was observed for other NCVS experiments, including tests of the new screener and the implementation of CATI during the redesign of the 1990’s. For example, the redesigned screener boosted the personal crime rate by 44% and the household crime rate by 23% (Kindermann, et al., 1997). Slightly larger increases were observed when comparing centralized telephone interviewing to decentralized telephone interviewing (Hubble and Wilder, 1988). Of course, if one hypothesizes a one tailed test (e.g., the IVR will yield higher rates), the power significantly increases.
Is there a difference in victimization rates for Speech and TDE modes of entry?
The total number of interviews, by mode of entry, is 1700 across the telephone and mail methods of contact. For household crimes, testing the difference between modes of entry (speech vs. TDE) will detect a difference of 4.4, 3.9 and 2.9 percentage points for total, household and personal crimes, respectively. The power when restricting to just the mail mode of contact is similar to this. The power drops significantly to 13.0, 11.3 and 8.5 percentage points when analyzing the telephone mode of contact.
| File Type | application/vnd.openxmlformats-officedocument.wordprocessingml.document |
| Author | Feel Good Inc. |
| File Modified | 0000-00-00 |
| File Created | 2021-02-03 |
© 2026 OMB.report | Privacy Policy
