Appendix G: NSRCG Nonresponse Study Reports
Appendix G NSRCG Nonresponse Study Reports.docx
2010 National Survey of Recent College Graduates (NSRCG)
Appendix G: NSRCG Nonresponse Study Reports
OMB: 3145-0077
APPENDIX G
NSRCG Nonresponse Study Reports

Methodology Research for National Survey of Recent College Graduates (NSRCG) School Samples: Analysis of School-Level Nonresponse
Donsig Jang
Xiaojing Lin
Submitted to:
National Science Foundation Division of Science Resources Statistics 4201 Wilson Boulevard Suite 965 Arlington, VA 22230
Project Officer: Kelly Kang
|
Submitted by:
Mathematica Policy Research, Inc. P.O. Box 2393 Princeton, NJ 08543-2393 Telephone: (609) 799-3535 Facsimile: (609) 799-0005
Project Director: Linda Bandeh |
CONTENTS
Chapter Page
I. INTRODUCTION
II. Background and outline of the research
III. empirical investigations
A. SCHOOL-LEVEL RESPONSE RATES BY SCHOOL CHARACTERISTICS
B. DEMOGRAPHIC COMPOSITION OF GRADUATES FROM SCHOOLS BY SCHOOL RESPONSE STATUS
C. Graduate-Level Response Rate Comparison between Early- and Late-Responding Schools
D. Comparison of Key Survey Items between Early- and Late-Responding Schools
iv. SUMMARY
REFERENCES
TABLE
III.1 RELATIVE DIFFERENCE COMPARISON BEFORE AND AFTER REWEIGHTING FOR KEY SURVEY ITEMS
FIGURES
III.1 DISTRIBUTION OF LIST SUBMISSION DATES IN 2003 NSRCG
III.2CHOOL-LEVEL RESPONS RATES BY CHARACTERISTICS ACROSS FOUR RESPONSE RATE OPTIONS
III.3 RELATIVE DIFFERENCES OF WEIGHTED PROPORTION OF DEMOGRAPHIC GROUPS BY THEIR SCHOOL-LEVEL RESPONSE STATUS
III.4 GRADUATE-LEVEL
RESPONSE RATES BY SCHOOL RESPONSE
STATUS
I. introduction
The National Survey of Recent College Graduates (NSRCG), sponsored by the National Science Foundation (NSF), collects education, employment, and demographic information from graduates who recently received a bachelor’s or master’s degree in a science, engineering, and health (SE&H) field from a college or university in the United States or one of its territories.1 Eligible graduates must also be age 75 or younger, living in the United States or in a U.S. territory, and not institutionalized as of the survey reference date.2 Given that the complete list of recent graduates, or “ultimate sampling units,” is available only from the schools from which students graduate and that the cost of collecting lists of graduates from all schools is prohibitive, the NSRCG involves a two-stage sample design: (1) schools are selected in the first stage, and (2) graduates are selected in the second stage from the list of all graduates obtained from selected schools. This report presents results from the methodological study that focused on the NSRCG school sample, or first-stage sample.
The purpose of this study was to conduct a nonresponse analysis of the school sample by treating late-responding schools as nonrespondents. Reluctant respondents and low response rates have translated into increased data collection costs to maintain the same level of NSRCG response from one year to the next. Consequently, survey managers must assess the efficient allocation of a fixed budget to achieve the survey’s objectives. Obtaining participant schools’ cooperation is critical to constructing the sampling frame, which includes all graduates eligible for the survey. Clearly, the list collection of college graduates is a major component of the NSRCG design, with considerable cost implications.
Person-level response rates have historically hovered around 80 percent but have recently dropped to less than 70 percent; at the same time, the school-level response rate has been almost perfect at about 99 percent (Wilson et al. 2005; Bandeh et al. 2007). However, achieving such high response rates comes with a substantial cost. In particular, data collection resources must be concentrated on a small set of late-responding schools, thus extending the data collection period and forcing the data collection contractor to devote considerable time and money to convincing reluctant schools to provide the requested lists of graduates. This report focuses on the effect of school nonresponse based on the assumption that the list collection period cannot be extended and that a higher school-level nonresponse rate would be acceptable. With this objective, we assess the bias of survey estimates attributable to school-level nonresponse at varying response rates.
II. Background and outline of the research
In recent years, it has become more challenging and expensive to obtain cooperation from sampled units—regardless of whether they are establishments or people. The NSRCG is no exception. Consequently, an important survey design issue is how to achieve survey objectives within a fixed budget. As mentioned, collecting the graduate lists for the NSRCG is associated with considerable cost. In particular, during the last few months of the collection period, resources must be concentrated on a small set of “difficult” schools; if schools responded more rapidly, resources could be used elsewhere. In addition, converting the nonresponding schools to respondents takes time; again, if schools responded more quickly, the graduate sample could be available earlier, permitting a shorter field collection period.
Our recent experience suggests a line of research that focuses on the extent to which the NSRCG school-level response rate might be affected by a shortened field collection period and the acceptance of a higher school-level nonresponse rate. With that in mind, we carried out the research outlined below to assess the extent of bias attributable to school-level nonresponse at varying response rates.
Data Sources
2003 NSRCG list collection status database
2003 NSRCG graduate sample frame
2003 NSRCG survey response file
Setting Up Three Response Rate Scenarios
Identify dates of each school file accepted
Sort the school by file-acceptance date
Treat the first XX percent of responding schools (early respondents) as respondents (four options: X = 85, 90, 95, 99 percent)
Empirical Comparisons between Early- and Late-Responding Schools on Various Characteristics
Compare school characteristics between early- and late-responding schools
Compare demographic distributions of graduates from early- and late- responding schools
Compare person-level response rates of sampled graduates between early- and late-responding schools
Compare key NSRCG estimates between two groups of early- and late- responding schools before and after weighting adjustments
III. empirical investigations
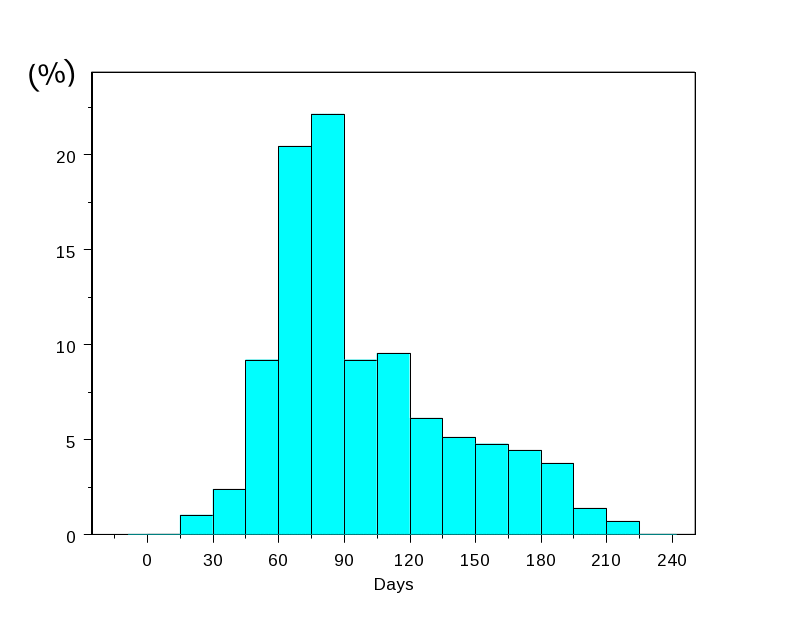
For the 2003 NSRCG, Mathematica Policy Research (MPR) collected lists of graduates for a period of about seven months and achieved about a 99 percent response rate (only 4 refusals out of 300 schools selected for the 2003 NSRCG). We recorded the dates of acceptance of school-submitted lists during that period. Figure III.1 shows the distribution of list submission dates for all 296 schools and indicates that the list collection period could have been shortened by about two months if the list collection response rate was compressed into a period yielding a 90 percent response rate. Shortening the list collection period by about a couple of months would allow more time for locating graduates and would save some resources for other list collection activities.
FIGURE III.1
DISTRIBUTION
OF LIST SUBMISSION DATES IN 2003 NSRCG
A primary concern is whether a shortened list collection period would adversely affect survey estimates. To respond to that critical concern, we empirically investigated the 2003 NSRCG data and executed a nonresponse analysis based on the following four options of response rates:
Option 0: 99 percent response rate (the current response rate)
Option 1: 95 percent response rate
Option 2: 90 percent response rate
Option 3: 85 percent response rate
We first classified all 300 schools as “respondents” or “nonrespondents” based on their submission dates. For example, for option 1 (95 percent response rate), we treated the first 285 schools submitting lists as respondents and the remaining 15 schools as nonrespondents. Similarly, for option 2, we treated 30 schools as nonrespondents and, for option 3, 45 schools as nonrespondents. For the sake of convenience, we use the following notations to distinguish different response rate options and the corresponding responding/nonresponding groups.
Option 0: Sample decomposition according to the 2003 final response status
EG0 consists of 296 responding schools
LG0 consists of 4 refusals
Option 1: Sample decomposition based on 95 percent school-level response rate assumption
EG1 consists of 285 early-responding schools
LG1 consists of 11 late respondents and 4 refusals
Option 2: Sample decomposition based on 90 percent school-level response rate assumption
EG2 consists of 270 early-responding schools
LG2 consists of 26 late respondents and 4 refusals
Option 3: Sample decomposition based on 85 percent school-level response rate assumption
EG3 consists of 255 early-responding schools
LG3 consists of 41 late respondents and 4 refusals
In the following sections, we present the results from empirical comparisons between early- and late-responding schools across the four response rate options.
A. School-Level Response Rates by School Characteristics
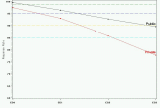
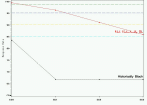
For each response rate option (0, 1, 2, 3), we compared school-level response rates by school characteristics such as control of school, whether the school is historically black, size of school (certainty versus noncertainty), and whether the school has a medical school (Figure III.2). Some findings are summarized as follows:
Private schools were less likely to respond early.
Historically black schools were less likely to respond early.
Schools large enough to be selected with certainty in the sample or granting medical degrees were more likely to respond early.
B. Demographic Composition of Graduates from Schools by School Response Status
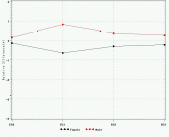
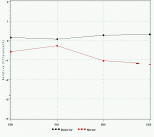
We compared demographic distributions of graduates by schools’ response status in order to identify any significant differences between early- and late-responding schools in terms of graduate characteristics. We calculated relative differences of proportions between responding schools and all sampled schools as follows:
 ,
,
where
 is a
weighted proportion estimate based on graduate counts from responding
schools in EGi, i = 0, 1, 2, 3; and
 is a
weighted proportion estimate based on graduate counts from all
sampled schools. We calculated the weighted proportions based on the
school-level sampling weights. Figure III.3 shows the relative
differences of key demographic proportions for each of four
responding groups (EG0, EG1, EG2, EG3). A horizontal line at 0 may
be used as a benchmark. The relative difference close to 0 means that
the proportions by graduates’ characteristic do not differ
between respondents and the full sample.
SCHOOL-LEVEL RESPONSE RATES BY CHARACTERISTICS ACROSS FOUR RESPONSE RATE OPTIONS
Private versus Public Historically Black
Certainty Granted Medical Degree or Not
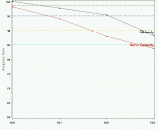
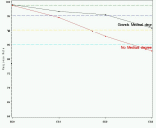
FIGURE III.3
RELATIVE
DIFFERENCES OF WEIGHTED PROPORTION OF DEMOGRAPHIC GROUPS BY THEIR
SCHOOL-LEVEL RESPONSE STATUS
By Gender By Degree Level
By Race/Ethnicity
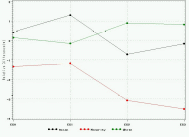
If the collection of graduate lists concluded before it was scheduled to conclude per the survey timeline, the sample could have underrepresented minority graduates, though not substantially; the relative difference of the sample’s minority proportion decreases from about -1 percent to below 3 percent. This observation is consistent with the finding on school characteristics that historically black colleges were less likely to respond early.
C. Graduate-Level Response Rate Comparison between Early- and Late-Responding Schools
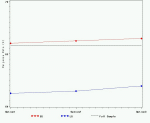
We compared response rates between graduates of early- and late-responding schools in order to determine if the response propensity of the sampled graduate might have depended on characteristics of the school from which the individual graduated. Figure III.4 (first picture) presents response rates by key domains of graduates from early- and late-responding schools (also full sample) under three response rate options (95, 90, 85 percent).
The overall response rate for the 2003 NSRCG was 65.8 percent based on sampled units from all 296 responding schools. The rate increases slightly as the school-level response rate is compromised with fewer values. Specifically, the overall response rate increases to 66.0, 66.2, and 66.5 percent, respectively, as the school-level response rate is compromised as 95, 90, and 85 percent. Response rate differences become more evident if we directly compare response rates between graduates from early- and late-responding schools. With 95 percent of school- level response, graduate response rates were 66.0 and 61.2 percent, respectively, for the early- and late-responding schools. Similarly, the response rates are 66.2 and 61.5 percent, respectively, for early- and late-responding schools with a 90 percent school-level response rate and 66.5 and 61.9 percent, respectively, for early- and late-responding schools with an 85 percent school-level response rate.
GRADUATE-LEVEL
RESPONSE RATES BY SCHOOL RESPONSE STATUS
Response Rate Location Rate
Completion Rate among Located Cases
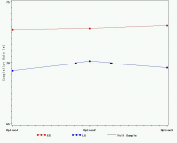
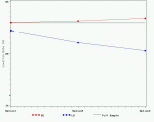
Such strikingly different response rates between graduates from early- and late-responding schools are partly attributable to the unreliable locating information provided by late-responding schools reluctant to provide lists of graduates. Figure III.4 (second picture) also shows location rates for each of the three response rate options and depicts a substantial difference for location rates between early- and late-responding schools. A more intensive, planned locating effort is suggested for future NSRCG list collection. However, it is also interesting to see a substantial difference in completion rates among located cases for early- and late-responding schools, a condition that is confounded with school characteristics. Late-responding schools were more likely to be minority-dominated schools, and minority graduates in turn were less likely to respond to the survey.
D. Comparison of Key Survey Items between Early- and Late-Responding Schools
To investigate whether graduates of early-responding schools are likely to exhibit characteristics different from those of graduates of late-responding schools on actual survey items, we compared estimates of key items such as degree level, employment status, salary, principal job, looking for work, and so forth and calculated relative differences of estimates between all respondents and respondents from each responding group (EG1, EG2, EG3) as follows:
 ,
,
where
 is a
survey estimate based on graduate respondent counts from responding
schools in EGi, i = 1, 2, 3; and
 is a
survey estimate based on all graduate respondents. Table III.1
presents relative differences of estimates for several variables such
as (1) looking for work,
(2) principal job is S&E
occupation, (3) principal job is S&E related health occupation,
(4) principal job is S&E related non-health occupation, (5)
principal job is non-S&E, (6) working for pay or profit, and (7)
annual job.
For each survey item, we made comparisons by several domains, such as full sample, degree level, race/ethnicity, and gender. For most survey items, survey estimates from early-responding groups (EG1, EG2, EG3) do not seem to differ substantially from current survey estimates based on all survey respondents. We observed virtually no differences from the full sample based on estimates for all domains for the variables “working for pay or profit during the survey reference week” and “salary.” On the other hand, variables such as “looking for job among unemployed” showed noticeable differences between full sample–based estimates and early-responding group-based estimates. In particular, such differences become larger as school-level response rates decrease. For example, the master’s degree group exhibits a relative difference larger than an estimated 3 percent for “looking for job” for EG2. This difference becomes substantially larger (11 percent) for EG3 (i.e., school-level response rate is 85 percent). All other variables show moderate differences between responding groups.
TABLE III.1
Relative
Difference comparison before and after reweighting
for key
survey items
|
|
Final weight |
Adjusted weight |
||||
Items |
Domain |
285 |
270 |
255 |
285 |
270 |
255 |
|
|
|
|
|
|
|
|
Looking for work (LOOKWK_I) |
ALL |
-1.50% |
-2.84% |
-1.32% |
-1.80% |
-2.44% |
0.51% |
Bachelor |
-1.15% |
-2.54% |
1.12% |
-1.58% |
-2.75% |
1.96% |
|
Master |
-2.84% |
-3.97% |
-10.69% |
-2.69% |
-1.24% |
-5.20% |
|
White |
2.10% |
1.65% |
4.42% |
1.59% |
1.59% |
4.25% |
|
Asian |
-5.79% |
-5.96% |
-4.24% |
-5.63% |
-5.86% |
-0.52% |
|
Minority |
-1.66% |
-5.54% |
-6.26% |
-1.74% |
-4.20% |
-3.43% |
|
Male |
-1.31% |
-6.25% |
-6.10% |
-1.23% |
-5.04% |
-4.91% |
|
Female |
-1.68% |
0.07% |
2.74% |
-2.28% |
-0.24% |
5.11% |
|
|
|
|
|
|
|
|
|
Principal Job is S&E
occupation |
ALL |
0.01% |
-2.20% |
-1.45% |
-0.10% |
-0.04% |
1.03% |
Bachelor |
0.05% |
-2.45% |
-1.28% |
0.04% |
0.26% |
2.38% |
|
Master |
-0.42% |
-2.14% |
-2.44% |
-0.39% |
-0.60% |
-1.88% |
|
White |
0.99% |
0.78% |
2.18% |
0.55% |
2.73% |
4.46% |
|
Asian |
-1.31% |
-5.16% |
-4.77% |
-0.90% |
-3.02% |
-1.53% |
|
Minority |
-1.17% |
-4.87% |
-3.77% |
-1.12% |
-2.56% |
-1.95% |
|
Male |
-0.75% |
-2.29% |
-0.30% |
-0.60% |
0.28% |
3.17% |
|
Female |
0.93% |
-1.55% |
-2.77% |
0.62% |
-0.41% |
-1.96% |
|
|
|
|
|
|
|
|
|
Principal Job is S&E
health-related occupation |
ALL |
1.97% |
1.57% |
2.13% |
0.57% |
1.62% |
1.60% |
Bachelor |
1.93% |
2.82% |
3.52% |
0.30% |
1.55% |
1.85% |
|
Master |
1.72% |
-1.59% |
-1.48% |
1.19% |
1.88% |
1.13% |
|
White |
1.98% |
1.04% |
0.27% |
0.16% |
-0.38% |
-0.72% |
|
Asian |
1.70% |
2.65% |
6.20% |
0.97% |
3.90% |
6.99% |
|
Minority |
0.92% |
1.26% |
-0.08% |
-0.58% |
1.38% |
-2.31% |
|
Male |
2.01% |
2.71% |
2.94% |
0.85% |
1.52% |
1.34% |
|
Female |
1.31% |
0.27% |
0.27% |
-0.20% |
2.32% |
2.02% |
|
|
|
|
|
|
|
|
|
Principal Job is
S&E-related non-health occupation |
ALL |
-1.18% |
1.62% |
1.54% |
0.02% |
0.56% |
1.28% |
Bachelor |
-1.50% |
0.67% |
-0.19% |
0.08% |
0.51% |
0.75% |
|
Master |
-0.50% |
3.91% |
5.88% |
-0.13% |
0.77% |
2.79% |
|
White |
-1.21% |
0.94% |
-0.26% |
-0.25% |
0.33% |
-0.23% |
|
Asian |
-0.85% |
2.23% |
3.48% |
0.31% |
0.45% |
2.22% |
|
Minority |
-0.76% |
2.09% |
4.12% |
1.05% |
1.09% |
3.96% |
|
Male |
-0.18% |
1.10% |
3.55% |
0.68% |
0.53% |
2.77% |
|
Female |
-1.44% |
1.35% |
0.71% |
-0.24% |
0.53% |
0.87% |
|
|
|
|
|
|
|
|
|
Principal Job is
non-S&E |
ALL |
0.25% |
-0.42% |
-1.07% |
-0.04% |
-0.80% |
-1.51% |
Bachelor |
0.41% |
-0.35% |
-0.90% |
0.01% |
-0.78% |
-1.58% |
|
Master |
-0.13% |
0.31% |
-0.82% |
-0.58% |
-1.21% |
-1.12% |
|
White |
-0.04% |
-1.42% |
-1.49% |
-0.26% |
-1.47% |
-1.82% |
|
Asian |
0.94% |
1.14% |
-1.68% |
0.55% |
0.11% |
-3.15% |
|
Minority |
0.93% |
0.89% |
-0.07% |
0.48% |
0.64% |
-0.22% |
|
Male |
-0.80% |
-0.73% |
-2.55% |
-0.79% |
-1.55% |
-2.56% |
|
Female |
0.95% |
-0.35% |
-0.19% |
0.43% |
-0.34% |
-0.81% |
|
|
|
|
|
|
|
|
|
Working for pay or
profit |
ALL |
0.06% |
0.03% |
-0.04% |
0.04% |
0.02% |
0.12% |
Bachelor |
0.05% |
-0.09% |
-0.28% |
0.07% |
-0.02% |
0.07% |
|
Master |
0.03% |
0.40% |
0.72% |
-0.04% |
0.19% |
0.34% |
|
White |
0.01% |
-0.07% |
-0.31% |
-0.08% |
-0.10% |
-0.16% |
|
Asian |
0.14% |
-0.01% |
0.11% |
0.20% |
0.11% |
0.39% |
|
Minority |
0.24% |
0.32% |
0.30% |
0.27% |
0.32% |
0.26% |
|
Male |
-0.03% |
-0.04% |
0.21% |
-0.14% |
-0.05% |
0.58% |
|
Female |
0.12% |
0.10% |
-0.23% |
0.19% |
0.09% |
-0.25% |
|
|
|
|
|
|
|
|
|
Average annual job
salary |
ALL |
0.42% |
0.20% |
0.13% |
0.33% |
0.24% |
0.07% |
Bachelor |
0.12% |
-0.24% |
-0.54% |
0.23% |
0.15% |
0.02% |
|
Master |
0.87% |
0.75% |
0.93% |
0.62% |
0.50% |
0.18% |
|
White |
0.68% |
0.93% |
0.25% |
0.60% |
0.94% |
0.13% |
|
Asian |
-0.13% |
-0.98% |
0.16% |
-0.30% |
-0.99% |
0.38% |
|
Minority |
0.25% |
-0.15% |
0.14% |
0.36% |
-0.06% |
-0.01% |
|
Male |
0.64% |
0.61% |
0.82% |
0.41% |
0.55% |
0.37% |
|
Female |
0.19% |
-0.02% |
-0.50% |
0.29% |
-0.01% |
-0.30% |
|
It is worthwhile to mention that the differences discussed above
were based on the current survey analysis weight. NSRCG weighting
procedures are complicated and time-consuming; they account for (1)
school-level selection probability, (2) school-level nonresponse,
(3) graduate-level selection probability, (4) graduate-level
nonresponse (separately for “not located” and
“refusals”), (5) several degrees, (5) raking adjustment,
(6) treatment of extreme weight, and (7) reraking. For details on
NSRCG weighting, see Wilson et al. (2005). We replicated weighting
procedures used for the full sample for each of the three data sets.
After making the weighting adjustments, we noted that the observed
differences in some subgroups became diluted, strongly indicating
that the school-level response rate can be compromised down to 90
percent.
IV. Summary
We observed differences between early- and late-responding schools with respect to their characteristics and graduates’ demographic profiles:
Private schools are less likely to respond early.
Minority-dominated schools are less likely to respond early.
Graduates of late-responding schools are less likely to respond than are graduates of early-responding schools.
Person-level response rates may increase with compromised school-level response rates.
Different data collection strategies can be considered for graduates of late- and early-responding schools.
List submission dates can be used for weighting adjustment.
The clustering effect may increase.
Potential bias is observed for some survey items after dropping late-responding schools.
For most survey items, differences were not substantial.
Weighting may help reduce bias.
With this empirical investigation result, we will continue to achieve high response rates, such as 99 percent at the school level, but we will remain sufficiently flexible to compromise the school-level response rate down to 90 percent. To that end, we will perform real-time monitoring to check graduate counts by key domains and thereby assess any potential bias before stopping list collection below a response rate of 99 percent.
REFERENCES
Bandeh, L., D. Jang, N. Duda, M. Satake, M. Bozylinsky, H. Haixia, and L. Xiaojing. “2006 National Survey of Recent College Graduates: Sampling Frame Development, Sampling and Location Procedures.” Princeton, NJ: Mathematica Policy Research, Inc., April, 2007.
Wilson, C., D. Jang, T. Barton, M. Pierzchala, K. Kang, and J. Tsapogas. “2003 National Survey of Recent College Graduates: Methodology Report.” Washington, DC: Mathematica Policy Research, Inc., November 2005.
M
EMORANDUM
FROM: Donsig Jang DATE: 2/25/2009
SUBJECT: Summary of National Survey of Recent College Graduates (NSRCG) Nonresponse Bias Analysis
Nonresponse is a persistent problem in survey data collection. In particular, the past two rounds of the NSRCG—NSRCG 2003 and NSRCG 2006—experienced low response rates (less than 70 percent). With the ever-increasing number of cell phone-only households and the mobility of the population that the NSRCG targets, achieving a response rate in 2008 that even equals the previous two survey rounds will be challenging. In this memorandum, we summarize the findings from our nonresponse bias analysis using 2003 and 2006 NSRCG data, and we present recommendations for formulating an exit plan for the 2008 NSRCG data collection.
Although the factors may vary somewhat from survey to survey, in general, two factors are major contributors to nonresponse in almost all surveys, including the NSRCG: (1) a failure to locate sampled persons and (2) a refusal to participate. Obviously, if we cannot locate the sampled persons and thus fail to contact them, there is zero probability of getting a response to the survey. The other group of nonrespondents consists of those who are contacted and asked to participate in the survey but refuse to do so. Consequently, to achieve target response rates, our efforts should be twofold: (1) to locate as many sampled cases as possible and (2) to convince those who refuse to respond to the survey. A solid understanding of the characteristics of hard-to-locate cases and refusals is necessary to develop a good strategy to meet these goals. With data from two complete survey rounds (the 2003 and 2006 NSRCG) and the current data from the 2008 NSRCG (through February 17, 2009), we will identify the characteristics of those who are less likely to participate in the survey (Section A).
In the 2003 and 2006 NSRCG, extra efforts such as late stage incentive and shortened interview offerings were made to convert those who were still reluctant to participate in the survey to respond to the survey. We investigated the effects of these offers on the response rate, both overall and for specific groups (Section B).
While surveyors often focus on obtaining high response rates in data collection, what ultimately matters is that the final survey estimates are accurate and reliable enough to represent unknown population characteristics. Therefore, we have investigated whether low response rates in certain groups result in estimates with substantial bias, or whether standard statistical weighting adjustments can account for nonrespondents sufficiently to reduce the bias to a negligible level (Section C).
In Section D, we provide summaries and recommendations based on the results discussed in Sections A, B, and C.
A. Response Rates: Groups of People Who Are Consistently Less Likely to Respond
In this section, we present components of the overall response rates—location rates and completion rates among located cases prior to the late-stage incentive offering—in the 2003 and 2006 NSRCGs.
1. Location Rates
The majority of the NSRCG population are in their 20s and are thus likely to be more mobile than other age groups, making them difficult to locate—but without locating them successfully, a high response rate cannot be achieved. As part of this investigation, we seek to discover whether any particular groups of NSRCG sample members have lower location rates, and if so, whether group members can be identified based on characteristics available in the sampling frame, such as their U.S. residence status, degree level, field of major, gender, or race/ethnicity.
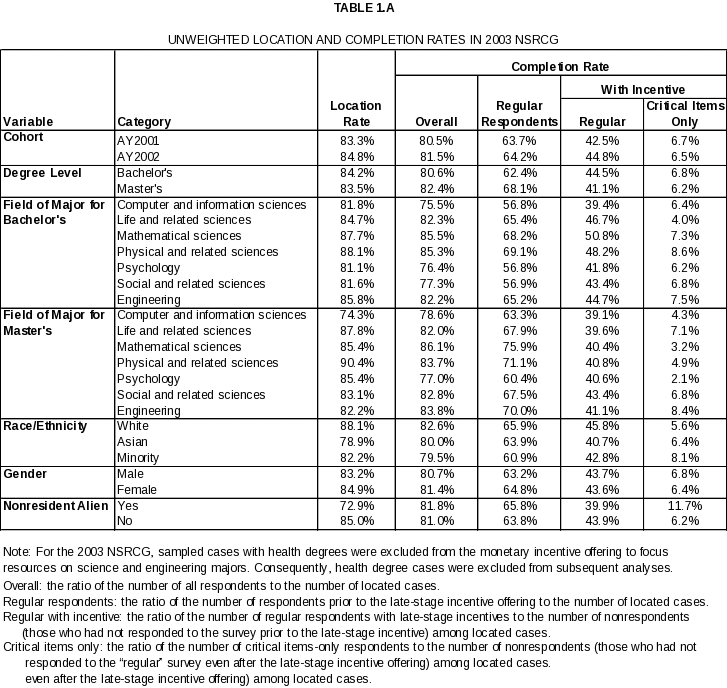
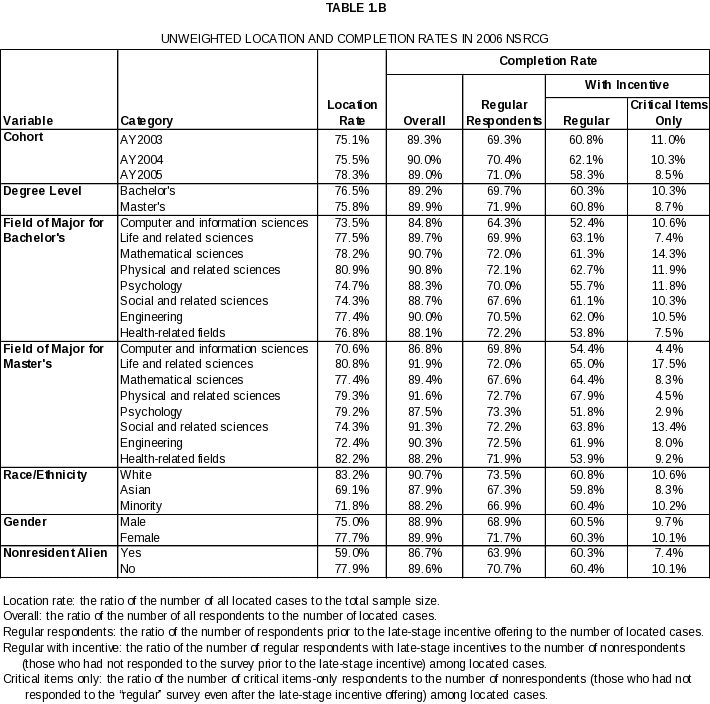
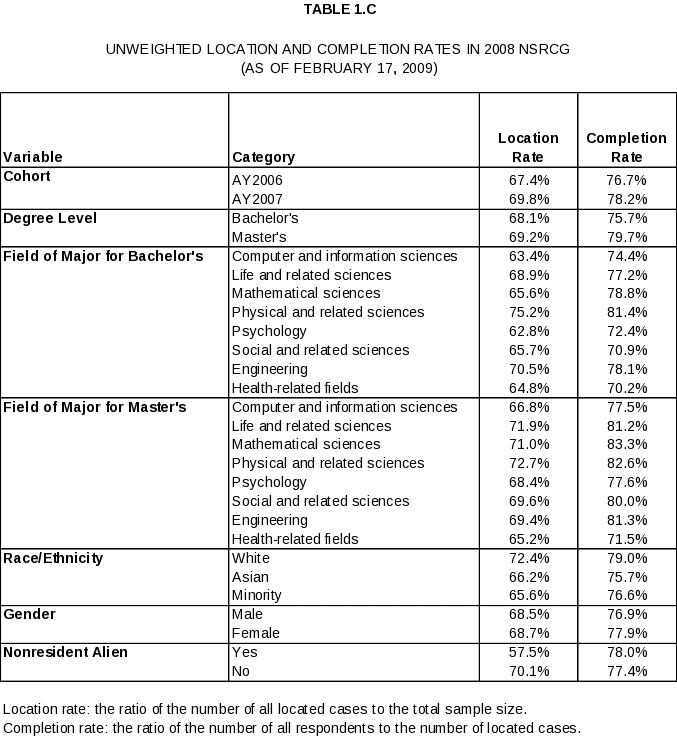
The third column of the three tables attached (Tables 1.A–1.C) shows unweighted location rates by key domain: cohort, degree level, major in each degree, race/ethnicity, gender, and residence status for the 2003, 2006, and 2008 NSRCG,3 respectively. In particular, those who completed a bachelor’s or master’s degree in computer and information sciences have consistently had among the lowest location rates in 2003, 2006, and 2008. Asian sample members also had low location rates in both the 2003 and 2006 NSRCG, and so far this trend continues in 2008. Though the difference is not substantial,4 recent degree cohort cases are somewhat more likely to be located than old cohorts. For example, in the 2003 NSRCG, the AY02 (from July 1, 2001, to June 30, 2002) cohort’s location rate (84.8 percent) was 1.5 percentage points higher than the AY01 cohort’s rate. Similarly, in the 2006 NSRCG, the AY05 cohort’s location rate was 2.8 and 3.2 percentage points higher than the AY04 and AY03 cohorts’ rates, respectively. Currently, the location rates for the AY06 and AY07 cohorts in the 2008 NSRCG are 67.4 and 69.8 percent, respectively.
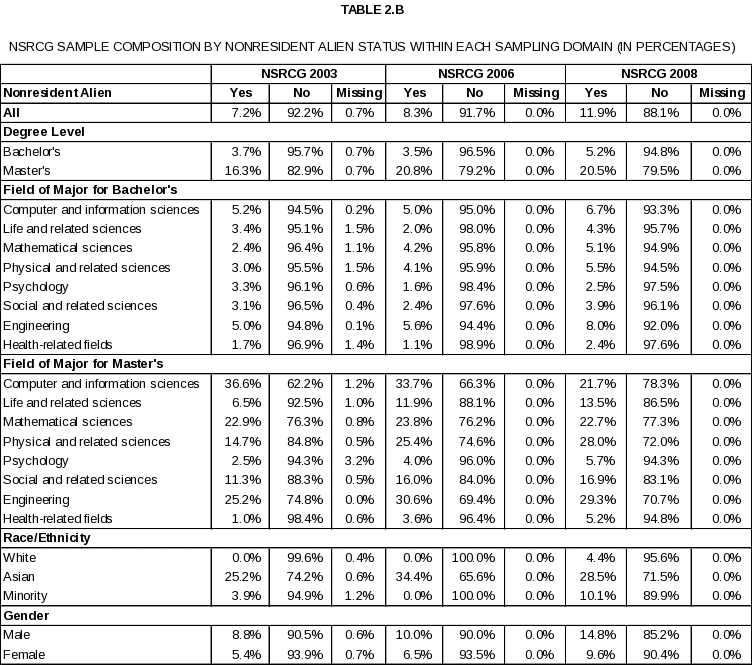
Low location rates among the Asian group and those who majored in computer and information sciences can be partly explained by the fact that a relatively large number of these sample members are nonresident aliens; they are significantly less likely to be located than U.S. residents because many nonresident aliens may leave the country after graduation. As shown in Tables 1.A, 1.B, and 1.C, nonresident alien graduates (who held a temporary resident visa) indeed had lower location rates5 than U.S. residents (both U.S. citizens and permanent residents) in 2003 and 2006 (72.9 vs. 85.0 percent in 2003 and 59.0 vs. 77.9 percent in 2006). Based on the current survey data, location rates for the 2008 NSRCG are 57.5 and 70.1 percent for nonresident aliens and U.S. residents, respectively.
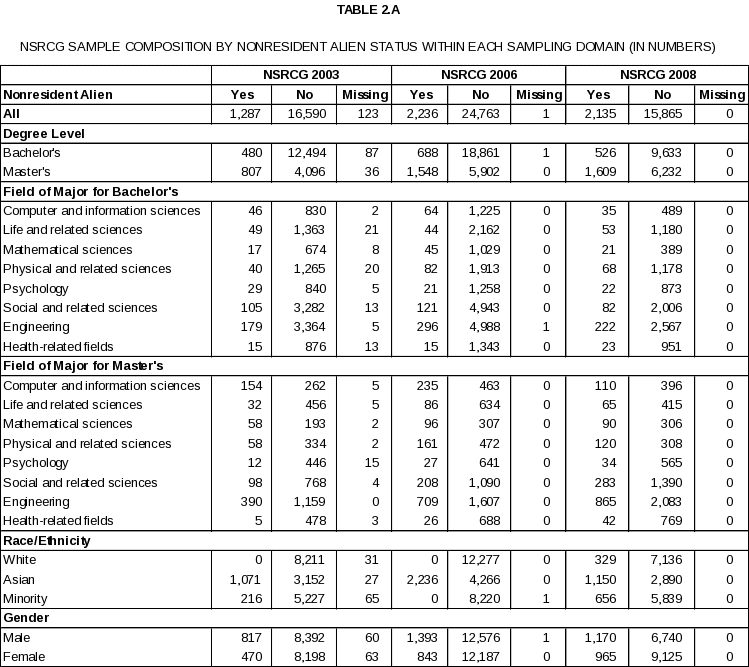
As presented in Table 2.B, the percentage6 of nonresident aliens in the NSRCG sample has increased during this decade, from 7.2 percent in 2003 to 8.3 percent in 2006 to 11.9 percent in 2008. Two fields consistently attracted the most nonresident aliens during this time period. Specifically, among master’s degree holders majoring in the computer and information sciences and engineering fields in 2008, nonresident aliens account for 21.7 and 29.3 percent, respectively. From one-quarter to one-third of the Asian group in the sample are nonresidents in the 2003, 2006, and 2008 NSRCG, while other race/ethnicity groups are mostly U.S. citizens or permanent residents—except for in 2008, when about 10 percent of minority graduates in the sample were nonresident aliens. A relatively larger proportion of males than females are nonresident aliens in all three survey years.
A key factor to successfully meeting the target response rate in the NSRCG data collection could be to substantially improve location rates among those who are Asians, nonresident aliens, or computer science majors. Therefore, even with just a little over one month left in the 2008 NSRCG data collection period, we recommend continuing to focus on locating7 and convincing refusals to respond. We also recommend that, in a future round of the survey, survey researchers and statisticians continue to work together on a locating strategy for targeting relatively hard-to-locate respondents in specific demographic and education/school groups.
2. Completion Rates Among Located Cases Prior to the Late Stage Incentive Offering
Among located cases, completion rates under the standard data collection protocol8—prior to the late-stage incentive offering—were calculated and presented in Tables 1.A, 1.B, and 1.C under the heading “Regular Respondents.” Graduates in computer and information sciences with both bachelor’s and master’s degrees have been consistently less likely to respond to the survey compared to other major groups, even after being contacted under the standard data collection protocol. Similarly, minority graduates have been consistently less responsive to the survey. On the other hand, once located, Asians were more likely to respond to the survey than those classified as minority, though still less likely to respond than the white group. This pattern can be observed in all three NSRCG surveys. Moreover, once located, master’s degree holders tend to respond at a slightly higher rate than those with a bachelor’s degree (68.1 vs. 62.5 percent in 2003, 71.9 vs. 69.7 percent in 2006, and 79.7 vs. 75.7 percent in 2008). Similarly, once contacted, new cohort cases respond at a slightly higher rate than the old cohort cases to the standard data collection protocol (64.2 vs. 63.7 percent in 2003, 71.0 vs. 70.5 and 69.3 percent in 2006, and 78.2 vs. 76.7 percent in 2008). Females are more likely to respond to the survey than males (64.8 vs. 63.2 percent in 2003, 71.6 vs. 69.9 percent in 2006, and 77.9 vs. 76.9 percent in 2008). There are conflicting results on regular completion rates among nonresident aliens between 2003 and 2006 (65.8 vs. 63.8 percent in 2003 and 63.9 vs. 70.7 percent in 2006). We suspect that in 2003 a relatively larger portion of located nonresident aliens were verified as ineligible due to non-U.S. residency during the survey reference period,9 while in 2006 fewer such cases were identified as being outside of the U.S.
As shown in Tables 1.A, 1.B, and 1.C, completion rates among located cases in 2008 are higher than in both 2003 and 2006 for all domains. The higher completion rates might be attributable to an early-stage incentive offering made to 60 percent of the 2008 NSRCG sampled cases. Among those who received an early-stage incentive, one-half were offered the incentive at both the first and second mailing and the other half at only the second mailing. A further analysis on the potential impact of the early incentive is planned and is expected to be presented to the American Association for Public Opinion Research (AAPOR) in May 2009. However, even with higher completion rates, the overall 2008 response rate is currently only a little more than 50 percent10—much less than 70 percent, the target response rate—due to low location rate. As expected, it has become more challenging to locate this young, mobile population, a growing number of whom can be reached only through cell phones. The current 2008 data collection results confirm this trend.
B. Effect of Extra, Late-Stage Data Collection Efforts
1. Effect of Late-Stage Incentives
In both the 2003 and 2006 NSRCG, a late-stage incentive offering was made to convince those who were still reluctant to respond. Tables 1.A and 1.B show conditional response rates after an incentive offering was made in the 2003 and 2006 NSRCG, respectively.
Figures 1.A, 1.B, and 1.C show cumulative response rates by completion dates, with vertical lines at a few key data collection milestones for the 2003, 2006, and 2008 NSRCG, respectively. Late-stage incentive offerings clearly helped boost response rates, as we can see from charts for the 2003 and 2006 NSRCG. For example, in the 2003 NSRCG, an initial rise in the response rate can be noted in the first few weeks. The rate slowed a bit before the second mailing of the questionnaire, but the second mailing caused another boost. CATI followup boosted the response rate further, although not as much as expected. The 2003 incentive experiment had very little effect on the overall response rate because the incentive had only been offered to a small subset of nonrespondents.11 However, once the incentive offer was extended to all nonrespondents, it boosted response rates quite a bit during the one-and-a-half-month period; rates rose about 15 percentage points before the data collection closeout. A similar pattern is observed for the 2006 NSRCG in Figure 1.B.
While offering an incentive helps boost response rates, it does not necessarily lessen the response rate variation. In other words, offering incentives does not encourage higher response rates from those who were less likely to be located or to respond than others. For example, in the 2003 and 2006 NSRCG, after the incentive offer, bachelor’s or master’s degree holders in computer and information sciences were still less likely to respond to the survey than other major groups (Tables 1.A and 1.B). Similarly, white sample members were more responsive to the survey with or without incentives, compared to other race/ethnicity groups. This finding strongly supports the National Science Foundation’s (NSF’s) proposal12 to differentiate the incentive offering based on the current response rate in order to provide incentives more to those in underachieving sampling cells than to others. This will not only help boost the response rate but will also help lessen response rate variation.
Though not as significant, we note some other findings:
The incentive worked better for bachelor’s than master’s degree holders in 2003 but not in 2006.
As stated above, incentives seemed to work best for white respondents, followed by minority and Asian groups (in that order) in 2003 and 2006.
Unlike regular completion rates, we found no gender gap in the completion rate with incentives in either year.
Figure 1.C shows cumulative response rates by date for the 2008 NSRCG through February 17, 2009. As seen in the figure, the tangent line of the current curve on the most recent date is toward zero, indicating how slowly completed surveys flow in. In addition to other efforts made to boost response rates, the late-stage incentive offering13 is an empirically proven treatment to convert refusal cases. So we strongly recommend that monetary incentives be used in a timely fashion to obtain responses from those who might not have responded otherwise. Because about 60 percent of the 2008 NSRCG total sample has already been offered an early monetary incentive, however, we would expect only a 5 to 8 percent increase in the overall response rate from such late-stage incentive offering.
2. Effect of Critical Items-Only Questionnaires
In 2003 and 2006, hard-core nonrespondents who refused to complete the full survey even with the incentive were allowed to respond to only a handful of critical items on the survey. As a result, there was a tiny jump in response rates during the late-stage incentive period, as shown in Figures 1.A and 1.B. About one to two percent of the final respondents completed such a shortened questionnaire in the 2003 and 2006 NSRCG. In a logistic regression analysis (not reported in this memo), we found that the minority group was more likely to respond to a shortened questionnaire than other groups in the 2003 and 2006 NSRCG. No other variables were statistically significant. This indicates that, although this extra effort may help increase response rates, it does not necessarily improve the response rate of one group more than another, except for the minority group.
C. Assessments of Bias Due to Nonresponse
1. Effect of Not-Located Cases on Survey Estimates
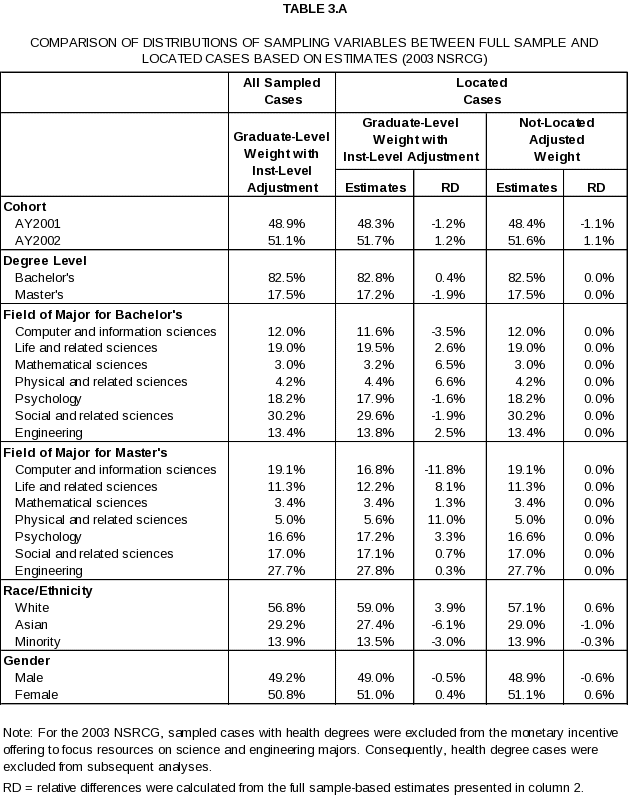
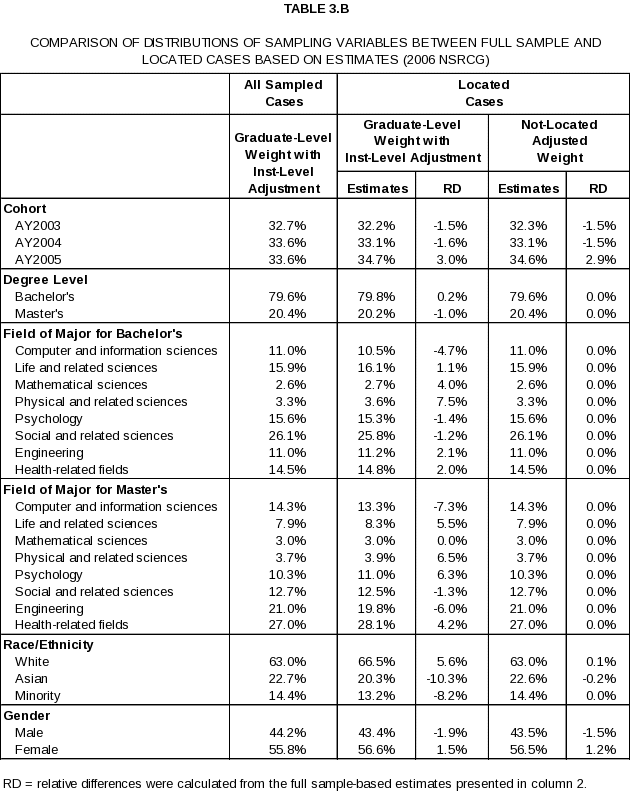
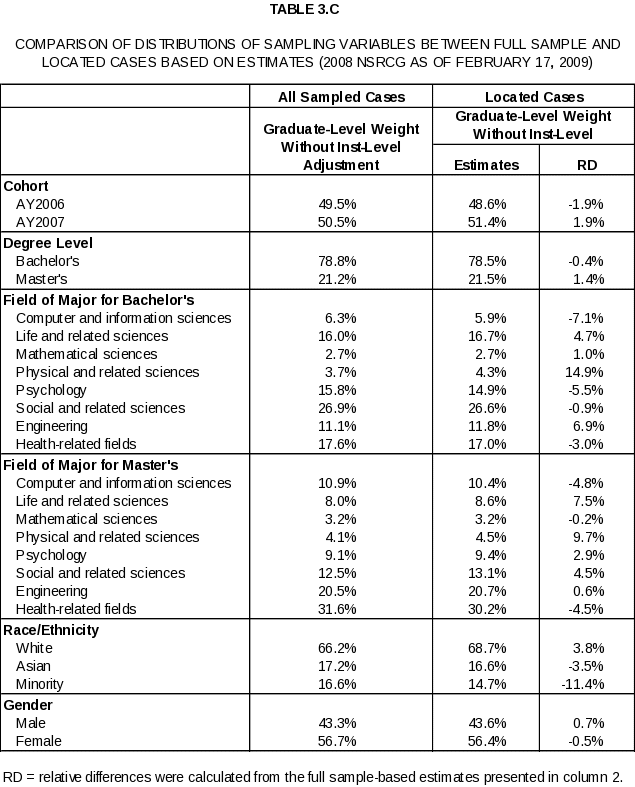
Tables 3.A, 3.B, and 3.C show percentage estimates based on the full sample and located cases-only sample for each key domain using the sampling weight14 for the 2003, 2006, and 2008 NSRCG, respectively. We can see that, without appropriate weighting adjustments to compensate for not-located cases, the variation in location rate would result in biased estimates for population proportions (or equivalently, total counts) in key domains. Low location rates can result in underestimation of the corresponding group. Specifically, in the case of those with master’s degrees in computer and information sciences, the estimates using located cases with unadjusted sampling weights are 11.8 and 7.3 percent less than estimates based on the full sample in the 2003 and 2006 NSRCG, respectively. Similarly, with low location rates for the Asian group, the percentage estimates based on the located cases are 6.1 and 10.3 percent less than estimates based on the full sample in the 2003 and 2006 NSRCG, respectively.
However, discrepancies due to the variation in location rates were mostly reduced through weighting adjustments, as presented in the tables under the “Not-Located Adjusted Weight” column. Relative differences between the full-sample estimates and the ones based on located cases with not-located adjusted weights are less than three percent for all characteristics in both 2003 and 2006 NSRCG. This empirical result suggests that bias due to differential location rates can be substantially reduced via appropriate weighting adjustments, assuming that the likelihood of being located depends on education and demographic characteristics presented in the table.
2. Bias Assessment with Regular Respondents Only
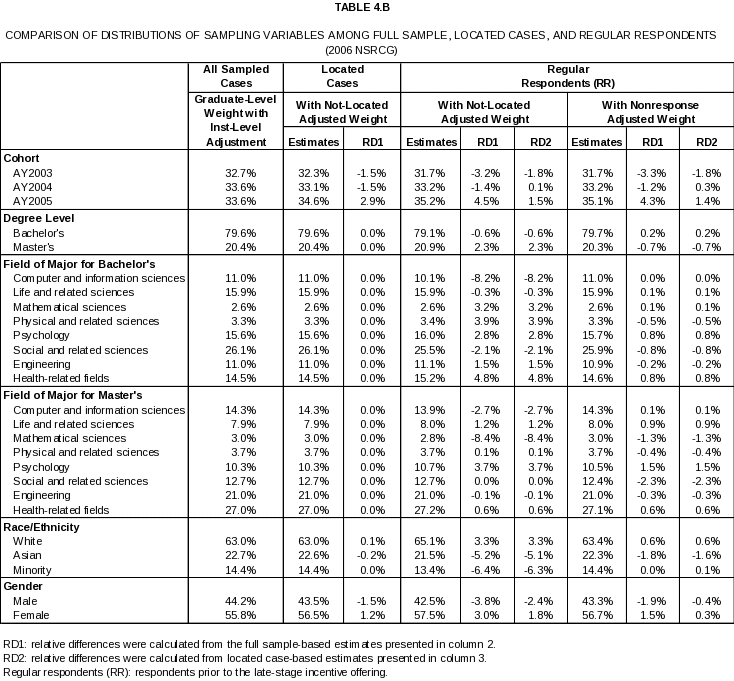
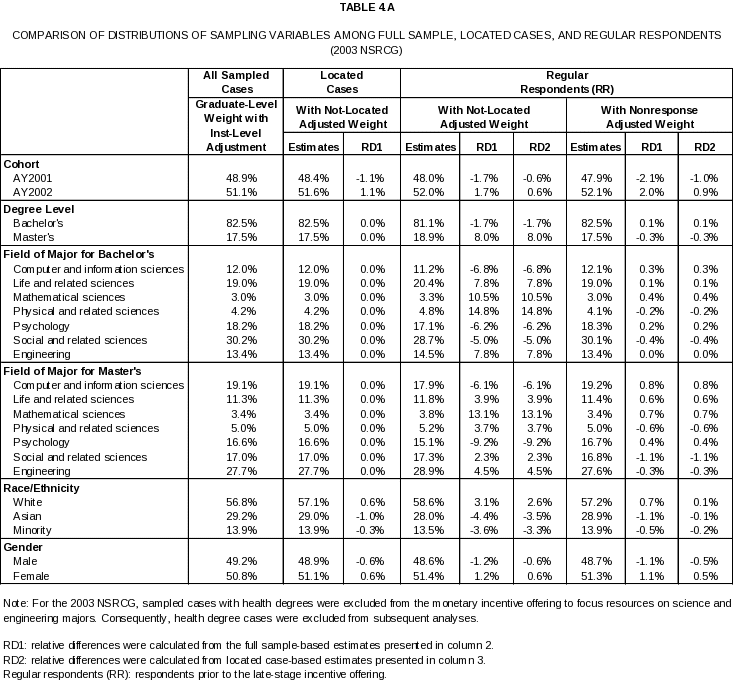
Tables 4.A, 4.B, and 4.C present survey estimates for percentages of key domain categories based on the full sample, on all located cases, and on regular respondents with and without nonresponse adjustments. Variation in regular completion rates among located cases prior to offering the incentive may have contributed to under/overestimation of the percentage of key sampling groups. For example, among all bachelor’s degree holders in 2003, the number majoring in computer and information sciences is estimated at 11.0 percent among regular respondents using not-located adjusted weight—which is about 6.8 percent less than the estimate based on the full sample or on all located cases. On the other hand, the percentage of bachelor’s degree holders in physical and related sciences in 2003 was overestimated by about 14.8 percent when using regular respondents, as compared to estimates based on the full sample or located cases only. A similar pattern can be observed in the 2006 NSRCG. Moreover, due to the relatively high completion rates among white graduates in the 2003 and 2006 NSRCG, their percentage among regular respondents was overestimated by a little over three percent when compared to the full sample-based estimates, while other race/ethnicity groups such as Asians and minorities were underestimated by about three to seven percent. With a similar completion rate variation currently observed in 2008 (Table 1.C), we can expect the same magnitude of potential bias in estimating survey characteristics after the data collection.
Again, with a carefully implemented weighting adjustment procedure, such bias can be mostly compensated for. The last three columns in Tables 4.A and 4.B show estimates and relative differences in estimates, with appropriate weighting adjustments, for the regular respondents. As the tables show, the weighting adjustments reduce the relative differences to less than one percent. This strongly suggests that, if response propensities among the NSRCG population are mostly explained by characteristics listed in the first column in the tables, nonresponse bias can be greatly reduced through weighting adjustments.
3. Bias Assessments Using Different Response Groups
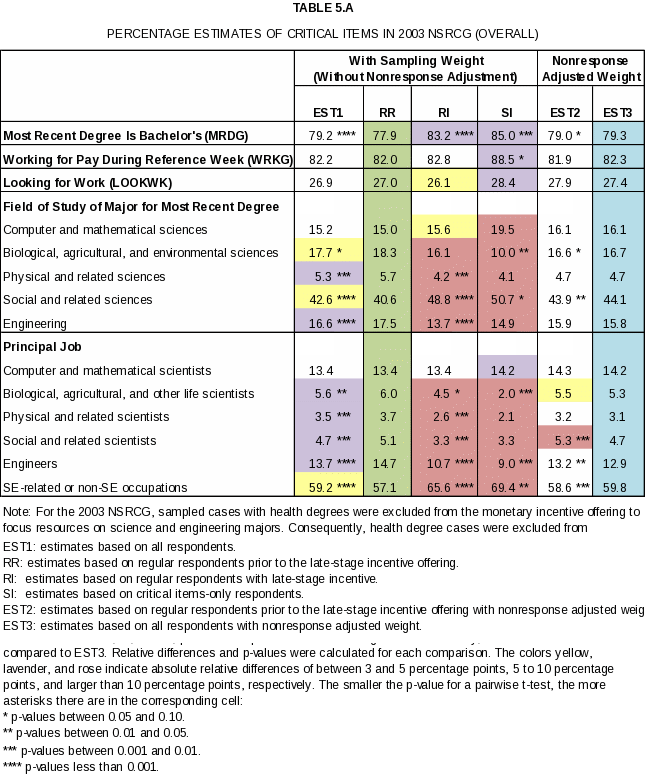
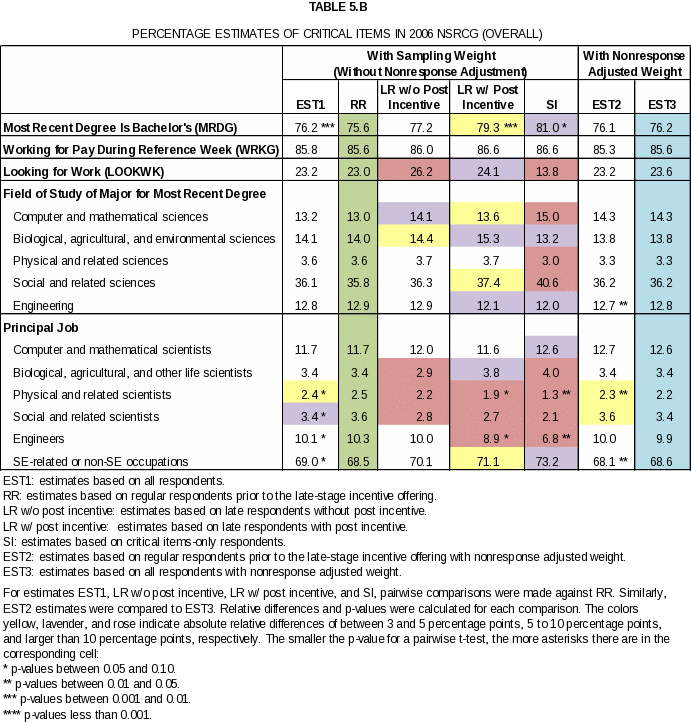
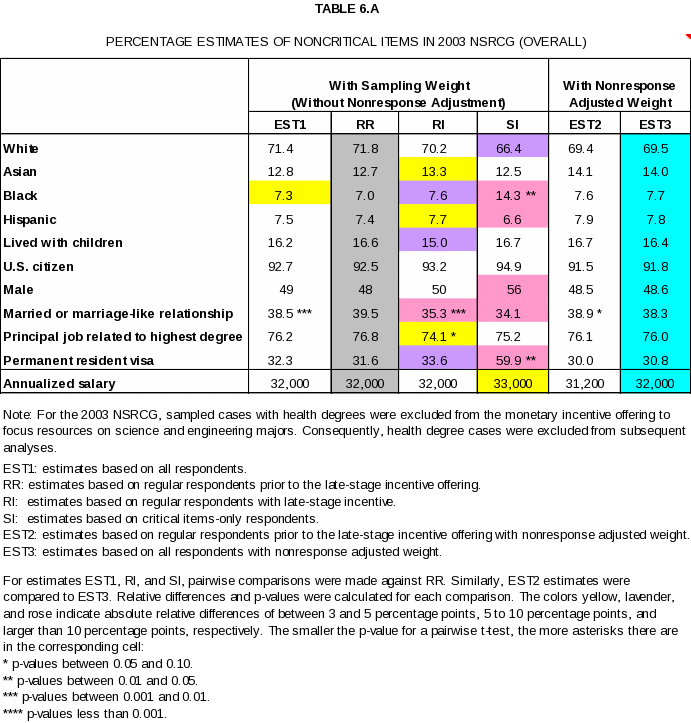
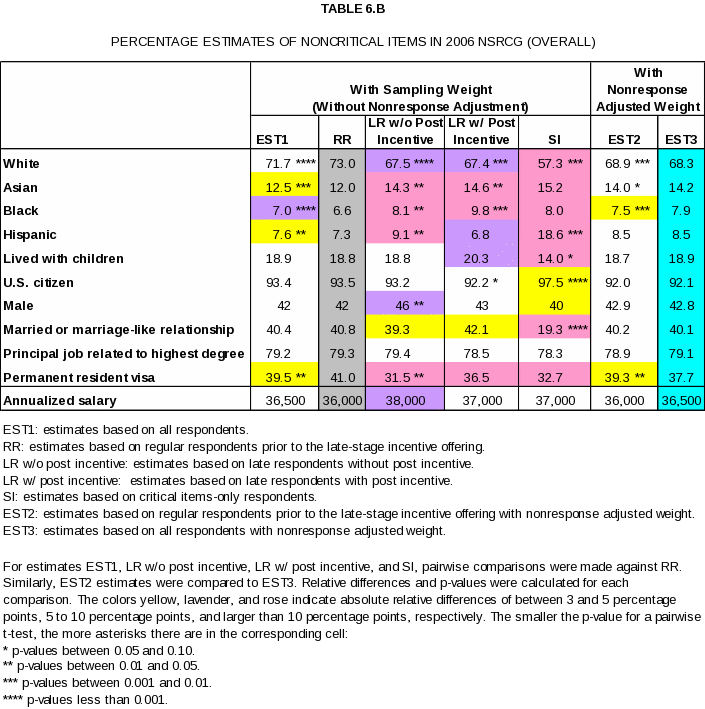
We calculated estimates for several critical and noncritical items with different sets of respondents. Tables 5.A and 5.B present estimates for critical items in the 2003 and 2006 NSRCG, respectively. Noncritical items are presented in Tables 6.A and 6.B. All four tables have similar formats, as follows:
First column: variable
Second column (EST1): estimates with all respondents using the sampling weight without nonresponse adjustments
Third column (RR): estimates with regular respondents using the weight without nonresponse adjustments
Fourth column (RI)15: estimates with respondents with late-stage incentives using the weight without nonresponse adjustments
Fifth column (SI): estimates with critical items-only completes using the weight without nonresponse adjustments
Sixth column (EST2): estimates with regular respondents using the nonresponse adjusted weight—this is a counterpart to RR in the third column
Seventh column (EST3): estimates with all respondents using the nonresponse adjusted weight—this is a counterpart to EST1 in the second column
For estimates under columns 3 to 5 (EST1, RI, and SI), pairwise comparisons were made against estimates based on regular respondents only using the weight without nonresponse adjustment (RR). Similarly, estimates under column 6 (EST2) were compared to those under column 7 (EST3). Relative differences and p-values were calculated for each comparison. Tables 5.A, 5.B, 6.A, and 6.B show estimates for critical and noncritical items under different estimation options, with cells highlighted in different colors based on the magnitude of absolute relative differences. Specifically, the colors yellow, lavender, and rose indicate absolute relative differences of between 3 and 5 percentage points, 5 to 10 percentage points, and more than 10 percentage points, respectively. The smaller the p-value for a pairwise t-test, the more asterisks there are in the corresponding cell: for p-values between 0.05 and 0.10, there is one asterisk. For p-values between 0.01 and 0.05, there are two asterisks. For p-values between 0.001 and 0.01, there are three asterisks, and for p-values less than 0.001, there are four asterisks.
As shown in Tables 5.A and 5.B, we found significant differences between regular respondents and late respondents. For example, bachelor’s degree holders are less likely to respond to the survey unless some incentives are offered; percentage estimates for bachelor’s degree holders based on respondents with late-stage incentives are significantly higher than those based on regular respondents (RR) in both the 2003 and 2006 NSRCG. However, such potential bias seems to be phased out through nonresponse adjustments, as there appears to be little difference between the two nonresponse adjusted weight-based estimates (EST2 and EST3) in the 2003 and 2006 NSRCG.
The critical items-only group has a larger percentage of employed respondents than other response groups in 2003. This indicates a potential nonresponse bias if the nonrespondents are similar to the critical items-only respondents. However, due to small sample size of critical items-only respondents, no statistically significant differences were identified. In fact, the 2006 NSRCG data show a negligible difference between regular respondents and critical items-only completes in the percentage of working people. Similarly, most of the large relative differences between regular respondents and critical items-only respondents on survey estimates are not statistically significant due to the small sample size of critical items-only completes. For example, in the 2003 NSRCG, the relative difference in estimates between RR and SI groups for the proportion of those who had a job in physical and related sciences is larger than 10 percent with no statistical significance.
Tables 6.A and 6.B show estimates for noncritical items. In both the 2003 and 2006 NSRCG, most noticeable differences between regular respondents versus all respondents on survey estimates, caused by significant differences between regular and late respondents, are greatly mitigated—to the point of being negligible—after appropriate nonresponse weighting adjustments.
Notice that all estimates for noncritical items under SI (with critical items-only completes) are not based on actual responses but on imputed values. We can see substantial differences between regular respondents and this SI group on some noncritical items. For example, in 2003, the percentage of permanent residents among non-U.S. citizens was reported as 32.3 percent based on the survey data; however, this percentage was reported as 59.9 percent based on estimates drawn from the critical items-only respondents. This might suggest a need to further investigate the imputation of noncritical items for the critical items-only respondents, as such an extreme value can cast doubt on the data quality. In fact, in 2006 the overall estimate of the percentage of permanent residents was 39.5 percent (larger than the estimate in 2003), but the estimate based on critical items only was 32.7 percent, which is much less than the 2003 estimate.
D. Summary and Recommendations for the future
In summary, a continued focus on locating is needed to achieve a target response rate. In particular, certain graduates have been consistently less likely to be located: old cohorts, master’s degree holders, computer and information science majors, social and related sciences majors, nonwhites, males, and nonresident aliens. Under the standard data collection protocol, the same groups listed above were also less likely to respond to the survey, except for those with master’s degrees.
Response rates increase substantially as monetary incentives and critical items-only interviews are offered. Response to offers of incentives was at best equally good for these groups as for other groups. This strongly supports the idea of differentiating the proportions of incentive recipients in each sampling cell based on the current response rates to compensate for differences in response rates. On the other hand, a shortened, critical items-only interview helped boost response rate by only a little more than one percent—and, like incentive offering, this option did not specifically gain more responses from those who were less likely to respond to the full interview. With this option, we make a serious trade-off for only a tiny response rate gain, incurring mass missing data since the critical items-only respondents leave blank almost all noncritical items. Though it may warrant further investigation, this significant difference between regular respondents and critical items-only respondents may be attributable to the mass imputation of all noncritical items for the latter group.
We compared percentage estimates of critical items and noncritical items among several responding groups, both with and without nonresponse adjustments. These comparisons provided empirical evidence that a usual nonresponse weighting adjustment would suffice to reduce potential nonresponse bias for most survey estimates.
Overall response rate figures may not be informative as the basis for the decision for survey close-out, since low response rates do not necessarily indicate severe nonresponse bias. Rather, we recommend that survey directors make such a decision in consultation with survey statisticians, focusing on domain-specific sample sizes of respondents since the sample is designed to meet analytic objectives for various domains.
1 Postsecondary schools eligible for the NSRCG are located in three U.S. territories—Guam, Virgin Islands, and Puerto Rico. None of the postsecondary schools in other outlying areas was conferring a degree in an SE&H field and thus was ineligible for the survey.
2 The additional eligibility characteristics are collected from survey fielding; thus, the complete eligibility status of the sample unit is determined after data collection.
3 All measures presented in this memo from the 2008 NSRCG are based on the data collected as of February 17, 2009.
4 Statistical significance tests were done only for the comparison of survey estimates (critical and noncritical items) among different response groups, as shown in Tables 5 and 6. Formal statistical tests were not executed for all other comparisons, such as location, completion rates, and frame variables, in Tables 1 through 4.
5 We suspect that eligibility rates would be different between nonresident and U.S. resident groups since a relatively larger portion of nonresident aliens are expected to leave the country and thus no longer be eligible for the survey. Any noticeable difference in the eligibility rate based on resident status will need to be incorporated into weighting adjustments to avoid bias due to unnecessary over/underestimation of nonresident aliens in the eligible NSRCG population.
6 Table 2.A shows actual sample counts by U.S. residency status in each domain.
7 To avoid unnecessarily exhaustive locating efforts on those who are ineligible for the survey due to being outside of the U.S., we might consider a quick and inexpensive way to determine the sample person’s U.S. residence status. For example, we might send nonresident aliens an email asking if they were in the U.S. during the survey reference week. However, we would need to be able to verify that the recipient is the sample person.
8 In this memo, “standard data collection protocol” refers to all procedures without late-stage incentive offering in each survey round. “Regular completion rate” refers to the conditional response rate among located cases prior to the late-stage incentive offering.
9 In 2003, complete interviews were attempted for out-of-U.S. cases to better understand their characteristics. This extra effort may have helped us to identify more out-of-U.S. cases among nonresident aliens in 2003 than in 2006. Because the 2008 completion rates currently calculated use all sampled cases for the denominator, the final 2008 rates will be subject to change with the final disposition codes. This may explain why the regular completion rate for nonresident aliens is close to that for U.S. residents (78.0 vs. 77.4 percent in 2008).
10 Weekly response rate tracking shows that the current response rate is slightly ahead of the rates in 2003 and 2006.
11 After five months of standard data collection protocol with a mixed mode in 2003, the response rate was 45 percent. With this lower-than-expected response rate, an incentive option was seriously considered to boost the rate substantially in the next two or three months. To make sure an incentive offer would work, an experiment was conducted by splitting a subset of nonrespondents into “with incentive” and “without incentive” groups. The incentive group showed a significant gain in response rates after one month of the experiment, so the incentive offering was extended to all nonrespondents, and the data collection efforts continued for another two months.
12 NSF prepared a late-stage incentive offering plan for NSRCG and two other SESTAT sister surveys, the National Survey of College Graduates (NSCG) and the Survey of Doctorate Recipients (SDR), which was submitted for OMB approval. With that approval, NSF then approved MPR’s detailed proposal about how to implement this late-stage incentive offering; implementation is currently underway in the 2008 NSRCG.
13 In 2008, about 60 percent of the total sample (10,860) was offered monetary incentives from the beginning. The remaining 40 percent (7,140 cases) has not been offered an incentive. Setting aside the currently completed sampled cases, slightly fewer than 4,000 cases would be eligible to receive a late-stage incentive offer.
14 The sampling weights used here are the graduate-level sampling weights after institution-level nonresponse adjustment for the 2003 and 2006 estimates, while the 2008 estimates are based on the sampling weight without institutional-level nonresponse adjustment. Appropriate weighting adjustments for the 2008 NSRCG, including school-level nonresponse adjustments, will be made during data processing.
15 Tables 5.B and 6.B have two columns for Late Respondents (LR): with incentive and without incentive. In 2003, the late-stage incentive was offered to all nonrespondents, while such an offer was made randomly to a subset of nonrespondents in 2006.
| File Type | application/vnd.openxmlformats-officedocument.wordprocessingml.document |
| File Title | MEMORANDUM |
| Author | Bryan Gustus |
| File Modified | 0000-00-00 |
| File Created | 2021-02-02 |
© 2026 OMB.report | Privacy Policy
