BLS Kid's Activities Study
OMB Submission Kids Activities.docx
Cognitive and Psychological Research
BLS Kid's Activities Study
OMB: 1220-0141
March 20, 2012
NOTE TO THE REVIEWER OF: |
OMB CLEARANCE 1220-0141 “Cognitive and Psychological Research”
|
FROM: |
Jean Fox Research Psychologist Office of Survey Methods Research
|
SUBJECT: |
Submission of Materials for the BLS Kids’ Activities Review |
Please accept the enclosed materials for approval under the OMB clearance package 1220-0141 “Cognitive and Psychological Research.” In accordance with our agreement with OMB, we are submitting a brief description of the study.
The total estimated respondent burden hours for the study is 40 hours.
If there are any questions regarding this project, please contact Jean Fox at [email protected] or 202-691-7370.
1. Introduction and Purpose
BLS content is quite technical and, for the most part, is geared primarily toward an audience of college age or older users. In an effort to train life-long BLS data users, we want to make BLS data more approachable to primary and secondary school audiences. Our goals are to raise awareness of BLS among younger students, educate them on our data products and usage, and help teachers and librarians use BLS to develop their academic curricula.
At present, BLS material for primary and secondary school students is limited to the “Kids’ Pages,” which have simplified versions of Occupational Outlook Handbook statements. BLS has a great deal of material that could be made more “kid-friendly.” Some examples of this content might include an allowance inflation calculator, interactive where-you-live statistics, games, activities, and lesson plans for teachers.
Toward that goal, BLS has developed several activities that could be incorporated into lesson plans for primary and secondary school students (see Attachment A). In order to ensure that the activities best meet the needs of the teachers and students, BLS would like to get feedback about the activities from the educators themselves. This document describes an effort to collect their feedback on the activities.
2. Research Design
BLS will recruit participants at several conferences, where BLS employees will be staffing exhibit booths (see section 3 for more information about the participants). At the booth, we will inform attendees about the activities and the opportunity to provide feedback. When attendees express interest, we will request a business card or have them complete a business card-sized form to collect their e-mail address (see Appendix B).
We will also have postcards to hand out with a BLS email address, in case someone wants to think about it or share the information with a colleague (see Appendix C).
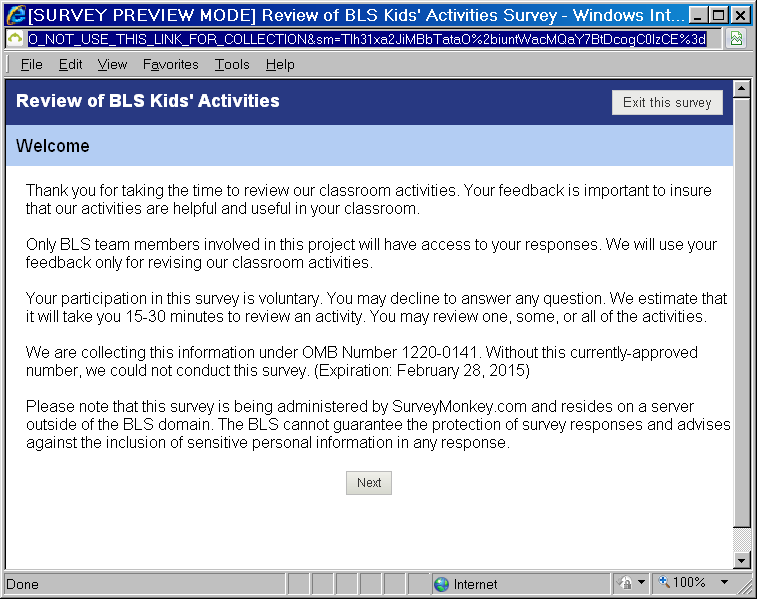
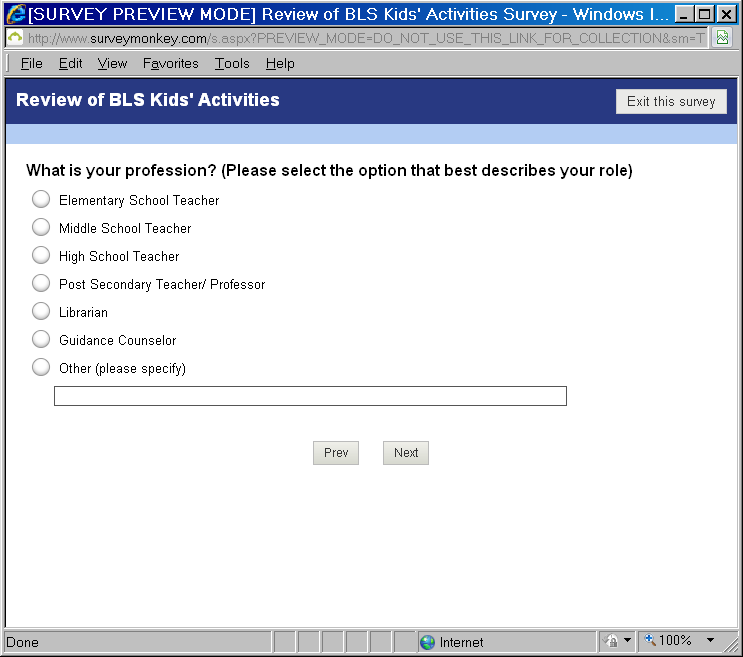
For those who express interest, we will send out copies of all the activities, along with a link to a survey using SurveyMonkey (see Appendix D). Participants can review as many of the activities as they wish. After reviewing each activity, the survey will ask the participants if they would like to review another activity.
Our experience recruiting at conferences suggests that we need to be flexible with participants. Therefore, if someone would prefer to review an activity then and there, rather than waiting to get the electronic versions, we will have paper versions of the survey available on site. The paper version will have a page for each activity they review, and a page of demographic questions (see Appendix E).
We plan to review the protocol after each conference. Since we have not used this protocol before, we will use what we learn at each conference to improve the process at the next conference. We will submit any significant changes to OMB for further review.
We will also evaluate the activity reviews to determine whether we should modify the activities as well. Since our goal is to improve the activities, it is better to test, refine, and retest than to get a large sample of reviews for a product we know will change. Because we expect to modify the activities as we go, we will note which versions we send to people. We can submit any revisions with OMB.
3. Participants
BLS staff will recruit participants at three conferences in FY12 that are likely to attract elementary, middle school, and high school teachers, along with other educators (such as librarians and guidance counselors). We expect the response rate to be low, so we plan to recruit as many people as we can, with a goal of 40 reviews between the 3 conferences.
We are currently scheduled to attend the following conferences in FY12:
April 13-17 American Educational Research Association (AERA)
June 21-27 American Library Association (ALA)
June 30-July 2 National Education Association (NEA)
In addition, we hope to attend the following conferences in FY13, depending on funding:
October 2012 Council for Economic Education (CEE)
November 2012 National Middle School Association (NMSA)
November 2012 National Council for the Social Studies
A separate request will be sent to OMB for approval for FY13 conferences.
We do not plan to reimburse participants for their participation. However, if we find we cannot get enough participation, we will change the procedure to pay participants $25 for their time.
4. Burden Hours
We expect to have four activities to review, and we would like to get at least 10 reviews per activity, for a total of 40 reviews. We expect each review to take approximately 15-30 minutes, for a total of 20 burden hours. However, since we don’t know what the actual response rate will be, we are requesting an additional 20 burden hours in case the response rate is higher, for a grand total of 40 burden hours.
5. Data Confidentiality
We will inform participants that their participation is voluntary. We will also tell them that the study will be used for internal purposes to improve the activities we are preparing. No pledge of confidentiality will be given.
Appendix A: Student Activities
Appendix B: Forms to Collect Email Addresses
Appendix C: Sample Postcard to be Distributed to Potential Participants
Appendix D: Online Survey
Appendix E: Print Survey
Appendix A: Student Activities
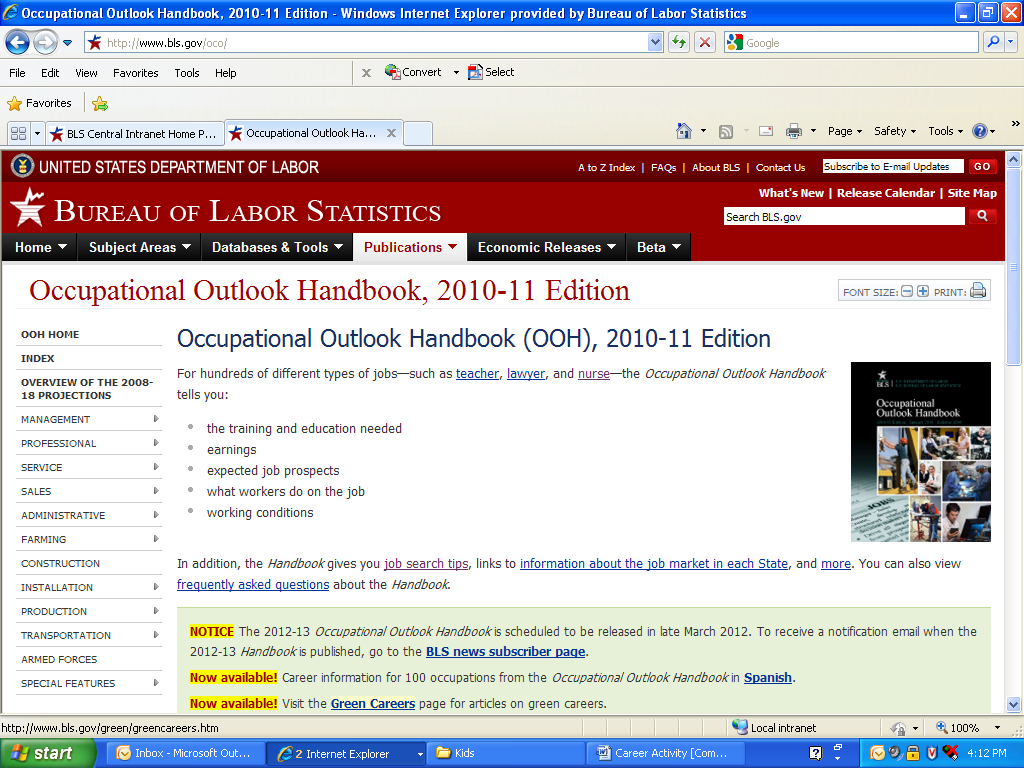
Introduction: This activity is designed to encourage students to begin thinking about their futures. Students will research careers from the 300+ occupations available in the Occupational Outlook Handbook (OOH). The Teachers Guide lists resources to help teachers develop a career curriculum for their classrooms.
Activity: Students select one or more careers and prepare a report and/ or presentation addressing the following questions:
How does the selected job fit your skills and interests?
What will you be doing on the job?
Where can you attain the necessary education and/ or training?
How many jobs are there in this occupation currently?
Is this occupation projected to grow or shrink? Why?
What is the median salary? Top 10%? Bottom 10%?
Find someone with a job in the field you are interested in and interview them. Find out:
What kind of work they do.
What do they like and dislike about the job.
What advice would they give to someone interested in a career in this field.
Additional Resources:
Students can use the National Centers for Education Statistics’ College Navigator to find out almost anything they want to know about the nation's colleges—all in one place. Students can search for institutions by using broad criteria such as school name, geographic location, and programs and majors.
The Department of Labor’s Career One Stop webpage is an excellent source of career information and includes career assessment tools to help jobseekers identify jobs that match their skills and interests.
The Occupation Outlook Quarterly (OOQ) is a quarterly magazine that provides detailed information on careers.
The Career Guide to Industries provides information on popular industries, jobs in these industries, and job prospects in these industries.
The Education Pays chart helps students to understand the value of an education.
For more classroom materials visit The Gateway to 21st Century Skills and Council for Economics Education.
Introduction: The Consumer Price Index (CPI) measures the changes in prices people pay for goods and services. BLS produces both average price data as well as price indexes. While average prices are recorded in dollars, price indexes show the change in price since a “base period.” An index is a tool that simplifies the measurement of movements in a numerical series. That is, BLS sets the average index level (representing the average price level)-for the 36-month period covering the years 1982, 1983, and 1984-equal to 100. BLS then measures changes in relation to that figure. An index of 110, for example, means there has been a 10% increase in price since the reference period; similarly, an index of 90 means a 10% decrease. Movements of the index from one date to another can be expressed as changes in index points (simply, the difference between index levels), but it is more useful to express the movements as percent changes. This is because changes in index points tell us how prices changed relative to the base level. In contrast, percent changes allow us to express the change in prices between two periods of time. This activity is intended to demonstrate BLS data being used in the classroom. BLS data provide a real-world example of data that can be graphed. In this activity, students will graph 12-month percent changes to show the movement in prices over previous years.
Activity:
Each student should graph three or more percent changes on the same
graph. They may choose to graph similar items (ex. Men’s
Apparel, Women’s Apparel, and Footwear) or unrelated items that
they are interested in. This activity uses real-world data to
reinforce graphing fundamentals. Students should properly label and
title the graph, provide a scale, and be able to describe the meaning
of the graph. This activity can also be completed with graphing
calculators, Microsoft Excel, or other software to produce graphs.
Students can download data tables into Microsoft Excel using the
![]() icon
above each database generated table.
icon
above each database generated table.
Directions:
Use the One-Screen Data Search tool for All Urban Consumers (CPI-U) (http://data.bls.gov/pdq/querytool.jsp?survey=cu)
Choose the area that you want to view data for. (For the largest selection of items choose U.S. City Average.)
Select the items you wish to view price index levels for.
Be sure the “Not Seasonally adjusted (http://www.bls.gov/cpi/cpisapage.htm) option is selected, and the “Seasonally Adjusted” option is not.
Select “Add to your selection.”
Select “Get Data.” Graph the index levels for several items on the same graph.
Select the “More Formatting Options” button above the data table.
Uncheck the “Original Data Value” box and check the “12-Month Percent Change” box
Select the radio button “Select one time period” and choose December to view year over the year percent changes.
Select the “Retrieve Data” button.
Plot your results on a graph. Compare the changes in prices over time for each item and compare the general trends across all of the items chose. Discuss why these items may have experienced price changes.
Students may graph using the graph paper at the end of the activity or by using graphing software. Remind students of the elements of a graph: Title, labels on both axes and scale on both axes. The graph may also have a caption explaining the source of the data. Graph the average prices of goods over time and discuss reasons prices may change over time. After the students have finished their graphs, ask them to share with the class.
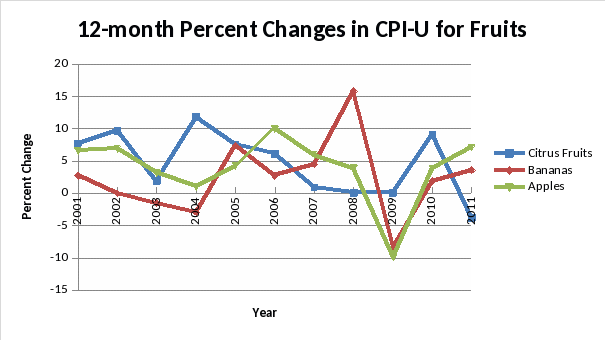
Source: US Bureau of Labor Statistics, (CPI-U, Not Seasonally Adjusted, December 12-month percent change)
Chart
Data:
http://data.bls.gov/timeseries/CUUR0000SEFK01, http://data.bls.gov/timeseries/CUUR0000SEFK02, http://data.bls.gov/timeseries/CUUR0000SEFK03
Additional Resources: For more information about the CPI, students should read, “How BLS Measures Changes in Consumer Prices”: http://www.bls.gov/cpi/cpifact2.htm and read through the CPI Frequently Asked Questions (FAQ’s): http://www.bls.gov/cpi/cpifaq.htm.
Introduction: Prices for consumer goods and services are always changing. In general, prices have increased over time; this is known as inflation. To determine how prices are changing, BLS first asks people how much money they spend on a variety of products and services. The Consumer Expenditure Survey is the tool that economists at BLS use to determine consumers’ spending habits. The results of the Consumer Expenditure Survey tell us how much of a household’s income is spent on certain items. After learning where people shop and how much they spend on certain items, BLS data collectors visit thousands of stores and other retail establishments on a monthly basis to collect prices of goods and services in urban areas throughout the country. The results of the consumer surveys are combined with the prices that were collected to calculate the Consumer Price Index (CPI). The CPI serves as the nation’s measure of inflation. The BLS created an inflation calculator to help the public easily determine changes in the purchasing power of a dollar. Purchasing power is the amount of goods/ services that can be purchased with a unit of currency, in our case that unit is U.S. Dollars.
Activity: Students should use the Inflation Calculator http://www.bls.gov/data/inflation_calculator.htm to determine the value of goods in years past and convert prices from years ago into today’s prices. For example, in 1980 a pound of potato chips cost $1.98, but in 2012 they cost $5.45.
Q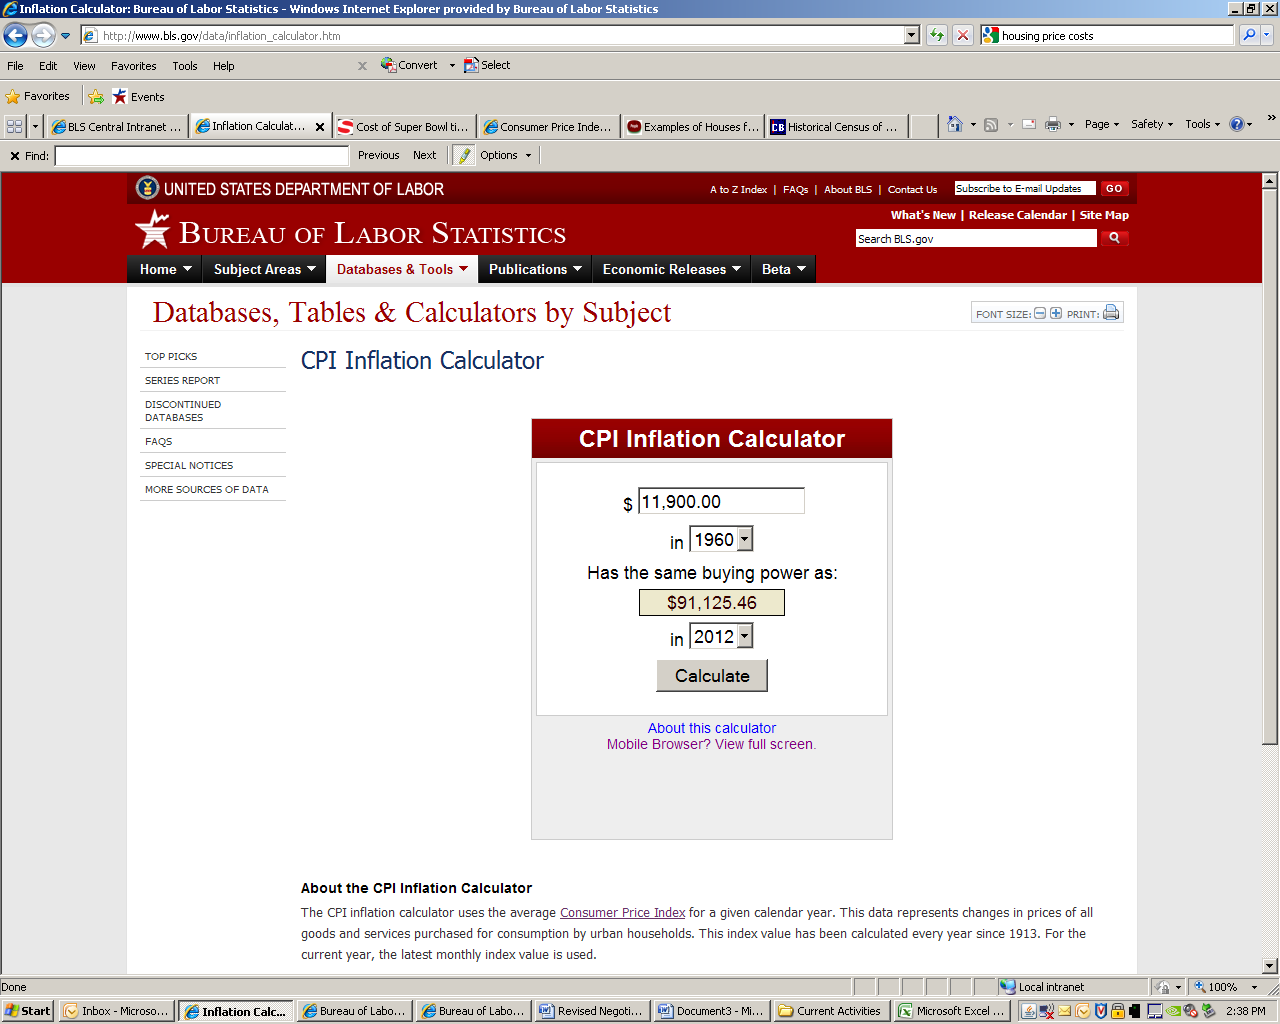 uestion
1:
According to the Census Bureau, the median value of a home was
$11,900 in 1960. In today’s dollars how much purchasing power
did $11,900 have in 1960?
Answer: In 2012, it had the purchasing power of about $91,125.00. It should be noted that this is an estimate based on prices across the country. Prices are different for products of different quality levels, products purchased in different stores, and for people who live in different places. Prices also change at different rates for different types of items. For example, in the early 2000’s, food prices increased more than prices for electronics.
Question 2: Your 75-year old grandmother says to your 5-year old brother, “When I was your age, hot dogs cost a nickel”. How much would the nickel hot dog cost in 2012 dollars?
Answer: Using BLS’s inflation calculator, you learn that the hot dog only costs $0.70. That’s cheaper than the dollar menu!
Discussion: Discuss inflation. What items have your students noticed price changes for? How have these changes affected them and their families?
Introduction: In this activity, students will learn about inflation and price changes. When items increase in price we call that inflation, when they decrease in prices we call it deflation. Measuring inflation provides us with information about the purchasing power of a dollar. BLS collects prices on products and services to develop a measure of inflation called the Consumer Price Index (CPI). BLS also publishes average prices collected for some food and utilities. Average prices are determined by adding all of the prices together and dividing by the total number of prices. This gives us a sense of what a person normally spends on a good or service.
Activity:
Use the CPI One-Screen
Data Search Tool
to determine the c![]() urrent
average price of commonly used goods. Split students into groups and
have them write down what they think the prices of these goods are
now and what they were in another year (for example, the year they
were born). Encourage students to discuss prices that they have seen
at stores and what they would expect to pay. They should also
consider why the prices of these items have changed. Award points to
the team with the closest estimate for each item. Following this
exercise, discuss prices, inflation, and the Consumer Price Index.
More information about the CPI can be found on the CPI
Frequently Asked Questions
page.
urrent
average price of commonly used goods. Split students into groups and
have them write down what they think the prices of these goods are
now and what they were in another year (for example, the year they
were born). Encourage students to discuss prices that they have seen
at stores and what they would expect to pay. They should also
consider why the prices of these items have changed. Award points to
the team with the closest estimate for each item. Following this
exercise, discuss prices, inflation, and the Consumer Price Index.
More information about the CPI can be found on the CPI
Frequently Asked Questions
page.
Directions:
1. Access the Average Price Database Search tool: http://data.bls.gov/pdq/querytool.jsp?survey=ap.
3. Select US City Average.
4. Select an item and select the “Add to your selection” button. A suggested list of items is provided below.
5. Repeat the process of selecting an item and adding it to your selection until you have selected all of the items you wish to find average prices for.
6. Select the “Get Data” button. The data will appear in charts on the next page. You can view data for earlier years by changing the date range using the dropdown bars above the tables.
Suggested items:
Handout:
Names ______________________________________ Date__________________
Item |
Price Today |
Price from Year ______ |
1)
|
|
|
2)
|
|
|
3)
|
|
|
4)
|
|
|
5)
|
|
|
6)
|
|
|
7)
|
|
|
8)
|
|
|
9)
|
|
|
10)
|
|
|
11)
|
|
|
12)
|
|
|
Fillable Answers Key
Item |
Price Today |
Price From Year ______ |
|
|
|
|
|
|
|
|
|
|
|
|
|
|
|
|
|
|
|
|
|
|
|
|
|
|
|
|
|
|
|
|
|
|
|
|
|
|
|
|
|
|
|
|
|
|
|
|
|
|
|
|
|
|
|
|
|
|
|
|
|
Appendix B: Forms to Collect Email Addresses
Appendix C: Sample Postcard to be Distributed to Potential Participants
Front:
Back:
|
Appendix D: Online Survey
Page 1
Page 2. Skip to page 4 if the response is Librarian, Guidance Counselor, or Other.
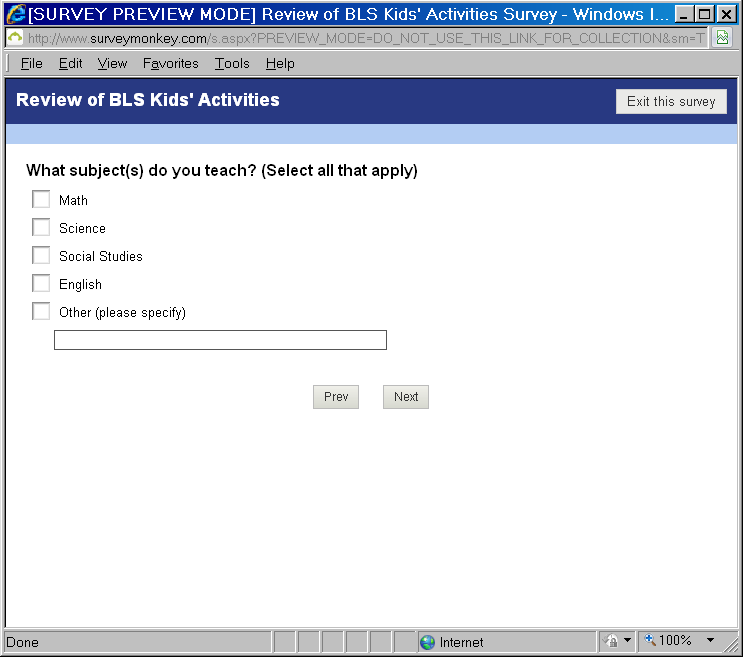
Page 3.
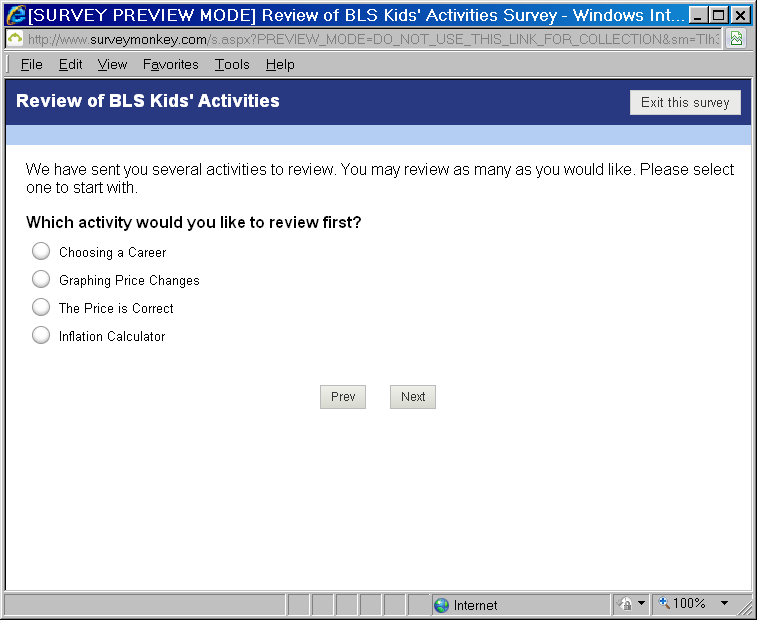 Page
4.
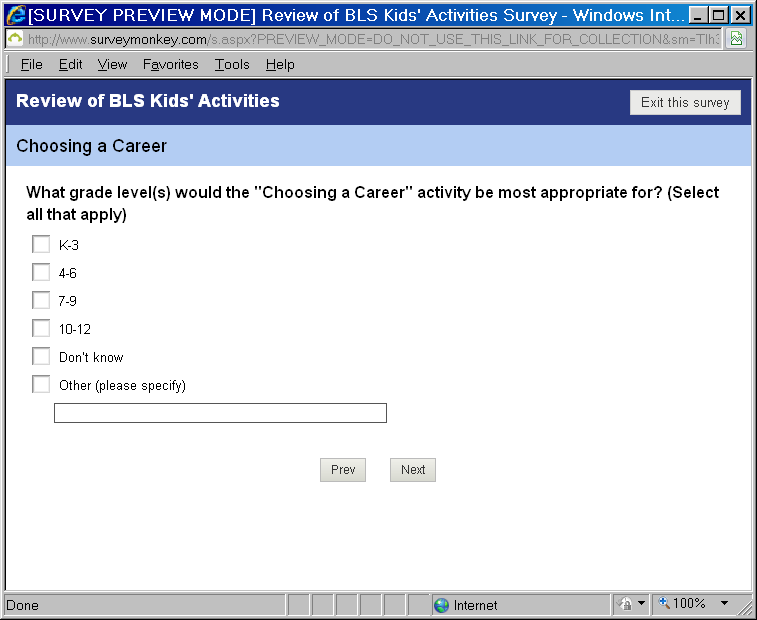 Page
5. (Note: Pages 5 – 12 are shown for the “Choosing a
Career” activity. The same items will be presented for each
activity.)
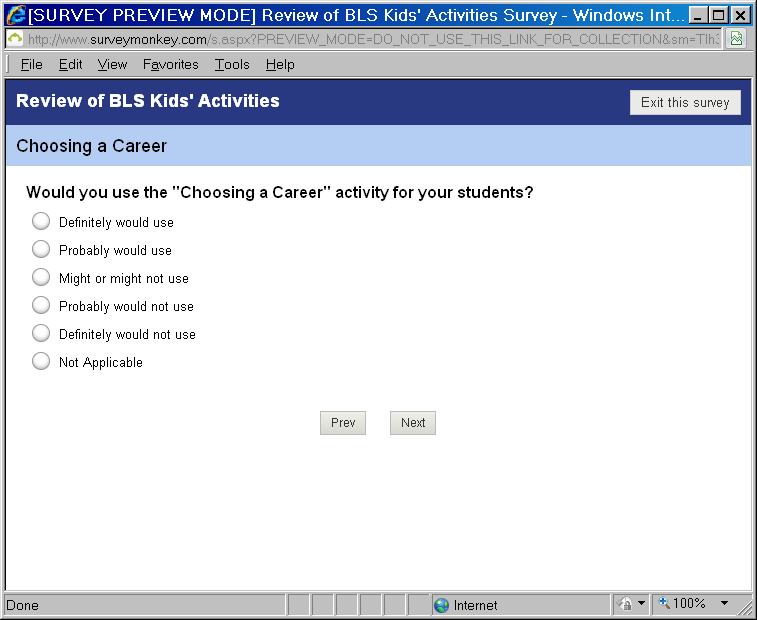
Page 6. Skip to Page 8 for all except for “Probably” and “Definitely” would not use.
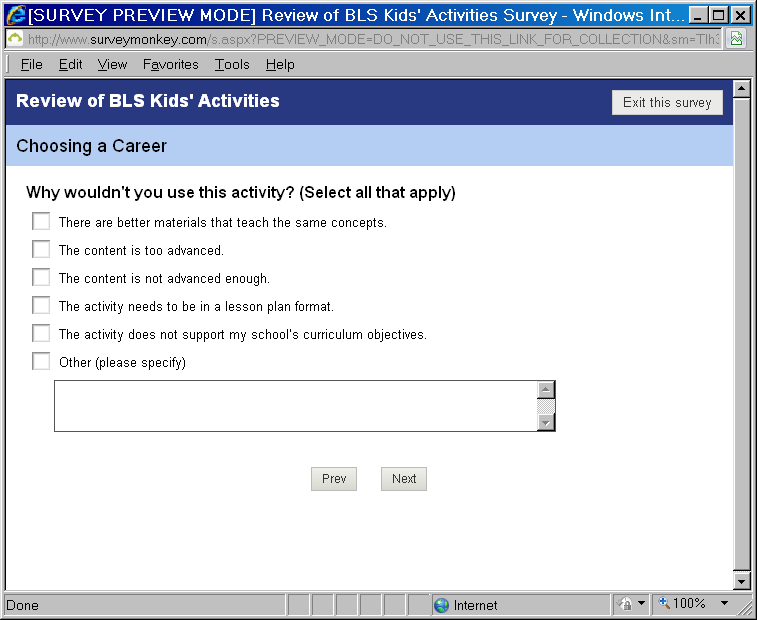
Page 7.
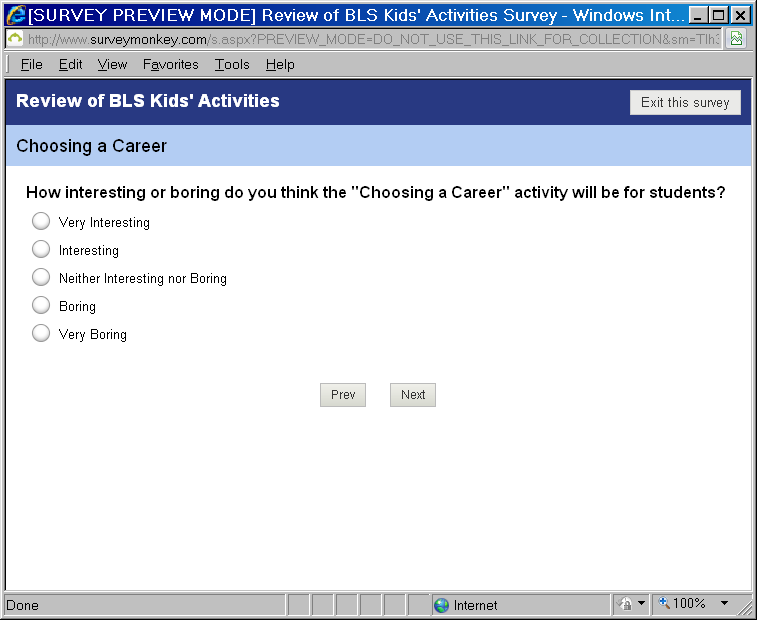
Page 8.
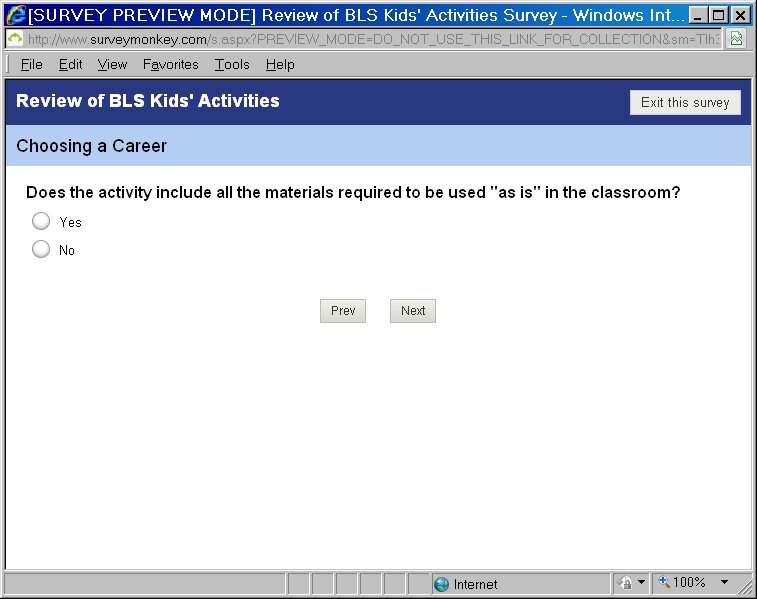
Page 9. For “Yes,” Skip to Page 11.
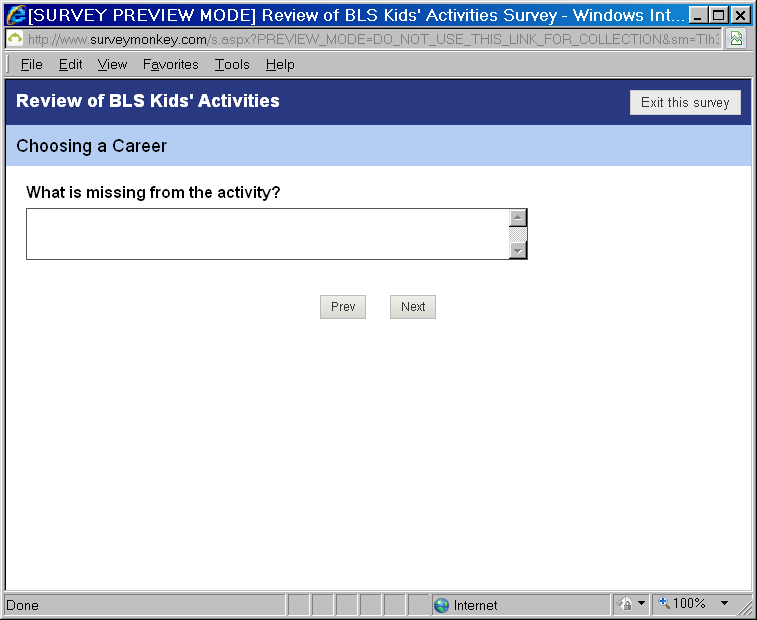
Page 10.
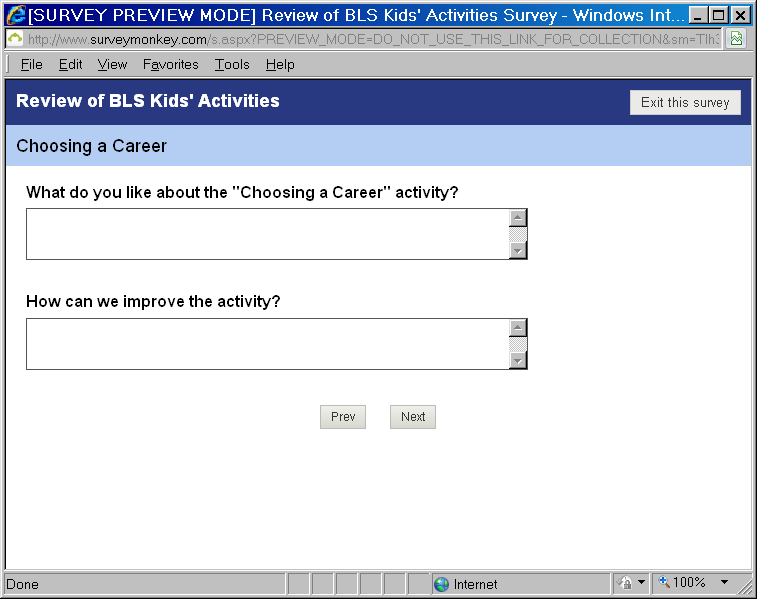
Page 11.
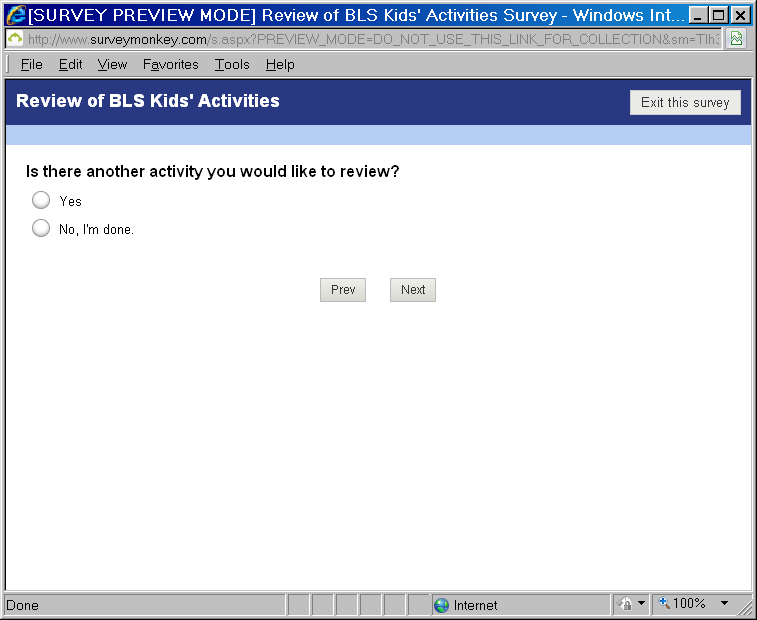
Page 12. For “Yes,” go back to Page 4.
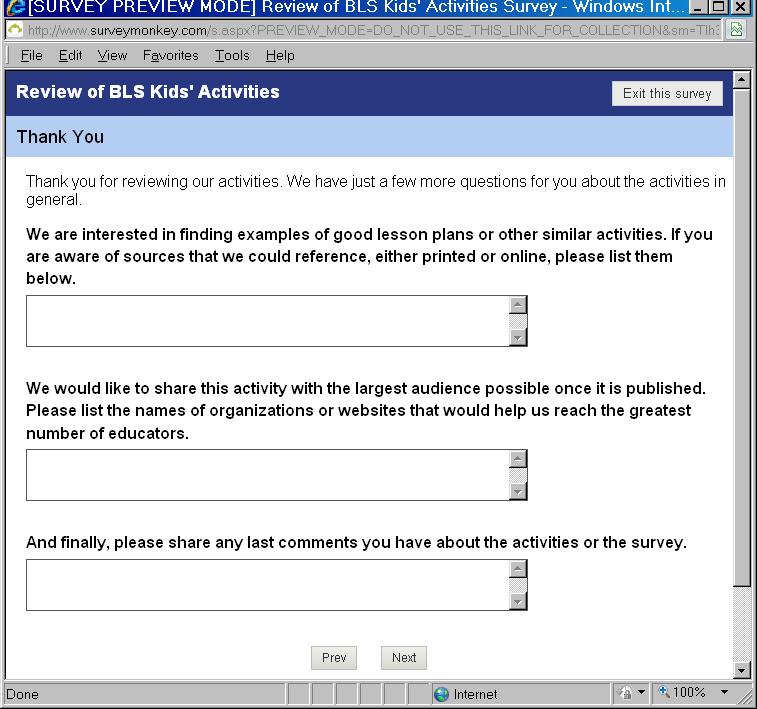
Page 13.
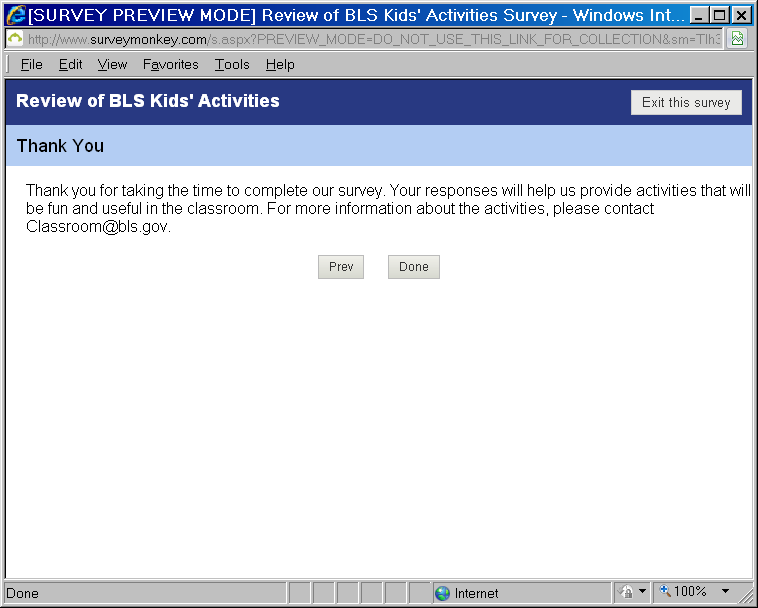
Page 14.
Appendix E: Print Survey
Thank you for taking the time to review our classroom activities. Your feedback is important to insure that our activities are helpful and useful in your classroom.
Only BLS team members involved in this project will have access to your responses. We will use your feedback only for revising our classroom activities.
Your participation in this survey is voluntary. You may decline to answer any question. We estimate that it will take you 15-30 minutes to review each activity. You may review one, some, or all of the activities.
We are collecting this information under OMB Number 1220-0141. Without this currently-approved number, we could not conduct this survey. (Expiration: February 28, 2015)
If you have any questions about the activities or the survey, please contact [email protected].
Which activity did you review?
 Choosing
a Career
 Graphing
Price Changes
 The
Price is Correct
 Inflation
Calculator
What grade level(s) would this activity be most appropriate for? (Select all that apply)
 K-3
K-3
 4-6
4-6
 7-9
7-9
 10-12
10-12
 Don’t
know
Would you use this activity for your students?
![]()
 Definitely
would use (skip
to question 5)
![]()
 Probably
would use (skip
to question 5)
 Might
or might not use (skip
to question 5)
![]()
 Probably
would not use
 Definitely
would not use
 Not
Applicable (skip
to question 5)
Why wouldn't you use the activity? (Select all that apply)
 There
are better materials that teach the same concepts.
 The
content is too advanced.
 The
content is not advanced enough.
 The
activity needs to be in a lesson plan format.
 The
activity does not support my school’s curriculum objectives.
 Other
(please specify):
How interesting or boring do you think this activity will be for students?
 Very
Interesting
 Interesting
 Neither
Interesting nor Boring
 Boring
 Very
Boring
Does the activity include all the materials required to be used as is in the classroom?
 Yes
Yes
 No.
If no, please specify what is missing:
What do you like about the activity?
How can we improve the activity?
Please share any additional comments you have about the activity.
1. What is your profession? (Please select the option that best describes your role)
 Elementary
School Teacher
 Middle
School Teacher
 High
School Teacher
 Post
Secondary Teacher/ Professor
 Librarian
(skip
to question 3)
 Guidance
Counselor (skip
to question 3)
 Other
(please specify)
(skip
to question 3)
2. If you are a teacher, what subject(s) do you teach? (Select all that apply)
 Math
Math
 Science
 Social
Studies
 English
 Other
(please specify)
3. We are interested in finding examples of good lesson plans or other similar activities. If you are aware of sources that we could reference, either printed or online, please list them below.
4. We would like to share this activity with the largest audience possible once it is published. Please list the names of organizations or websites that would help us reach the greatest number of educators.
| File Type | application/vnd.openxmlformats-officedocument.wordprocessingml.document |
| Author | fox_j |
| File Modified | 0000-00-00 |
| File Created | 2021-01-31 |
© 2026 OMB.report | Privacy Policy
