Att H - Sampling Plan
Resubmission_ICR#0923-09BK_Appendix H_Sampling Plan.docx
Registration of Individuals Displaced by Hurricanes Katrina and Rita (Pilot Project)
Att H - Sampling Plan
OMB: 0923-0045
Katrina/Rita Pilot Registry:
Feasibility Sample Selection
This document describes the sampling plan for the Katrina/Rita Pilot Registry (KPR) feasibility study. It contains the following sections: (1) sampling frame development, (2) stratification, (3) sample allocation, (4) applicant selection, (5) snowball sampling, and (6) de-duplication of final data file.
Sampling Frame Development
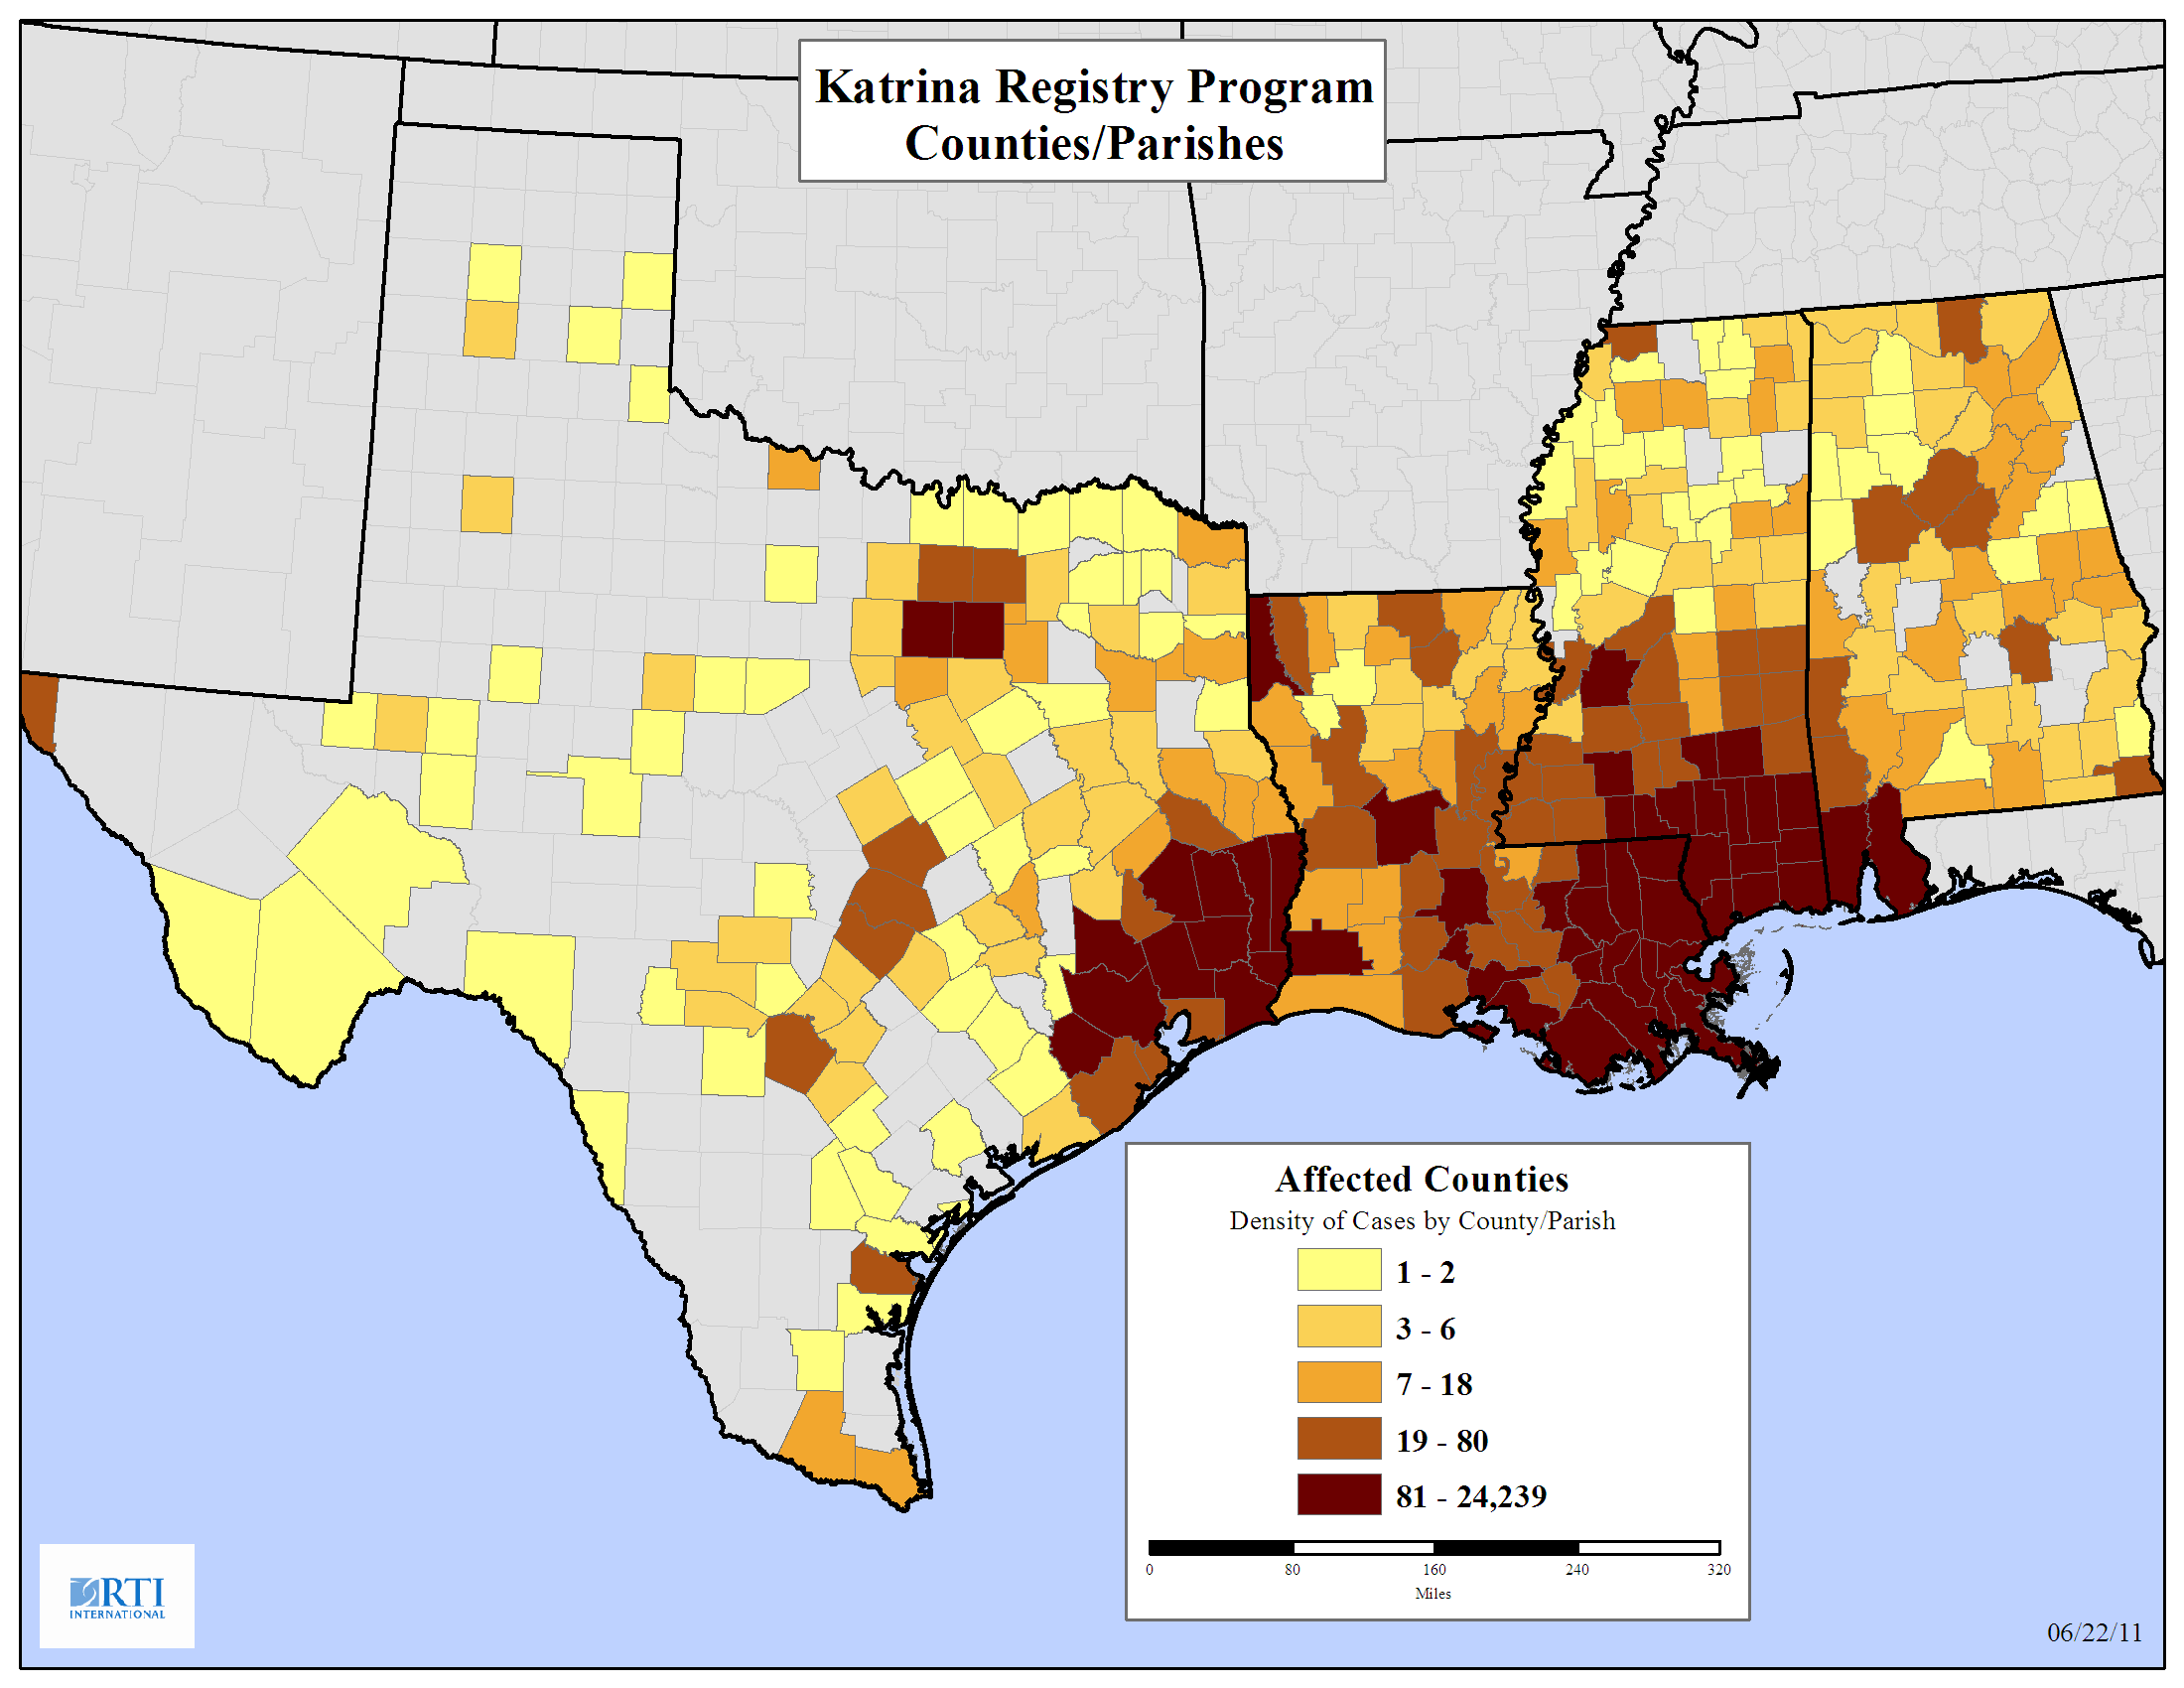
The sample will be based on the Federal Emergency Management Agency (FEMA) database provided by Centers for Disease Control and Prevention. The FEMA database is a list of adult applicants for temporary housing units (THU), where each adult represents a household that lived in a THU. Each applicant has a unique registration identification number. For registration identification numbers that had multiple observations in the database, one observation was selected at random so that each observation in the database represented a unique registration identification number. This resulted in a database that contained 118,684 observations. See Appendix A: Distribution of Applicants for a map that shows the density of applicants across counties/parishes. For the feasibility study, sample selection will occur in Alabama, Louisiana, Mississippi, and Texas. The database has 114,292 observations with a geocoded address in Alabama (2,447), Louisiana (70,832), Mississippi (34,482), and Texas (6,531).
Stratification
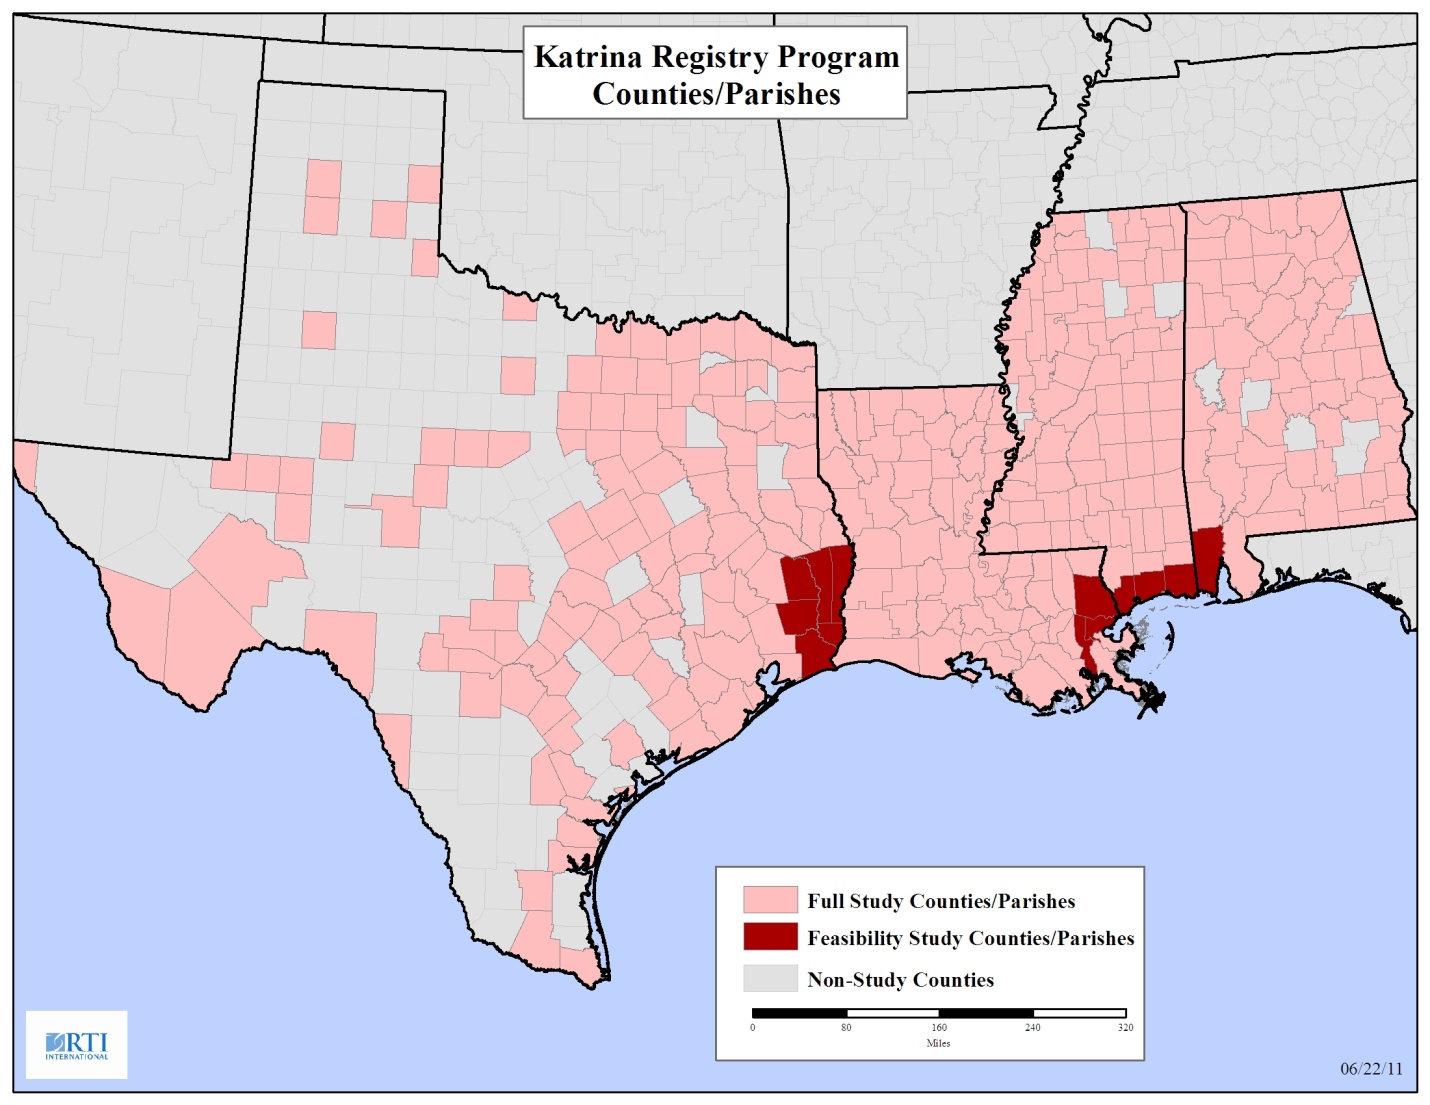
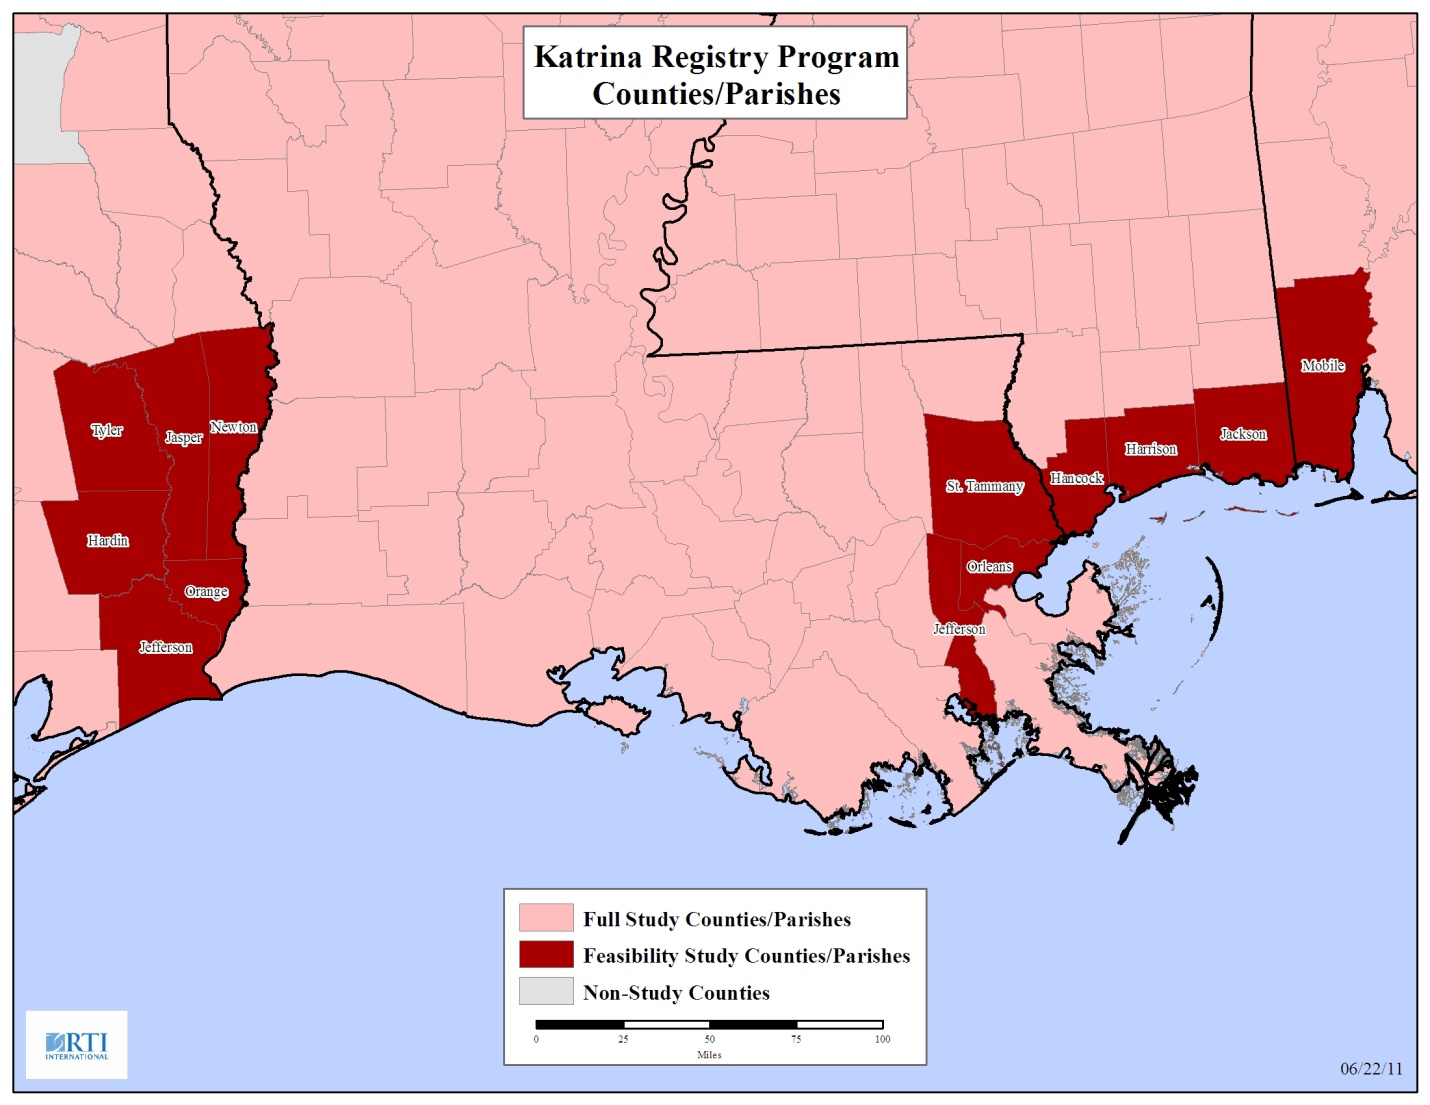
For the KPR feasibility study, the explicit stratification will consists of designated counties/parishes. That is, designated counties/parishes will be the sampling strata. There is one county in Alabama, three parishes in Louisiana, three counties in Mississippi, and six counties in Texas designated to be in the feasibility study. In each state the counties/parishes are contiguous. Table 1: Feasibility Study Counties/Parishes lists the counties/parishes that will be included in the feasibility study and the number of applicants in each county/parish.
Table 1. Feasibility Study Counties/Parishes
State |
County, State |
Applicants |
|
|
|
Alabama |
Mobile, AL |
1,788 |
|
|
|
Louisiana |
Orleans, LA |
24,239 |
Louisiana |
Jefferson, LA |
19,504 |
Louisiana |
St. Tammany, LA |
11,889 |
|
|
|
Mississippi |
Harrison, MS |
11,577 |
Mississippi |
Jackson, MS |
8,928 |
Mississippi |
Hancock, MS |
7,451 |
|
|
|
Texas |
Jefferson, TX |
1,604 |
Texas |
Orange, TX |
953 |
Texas |
Hardin, TX |
522 |
Texas |
Jasper, TX |
435 |
Texas |
Tyler, TX |
245 |
Texas |
Newton, TX |
175 |
|
|
|
The counties/parishes represent a mix of rural and urban parishes/counties. See Appendix B: Study Counties/Parishes for a map of study counties/parishes. Within each of these counties/parishes, we will use implicit stratification by Census tract to allocate the sample within the explicit sampling strata.
Sample Allocation
The sample size for the feasibility study was set at 17,000 applicants. The sample will be allocated proportionally based on the number of applicants across Alabama, Louisiana, Mississippi, and Texas. About 2% of the sample will be allocated to Alabama, about 62% to Louisiana, about 31% to Mississippi, and about 4% to Texas. These percentages represent the approximate population proportions of the applicants based on the applicant counts for Alabama (2%), Louisiana (62%), Mississippi (30%), and Texas (6%). Within each of the states, the sample will be allocated proportionally to the designated counties/parishes within the state. Within each of the designated counties, the sample will be proportionally allocated to the Census tracts. Appendix C: Feasibility Study Counties/Parishes Sample Allocation has a list of feasibility study counties/parishes and the sample allocation for these counties/parishes.
Applicant Selection
In general, sample selection will be stratified simple random sampling with proportional allocation. The probability of selection for the applicant will be the number of applicants selected for the sample in a sampling stratum divided by the total number of applicants in the sampling stratum. That is, the probability of selection for the ith applicant in the hth sampling stratum is, phi, will be
 ,
,
where nh is the number of applicants selected for the sample in the hth sampling stratum and Nh is the total number of applicants in the hth sampling stratum. The design weight for an applicant will be the inverse of the applicant probability of selection. That is, the design weight for the for the ith applicant in the hth sampling stratum, dhi, will be
 .
.
Snowball Sampling
For the pilot study, the focus will be on the applicants selected from the FEMA database that lived in THUs. For the full study, the focus will be on all adults who lived in THUs. To find all adults that lived in a THU, snowball sampling will be used. Snowball sampling is a process of asking the people, who have cooperated, about other people they know who meet the criteria to be included in the study. In order to investigate snowball sampling for the full study, an experiment has been proposed for its use with a small sample in the pilot. We propose to determine the size of this snowball sampling pilot after we have a sense of our early data collection unit costs compared to the registry budgeted assumptions.
To take a snowball sample of adults who lived in THUs, we would start with a randomly selected group of applicants (who have to be adults) from the FEMA database. This group would be an additional group added to the pilot sample. The selected applicants will be asked about other adults who lived in the THU in which the applicant lived. A list of other adults that lived in the THU will be constructed and contact information for these adults will be collected. The listed adults will be contacted as soon as possible, if feasible, immediately after the current interview. The listed adults will also be asked about other adults that lived in the THU and the process will continue for a number of steps that we will determine in collaboration with ATSDR after the pilot begins.
De-duplication
At the end of data collection, all the records for people who called in during the media campaign will be checked against the list of records for people on the ATSDR database. To account for transcription and other errors associated with the data items that we will have available to use in the merging process, RTI will use a “fuzzy matching” algorithm to perform the matching. RTI has experience using this algorithm for the World Trade Center Health Registry and Medical Expenditure Panel Survey. This algorithm will create three general groups of records. We will refer to the three groups as probable matches, ambiguous matches, and probable non-matches. For records identified as representing the same person, the system will designate one to be the active record, and the others will be flagged as duplicates. Duplicate records will not be used, other than to provide additional locating information for the active record associated with the duplicate(s). For the records identified as an ambiguous match, all the records will be reviewed manually to determine whether or not it is an actual match. Depending on the determination of the manual review, the record will be added to the database if it is a new record, i.e., a person not on the ATDSR database, or marked as a duplicate. For records identified as representing a new person a new record will be added to the database.
To ensure that the de-duplication algorithm is working effective for this project, we will test it on a small sample of records and manually check all the records to verify the results of the algorithm before applying the algorithm to the entire set of records. This testing of the de-duplication process will take place to ensure that 1) records that are duplicates are identified as such, and 2) records that are not duplicates are not identified as duplicates in error. After the algorithm has been verified for this project and applied to the entire set of records, all the ambiguous matches will be manually classified. For the probable matches and probable non-matches, a small sample will be selected for manual review to confirm the classification of the records has worked effectively for these two groups.
Appendix A: Distribution of Applicants

Appendix B: Study Counties/Parishes


Appendix C: Feasibility Study Counties/Parishes Sample Allocation (POS is the probability of selection and DW is the design weight.)
stateAlphaCode |
County, State |
Population |
|
|
|
Sample |
|
POS |
DW |
|
|
|
|
|
|
|
|
|
|
AL |
Mobile, AL |
1,788 |
|
|
|
340 |
|
0.1902 |
5.2588 |
AL |
Total |
1,788 |
|
% Sample |
0.02002 |
340 |
|
|
|
|
|
|
|
Sample Count |
340 |
|
|
|
|
|
|
|
|
|
|
|
|
|
|
TX |
Orange, TX |
953 |
|
|
|
181 |
|
0.1904 |
5.2523 |
TX |
Hardin, TX |
522 |
|
|
|
99 |
|
0.1904 |
5.2523 |
TX |
Jasper, TX |
435 |
|
|
|
83 |
|
0.1904 |
5.2523 |
TX |
Tyler, TX |
245 |
|
|
|
47 |
|
0.1904 |
5.2523 |
TX |
Newton, TX |
175 |
|
|
|
33 |
|
0.1904 |
5.2523 |
TX |
Total |
3,934 |
|
% Sample |
0.0440 |
749 |
|
|
|
|
|
|
|
Sample Count |
749 |
|
|
|
|
|
|
|
|
|
|
|
|
|
|
LA |
Orleans, LA |
24,239 |
|
|
|
4,614 |
|
0.1903 |
5.2535 |
LA |
Jefferson, LA |
19,504 |
|
|
|
3,713 |
|
0.1903 |
5.2535 |
LA |
St. Tammany, LA |
11,889 |
|
|
|
2,263 |
|
0.1903 |
5.2535 |
LA |
Total |
55,632 |
|
% Sample |
0.6229 |
10,589 |
|
|
|
|
|
|
|
Sample Count |
10,589 |
|
|
|
|
|
|
|
|
|
|
|
|
|
|
MS |
Harrison, MS |
11,577 |
|
|
|
2,204 |
|
0.1903 |
5.2535 |
MS |
Jackson, MS |
8,928 |
|
|
|
1,699 |
|
0.1903 |
5.2535 |
MS |
Hancock, MS |
7,451 |
|
|
|
1,418 |
|
0.1903 |
5.2535 |
MS |
Total |
27,956 |
|
% Sample |
0.3130 |
5,321 |
|
|
|
|
|
|
|
Sample Count |
5,321 |
|
|
|
|
|
|
|
|
|
|
|
|
|
|
All States |
Total |
89,310 |
|
Sample Size |
17,000 |
17,000 |
|
|
|
|
|
|
|
|
Target |
Actual |
|
|
|
| File Type | application/vnd.openxmlformats-officedocument.wordprocessingml.document |
| Author | dcreel |
| File Modified | 0000-00-00 |
| File Created | 2021-01-31 |
© 2026 OMB.report | Privacy Policy