Att I - Power Calculations
Resubmission_ICR#0923-09BK_Appendix I_Power Calculations.doc
Registration of Individuals Displaced by Hurricanes Katrina and Rita (Pilot Project)
Att I - Power Calculations
OMB: 0923-0045
Appendix I
Power Calculations for Katrina Pilot Registry
This document describes the power calculations for the Katrina Pilot Registry (KPR) sample. The focus of the power calculations is on prevalence rates. The first section presents a table of prevalence rates calculated from the most recent National Health and Nutrition Examination Survey (NHANES 2007-2008). Prevalence rates for these same questions, or very similar questions, will be produced from KPR sample and compared to the NHANES estimates. Section two presents the power calculations to determine the necessary analytic samples sizes to make these comparisons.
1. Prevalence Rates from the Most Recent NHANES Data Set
Exhibit 1 illustrates the variety of prevalence rates based on the most recent NHANES data set. The prevalence rates range from a low of about 2 percent to a high of about 75 percent, with some prevalence rates grouping around 2, 6, 10, 14, 50, and 75 percent. Consequently, we will investigate the percentages in the power calculations.
Exhibit 1. Prevalence Rates from the Most Recent NHANES Data Set
Question |
Prevalence Rate (%) |
Standard Error (%) |
HLTH1. (Do you/Does SUBJECT) usually cough on most days for 3 consecutive months or more during the year? |
12.63
|
1.29
|
HLTH3. (Do you/Does SUBJECT) bring up phlegm on most days for 3 consecutive months or more during the year? |
9.16
|
0.74
|
HLTH5. In the past 12 months (have you/has SUBJECT) had wheezing or whistling in (your/his/her) chest? |
14.89
|
1.03
|
HLTH8. [In the past 12 months], has (your/SUBJECT's) chest sounded wheezy during or after exercise or physical activity? |
46.31
|
1.34
|
HLTH10. [In the past 12 months], (have you/has SUBJECT) taken any medication, prescribed by a doctor, for wheezing or whistling? |
51.42
|
2.13
|
HLTH13. [In the past 12 months], (have you/has SUBJECT) had a dry cough at night not counting a cough associated with a cold or chest infection lasting 14 days or more? |
5.85
|
0.67
|
HLTH14. (Have you/Has SUBJECT) had shortness of breath either when hurrying on the level or walking up a slight hill? |
32.19
|
1.68
|
HLTH15. Have you/SUBJECT ever been told by a doctor or other health professional that you/SUBJECT had this symptom/condition? |
|
|
Asthma |
14.10 |
0.85 |
Chronic bronchitis |
5.94 |
0.79 |
Depression/anxiety/emotional problem causes difficulty with activity (only reported for people who have difficulty with an activity) |
7.40 |
0.29 |
HLTH19. During the past 30 days, how often did (you/SUBJECT) feel ... |
|
|
So sad nothing cheers you up, past 30 days |
|
|
All of the time |
0.94 |
0.06 |
Most of the time |
2.04 |
0.07 |
Some of the time |
7.69 |
0.17 |
A little of the time |
12.70 |
0.22 |
How often felt nervous, past 30 days |
|
|
All of the time |
1.49 |
0.07 |
Most of the time |
2.28 |
0.09 |
Some of the time |
10.93 |
0.21 |
A little of the time |
18.20 |
0.28 |
How often restless/fidgety, past 30 days |
|
|
All of the time |
2.08 |
0.09 |
Most of the time |
3.08 |
0.10 |
Some of the time |
11.36 |
0.20 |
A little of the time |
15.03 |
0.24 |
How often felt hopeless, past 30 days |
|
|
All of the time |
0.81 |
0.06 |
Most of the time |
1.28 |
0.06 |
Some of the time |
4.10 |
0.12 |
A little of the time |
5.45 |
0.14 |
How often felt everything was an effort, past 30 days |
|
|
All of the time |
2.22 |
0.09 |
Most of the time |
2.83 |
0.10 |
Some of the time |
7.98 |
0.18 |
A little of the time |
9.95 |
0.21 |
How often felt worthless, past 30 days |
|
|
All of the time |
0.80 |
0.06 |
Most of the time |
0.96 |
0.06 |
Some of the time |
3.23 |
0.11 |
A little of the time |
3.98 |
0.12 |
HLTH20. We just talked about a number of feelings (you/SUBJECT) had during the past 30 days. Altogether, how much did these feelings interfere with your life or activities: a lot, some, a little, or not at all? |
|
|
A lot |
12.47 |
0.33 |
Some |
21.22 |
0.43 |
A little |
28.67 |
0.52 |
SMOKE1. Have you smoked at least 100 cigarettes in your entire life? |
47.12
|
1.69
|
ALC1. In any one year, have you had at least 12 drinks of any type of alcoholic beverage? |
75.05
|
1.47
|
ALC2. In your entire life, have you had at least 12 drinks of any type of alcoholic beverage? |
54.21
|
2.73
|
ALC6. Was there ever a time or times in your life when you drank 5 or more drinks of any kind of alcoholic beverage almost every day? |
16.04
|
0.89
|
2. Power Calculations
The power calculations were produced using PASS 20081 software. Given the respondent sample size of 5,000 expected for the KPR sample, 80 percent power is achieved to detect differences of about +/- 1 percent age point for the KPR prevalence rates compared to the NHANES prevalence rate of 2 percent; differences of about +/- 2 percent age points for the KPR prevalence rates compared to the NHANES prevalence rates of 6, 10, and 14 percent; and differences of about +/- 3 percentage points for the KPR prevalence rates compared to the NHANES prevalence estimates of 50 or 75 percent. The test statistic used is the two-sided Z test with pooled variance. The significance level of the test was targeted at 0.05.
The following Exhibits are graphical representations of the relationship between sample size and KPR prevalence rate given a specific NHANES prevalence rate. The vertical axis (N1) is the sample size necessary to detect the difference between the KRP prevalence on the horizontal axis (P1) and the given NHANES prevalence rate with 80 percent power and alpha 0.05. Any point representing a sample size less than 5,000 will be able to detect a difference between the corresponding KPR prevalence rate and the given NHANES prevalence rate with 80 percent power, if the difference exists. In each exhibit, the point that drops down to the horizontal axis is the NHANES prevalence rate. Consequently, the center of each graph looks like a V. This portion of the graph should be ignored because we are look for differences from the value at the bottom part of the V in the graph. For an example, we will interpret Exhibit 2.
Exhibit 2 is the graphical representation of the sample size and the KPR prevalence given an NHANES prevalence rate of 6 percent, or a proportion of 0.06. This is also the value at the bottom part of the V in the graph so we are actually looking for differences from this value. We should ignore the part of the graph where the KPR prevalence is between 5 percent, i.e., 0.05 on the horizontal axis, and 7 percent, i.e., 0.07 on the horizontal axis. If the KPR prevalence rate is 5 percent, or a proportion of 0.05, the required analytic sample size is about 8,200. If the KPR prevalence rate is 7 percent, or a proportion of 0.07, the required analytic sample size is about 9,500. These are differences of +/- 1 percentage point, and the samples sizes required to detect these differences are larger than the anticipated KPR sample size. If the KPR prevalence rate is 4 percent, or a proportion of 0.04, the required analytic sample size is about 1,850. If the KPR prevalence rate is 8 percent, or a proportion of 0.08, the required analytic sample size is about 2,550. These are differences of +/- 2 percentage points, and the samples sizes required to detect these differences are smaller than the anticipated KPR sample size. Therefore, if these differences actually exist, we will at least 80 percent power to detect these differences.
Exhibit 2. Sample Size and KPR Prevalence Given NHANES Prevalence of 6 Percent
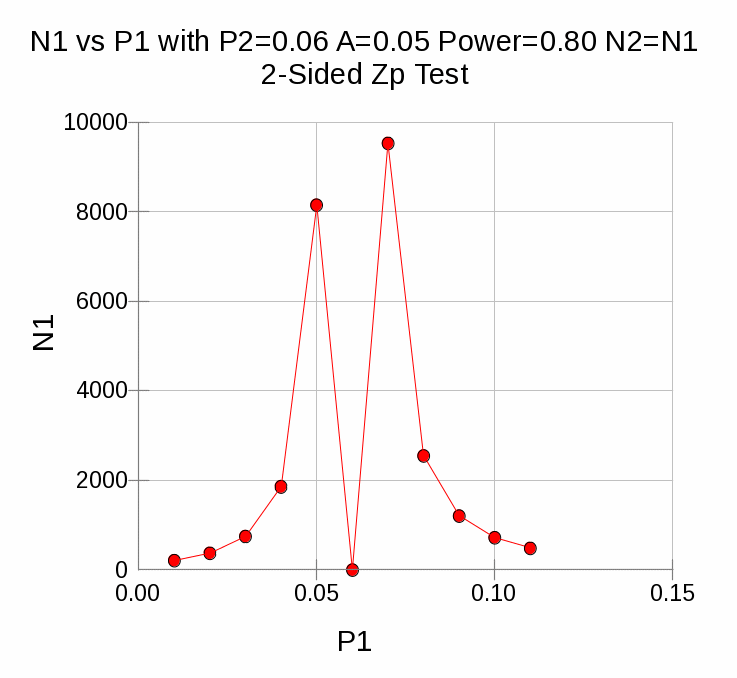
Exhibit 3. Sample Size and KPR Prevalence Given NHANES Prevalence of 10 Percent
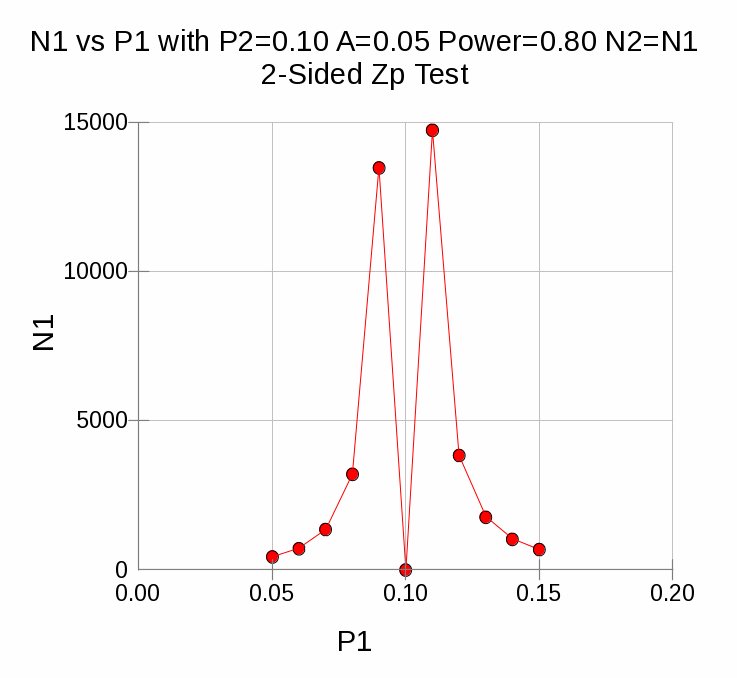
Exhibit 4. Sample Size and KPR Prevalence Given NHANES Prevalence of 14 Percent
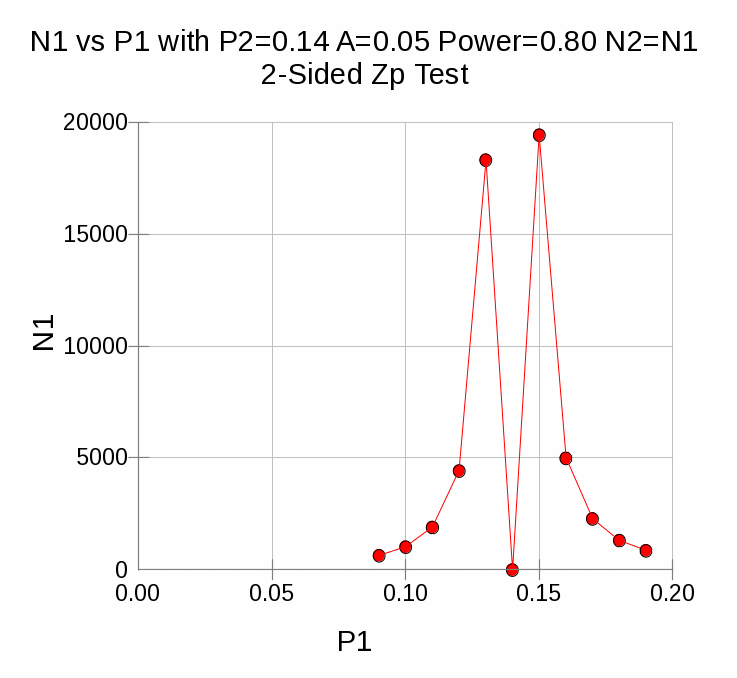
Exhibit 5. Sample Size and KPR Prevalence Given NHANES Prevalence of 50 Percent
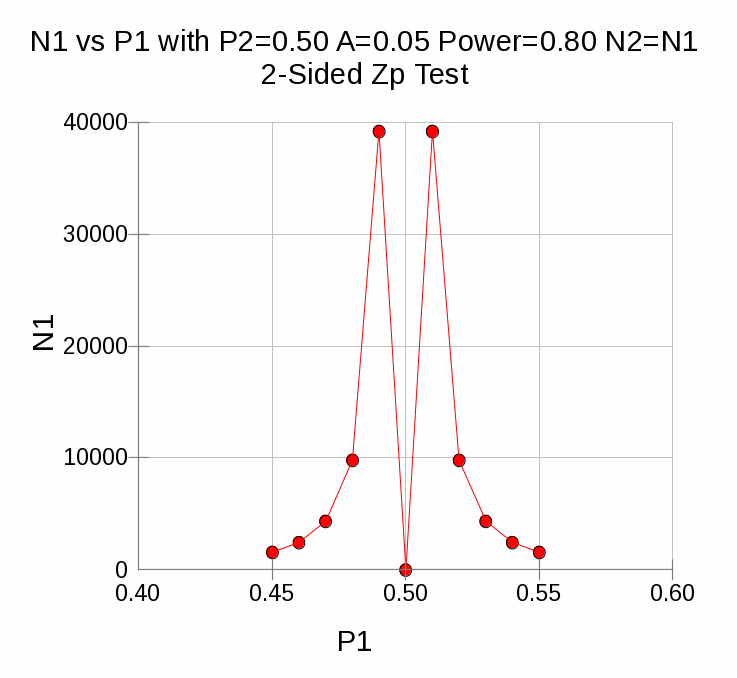
Exhibit 6. Sample Size and KPR Prevalence Given NHANES Prevalence of 75 Percent
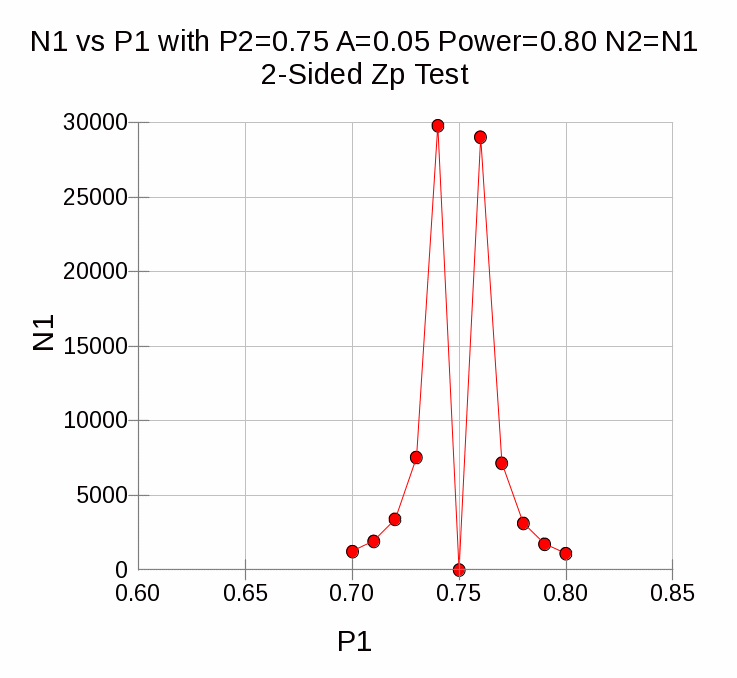
Exhibit 7. Sample Size and KPR Prevalence Given NHANES Prevalence of 2 Percent
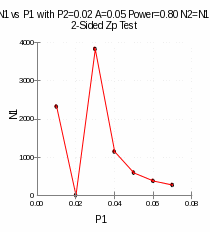
Table 1. Sample Size and KPR Prevalence Given NHANES Prevalence
-
Power
Target Alpha
NHANES Prevalence
Proportion Pilot Registry
Sample size
.80
.05
.02
.01
2319
.03
3826
.04
1141
.80
.05
.06
.04
1186
.07
9540
.08
2554
.80
.05
.10
.08
3213
.09
13495
.11
14751
.12
3841
.80
.05
.14
.12
4438
.13
18330
.15
19461
.16
5003
.17
2284
.80
.05
.50
.46
2448
.47
4356
.48
9806
.52
9806
.53
4356
.54
2448
.80
.05
.75
.72
3397
.73
7550
.77
7157
.78
3135
1 Hintze, Jerry L. (2008). PASS 2008. Utah: Kaysville.
| File Type | application/msword |
| Author | dcreel |
| Last Modified By | Wald, Marlena (CDC/ONDIEH/NCEH) |
| File Modified | 2011-12-19 |
| File Created | 2011-12-19 |
© 2026 OMB.report | Privacy Policy